. 2023 Feb 15;111(4):481-492.e8.
doi: 10.1016/j.neuron.2022.11.016. Epub 2022 Dec 27.

Disruption of the ATXN1-CIC complex reveals the role of additional nuclear ATXN1 interactors in spinocerebellar ataxia type 1

Affiliations

Disruption of the ATXN1-CIC complex reveals the role of additional nuclear ATXN1 interactors in spinocerebellar ataxia type 1

Stephanie L Coffin et al. Neuron. .

Erratum in

Abstract

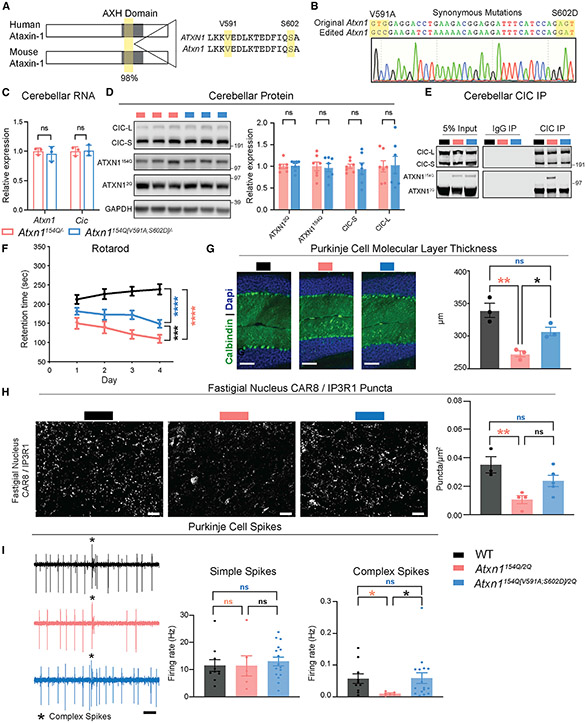
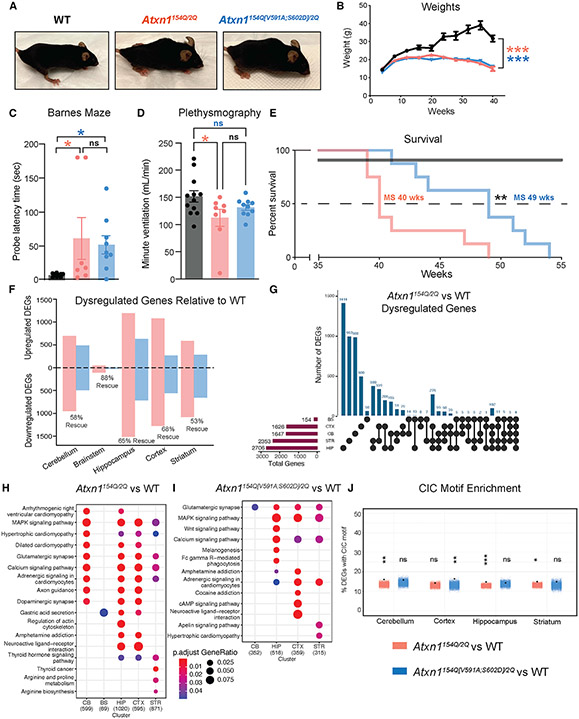
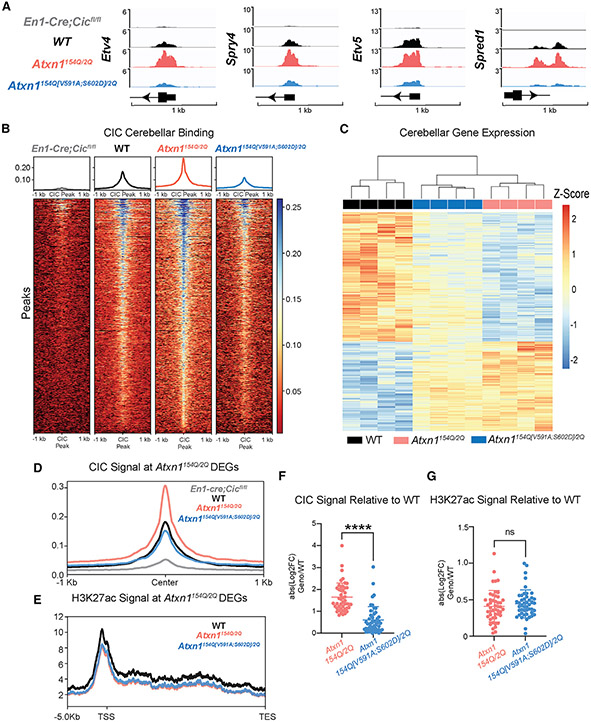
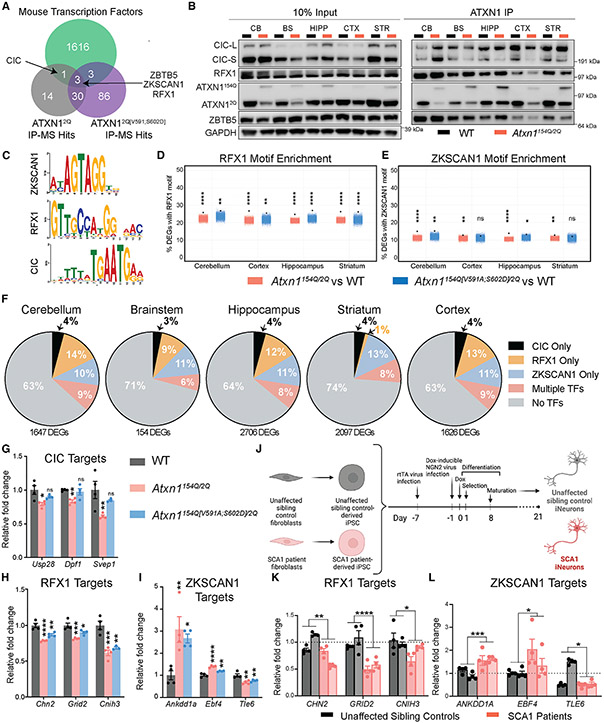
Spinocerebellar ataxia type 1 (SCA1) is a paradigmatic neurodegenerative disease in that it is caused by a mutation in a broadly expressed protein, ATXN1; however, only select populations of cells degenerate. The interaction of polyglutamine-expanded ATXN1 with the transcriptional repressor CIC drives cerebellar Purkinje cell pathogenesis; however, the importance of this interaction in other vulnerable cells remains unknown. Here, we mutated the 154Q knockin allele of Atxn1154Q/2Q mice to prevent the ATXN1-CIC interaction globally. This normalized genome-wide CIC binding; however, it only partially corrected transcriptional and behavioral phenotypes, suggesting the involvement of additional factors in disease pathogenesis. Using unbiased proteomics, we identified three ATXN1-interacting transcription factors: RFX1, ZBTB5, and ZKSCAN1. We observed altered expression of RFX1 and ZKSCAN1 target genes in SCA1 mice and patient-derived iNeurons, highlighting their potential contributions to disease. Together, these data underscore the complexity of mechanisms driving cellular vulnerability in SCA1.

Keywords: ATXN1; CIC; CUT&RUN; SCA1; neurodegeneration; polyglutamine expansion disorders; proteomics; regional vulnerability; spinocerebellar ataxia type 1; transcriptomics.


Conflict of interest statement

Declaration of interests H.Y.Z. is a co-founder of Cajal Neuroscience and a member of its scientific advisory board. H.Y.Z. is a science partner at the Column Group and a board member of Regeneron. H.Y.Z. collaborates with UCB and Ionis Pharmaceuticals on projects not relevant to this publication.

Figures

Figure 1.
Figure 1.. ATXN1-CIC complex is critical for SCA1 pathogenesis in cerebellar Purkinje cells
(A) Conservation of ATXN1 AXH domain and amino acids V591 and S602 in human and mouse. (B) Sanger sequencing confirming the correct mutation of V591 and S602 and synonymous mutations in Atxn1154Q[V591A;S602D]/2Q F1 offspring. (C) Quantification of Atxn1 and Cic RNA levels in the cerebellum of mice at 4 weeks of age. Atxn1 and Cic were normalized to Gapdh, n = 3. (D) Representative western blot and quantification of ATXN1 and CIC protein levels in the cerebellum of mice at 4 weeks of age. ATXN1 and CIC were normalized to GAPDH, n = 7. (E) Representative western blot showing the pull-down of ATXN1 and CIC upon immunoprecipitation (IP) of CIC in cerebella of mice at 4 weeks of age. (F) Rotarod assay in mice at 24 weeks of age. n = 9–14. (G) Cerebellar Purkinje cells stained with DAPI and Calbindin at 40 weeks of age (original magnification ×20, scale bars, 100 μm) and quantification of the molecular layer thickness of the cerebellum in lobules V and VI, n = 3. (H) Representative images of CAR8/IP3R1 expression in the fastigial nucleus (scale bars, 20 μm) and quantification of CAR8/IP3R1 puncta, n = 3–5. (I) 1 s example recordings of Purkinje neuron firing. Scale bars, 0.1 s. Complex spike, * (left). Firing rate of Purkinje neurons simple spikes (middle) and complex spikes (right). n = 3, number of cells (c) = 6–16. t tests were used for (C) and (D); two-way ANOVA with Tukey’s multiple comparisons was used for (F); one-way ANOVAs with Tukey’s multiple comparisons were used for (G), (H), and (I). In each case, *, **, ***, ****, and ns denote p < 0.05, p < 0.01, p < 0.001, p < 0.0001, and p > 0.05, respectively. All data are represented as mean ± SEM. See also Figure S1.
Figure 2.
Figure 2.. Global loss of the ATXN1154Q-CIC interaction partially improves some SCA1 neurological phenotypes
(A) Atxn1154Q/2Q and Atxn1154Q[V591A;S602D]/2Q but not WT mice develop kyphosis, shown at 36 weeks of age. (B) Monthly weights, n = 13–19. (C) Barnes maze at 14 weeks of age. (D) Minute ventilation as measured via plethysmography at 40 weeks of age. (E) Survival analysis. (F) Up and downregulated differentially expressed genes (DEGs) by brain region. Dysregulated genes were determined as having an adjusted p value < 0.05. Rescued genes were determined as having an adjusted p value < 0.05 in the Atxn1154Q/2Q mouse model and an adjusted p value > 0.05 in the Atxn1154Q[V591A;S602D]/2Q mouse model. Bulk RNA sequencing was conducted at 10 weeks of age, n = 3–4. (G) UpSet plot of dysregulated genes in Atxn1154Q/2Q mouse model by brain region. (H) Dot plot of KEGG pathways enriched in Atxn1154Q/2Q DEGs by brain region. (I) Dot plot of KEGG pathways enriched in Atxn1154Q[V591A;S602D]/2Q DEGs by brain region. (J) Jitter plot of CIC motif enrichment in Atxn1154Q/2Q and Atxn1154Q[V591A;S602D]/2Q DEGs by brain region. The black dot indicates % DEGs with CIC motif within 1 kb of the transcriptional start site from each respective RNA-seq dataset. Colored jitter plot represents the % of non-DEGs with motif calculated over 10,000 random iterations. For each assay, a minimum of 8 mice were used unless otherwise specified. Two-way ANOVA with Tukey’s multiple comparisons was used for (B); one-way ANOVAs with Tukey’s multiple comparisons test were used for (C) and (D); Mantel-Cox log-rank was used for (E). In each case, *, **, ***, ****, and ns denote p < 0.05, p < 0.01, p < 0.001, p < 0.0001, and p > 0.05, respectively. All data are represented as mean ± SEM. See also Figure S1.
Figure 3.
Figure 3.. Molecular characterization of Atxn1154Q[V591A;S602D]/2Q mice demonstrates CIC-dependent and independent contributions to SCA1
(A) Integrative Genomics Viewer (IGV) tracks displaying CIC binding of validated CIC targets Etv4, Spry4, Etv5, and Spred1 from CUT&RUN, 10 weeks of age, n = 3–4. (B) Heatmap of CIC signal at CIC peaks. (C) Heatmap of cerebellar Atxn1154Q/2Q differentially expressed genes (DEGs). (D) CIC signal plot at Atxn1154Q/2Q DEGs with CIC peaks. (E) H3K27ac signal plot throughout promoter and gene body at Atxn1154Q/2Q DEGs. (F) Quantification of CIC signal using the absolute value log2 fold change of Atxn1154Q/2Q and Atxn1154Q[V591A;S602D]/2Q compared with WT. (G) Quantification of H3K27ac signal using the absolute value log2-fold change of Atxn1154Q/2Q and Atxn1154Q[V591A;S602D]/2Q compared with WT. Mann-Whitney tests were used for (F) and (G). In each case, *, **, ***, ****, and ns denote p < 0.05, p < 0.01, p < 0.001, p < 0.0001, and p > 0.05, respectively. See also Figure S2.
Figure 4.
Figure 4.. Additional ATXN1 interacting transcription factors regulate genes altered in SCA1
(A) Proteins identified by IP-MS of ATXN1 in cerebellar tissue at 4 weeks of age and intersected with mouse transcription factors. (B) IP of ATXN1 and blotting for transcription factors CIC, RFX1, and ZBTB5 in 4-week cerebellar tissue. (C–E) (C) Comparison of available consensus motifs for RFX1, ZKSCAN1, and CIC. Jitter plot of (D) RFX1 and (E) ZKSCAN1 motif enrichment in Atxn1154Q/2Q and Atxn1154Q[V591A;S602D]/2Q DEGs by brain region. The black dot indicates % DEGs with motif within 1 kb of the transcriptional start site from each respective RNA-seq dataset. Colored jitter plot represents the % of non-DEGs with motif calculated over 10,000 random iterations. (F–I) (F) Pie charts of Atxn1154Q/2Q DEGs parsed by which contain CIC, RFX1, or ZKSCAN1 peaks analyzed across brain regions. “Multiple TFs” refers to Atxn1154Q/2Q DEGs that contain transcription factors motifs from two or more factors. Bar plots of relative normalized RNA-seq gene counts of Atxn1154Q/2Q DEGs in the cerebellum that contain a (G) CIC, (H) RFX1, or (I) ZKSCAN1 peak. (J–L) (J) Cartoon demonstrating differentiation process of SCA1 and healthy patient control iPSCs into iNeurons. Cartoon generated using Biorender.com. Bar chart demonstrating RT-qPCR RNA expression data from genes regulated by (K) RFX1 or (L) ZKSCAN1 in human iPSC-derived iNeurons. Each bar represents an original biological sample collected (2 healthy controls and 2 SCA1 patients), and each data point within the bar represents a line generated from that sample (n = 4). One-way ANOVAs with Dunnett’s multiple comparisons test were used for (G), (H), and (I). t tests were used in (K) and (L). in each case, *, **, ***, **** and ns denote p < 0.05, p < 0.01, p < 0.001, p < 0.0001 and p > 0.05, respectively. All data are represented as mean ± SEM. See also Figure S3.

Comment in

References

    1. Pandya VA, and Patani R (2021). Region-specific vulnerability in neurodegeneration: lessons from normal ageing. Ageing Res. Rev 67, 101311. 10.1016/j.arr.2021.101311. - DOI - PMC - PubMed
    1. Opal P, and Ashizawa T (1998). Spinocerebellar ataxia type 1. GeneReviews (University of Washington; ), pp. 1–12. https://www.ncbi.nlm.nih.gov/books/NBK1184/.
    1. Zoghbi HY, and Orr HT (1995). Spinocerebellar ataxia type 1. Semin. Cell Biol 6, 59–62. 10.1016/B978-0-12-374105-9.00198-2. - DOI - PubMed
    1. Orr HT, Chung M, Banfi S, Kwiatkowski TJ Jr., Servadio A, Beaudet AL, McCall AE, Duvick LA, Ranum LP, and Zoghbi HY (1993). Expansion of an unstable trinucleotide CAG repeat in spinocerebellar ataxia type 1. Nat. Genet 4, 221–226. 10.1038/ng0793-221. - DOI - PubMed
    1. Banfi S, Servadio A, Chung MY, Kwiatkowski TJ, McCall AE, Duvick LA, Shen Y, Roth EJ, Orr HT, and Zoghbi HY (1994). Identification and characterization of the gene causing type 1 spinocerebellar ataxia. Nat. Genet 7, 513–520. 10.1038/ng0894-513. - DOI - PubMed

Publication types