Comment
. 2023 Feb 15;111(4):493-507.e6.
doi: 10.1016/j.neuron.2022.11.017. Epub 2022 Dec 27.

Decreasing mutant ATXN1 nuclear localization improves a spectrum of SCA1-like phenotypes and brain region transcriptomic profiles

Affiliations
Comment

Decreasing mutant ATXN1 nuclear localization improves a spectrum of SCA1-like phenotypes and brain region transcriptomic profiles

Hillary P Handler et al. Neuron. .

Abstract

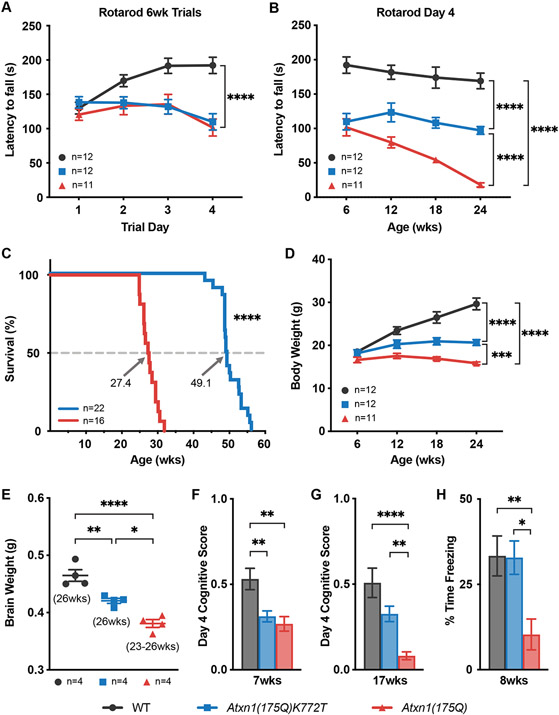
Spinocerebellar ataxia type 1 (SCA1) is a dominant trinucleotide repeat neurodegenerative disease characterized by motor dysfunction, cognitive impairment, and premature death. Degeneration of cerebellar Purkinje cells is a frequent and prominent pathological feature of SCA1. We previously showed that transport of ATXN1 to Purkinje cell nuclei is required for pathology, where mutant ATXN1 alters transcription. To examine the role of ATXN1 nuclear localization broadly in SCA1-like disease pathogenesis, CRISPR-Cas9 was used to develop a mouse with an amino acid alteration (K772T) in the nuclear localization sequence of the expanded ATXN1 protein. Characterization of these mice indicates that proper nuclear localization of mutant ATXN1 contributes to many disease-like phenotypes including motor dysfunction, cognitive deficits, and premature lethality. RNA sequencing analysis of genes with expression corrected to WT levels in Atxn1175QK772T/2Q mice indicates that transcriptomic aspects of SCA1 pathogenesis differ between the cerebellum, brainstem, cerebral cortex, hippocampus, and striatum.

Keywords: SCA1; neurodegeneration; nuclear localization; spinocerebellar ataxia type 1.


Conflict of interest statement

Declaration of interests The authors declare no competing interests.

Figures

Figure 1.
Figure 1.. Generation of the Atxn1175QK772T/2Q mouse model
(A) CRISPR-Cas9 strategy used to create the Atxn1175QK772T/2Q mouse model. The K772T alteration in the nuclear localization sequence (NLS) of mouse ATXN1 protein was introduced by changing three nucleotides (bold) in the DNA sequence of the Atxn1 gene. Two nucleotide alterations (AG → CC) changed a lysine codon at position 772 of the ATXN1 protein to a threonine codon (black). Another nucleotide alteration (C → T) ablated the PAM site (blue) and introduced an Alu1 restriction enzyme digest site (red). (B) Sanger sequencing confirming the animals used for breeding were heterozygous for all three desired nucleotide changes.
Figure 2.
Figure 2.. Key SCA1-like phenotypes
(A) Rotarod assessment learning among naïve mice across 4 trial days at 6 weeks of age. (B) Rotarod performance on trial day 4 between 6 and 24 weeks of age. (C) Mouse survival plotted as Kaplan-Meyer curves with median lifespan labeled for each genotype. For Atxn1(175Q)K772T n=22 and Atxn1(175Q) n=16. Statistical comparison of survival curves was performed using log-rank Mantel-Cox and Gehan-Breslow-Wilcoxon tests. (D) Body weight measurements between 6 and 24 weeks of age. (E) Brain weight measurements at 23-26 weeks of age. For all genotypes, n=4. (F) Barnes maze assessment cognitive scores on trial day 4 at 7 weeks of age. (G) Barnes maze assessment cognitive scores on trial day 4 at 17 weeks of age. (H) Contextual fear conditioning assessment freezing time percentage among naïve mice at 8 weeks of age. Data in (A), (B), and (D) are from the same cohort of mice. N values for each genotype are shown in the bottom of each bar in (F-H). Data in (A), (B), (D), (E), (F), (G), and (H) are represented as mean ± SEM. Two-way repeated measures ANOVAs with Tukey’s post hoc test were performed for (A), (B), and (D). One-way ANOVA with Tukey’s post hoc test was performed for (E-H). Statistical significance is depicted only for genotype comparisons at the last timepoint assessed in (A), (B), and (D). Significant results are denoted as * (p<0.05), ** (p<0.01), *** (p<0.001), and **** (p<0.0001). Additional statistical analyses details are in Table S1. See also Figure S1
Figure 3.
Figure 3.. 10-week striatum expression
(A, D, and E) Expression of Darpp-32 (A), Drd1 (D), and Drd2 (E) RNA (transcripts per million; TPM) in striatum at 10 weeks of age. (B) DARPP-32 protein expression in striatum at 10 weeks of age. Quantification of Western blot shown in (C). (C) Western blot used to quantify DARPP-32 protein expression in striatum at 10 weeks of age. Data in (A), (D), and (E) are from the same cohort of mice. N = 4 mice per genotype in all data shown. Data in (A), (B), (D) and (E) are represented as mean ± SEM and One-way ANOVA with Tukey’s post hoc test was performed. Significant results are denoted as ** (p<0.01), *** (p<0.001), and **** (p<0.0001). Additional statistical analyses details are in Table S1.
Figure 4.
Figure 4.. Subcellular fractionation
(A and B) Subcellular fractionation Western blot used to quantify nuclear proportion of expanded ATXN1 from cerebellar lysates in Atxn1(175Q) and Atxn1(175Q)K772T mice at 5 weeks of age (A) and in Atxn1(175Q)K772T mice at 40 weeks of age (B). GAPDH was used as a cytoplasmic marker and H1 was used as a nuclear marker to confirm purity of subcellular fractions. N=4 mice per genotype at 5 weeks of age (A) and n=6 mice at 40 weeks of age (B). (C-G) Proportion of expanded ATXN1 in the nucleus of cells from the cerebellum (C), cerebral cortex (D), hippocampus (E), medulla (F), and striatum (G) at 5 weeks for Atxn1(175Q) and Atxn1(175Q)K772T mice and at 40-42 weeks for Atxn1(175Q)K772T mice. For all brain regions, n=4 mice per genotype at 5 weeks of age and n=4-6 mice at 40-42 weeks of age. Nuclear proportion of ATXN1 was determined by dividing the intensity of nuclear expanded ATXN1 bands by the intensity of expanded ATXN1 bands in the nucleus and cytoplasm combined for a given genotype at a given time. The dashed line represents the average nuclear proportion of ATXN1[2Q] protein product across the three assessments for a particular brain region. (H) Relationship between extractability of ATXN1[175Q]K772T and proportion of ATXN1[175Q]K772T found in the cytoplasm for all brain regions assessed. Simple linear regression was performed excluding the medulla data. Data in (C-H) are represented as mean ± SEM. One-way ANOVAs with Dunnett’s post hoc test relative to the nuclear proportion of ATXN1[175QK772T] at 5 weeks were performed for (C-G). Significant results are denoted as * (p<0.05), ** (p<0.01), *** (p<0.001), and **** (p<0.0001). Statistical analysis details are in Table S1. See also Figure S2, S3, S4, and S5
Figure 5.
Figure 5.. ATXN1 nuclear inclusions
(A and D) Immunofluorescent staining in cerebellar Purkinje cells of Atxn1(175Q) (A) and Atxn1(175Q)K772T (D) mice at 21 weeks of age. ATXN1 is shown in red, NUP62 is shown in green, and CALB1 is shown in blue. (B and E) Nuclear mask generated by Imaris using NUP62 staining in Purkinje cells of Atxn1(175Q) (B) and Atxn1(175Q)K772T (E) mice at 21 weeks of age. (C and F) ATXN1 staining under the nuclear mask in Purkinje cells of Atxn1(175Q) (C) and Atxn1(175Q)K772T (F) mice at 21 weeks of age. (G-N) Percentage of nuclei analyzed with at least one ATXN1 inclusion present in Atxn1(175Q) and Atxn1(175Q)K772T cerebellar Purkinje cells at 21 weeks (G), ventral medulla at 12 weeks (H), cerebral cortex at 13 weeks (I), CA1 of the hippocampus at 12 weeks (J), and striatum at 12 weeks (K), cerebral cortex at 5 weeks (L), CA1 of the hippocampus at 5 weeks (M), striatum at 5 weeks (N). For all brain regions at all time points, n=3 mice per genotype. Data are represented as mean ± SEM. Unpaired two-tailed t tests were performed. Significant results are denoted as * (p<0.05), ** (p<0.01), *** (p<0.001), and **** (p<0.0001). Statistical analysis details are in Table S1. See also Figure S6
Figure 6.
Figure 6.. RNAseq analyses
(A) Significantly differentially expressed gene numbers between WT and Atxn1(175Q) mice (black) and between WT and Atxn1(175Q)K772T mice (gray) in cerebellum, medulla, cerebral cortex, striatum, and hippocampus tissue at 26 weeks of age. Genes that were significantly differentially expressed in the comparison between WT and Atxn1(175Q) mice and were not significantly differentially expressed in the comparison between WT and Atxn1(175Q)K772T mice were considered corrected by the K772T mutation. The percentage of genes corrected for each brain region is listed below the bar graph. For all genotypes, n=4 mice. (B) Brain region(s) where the top 500 corrected genes (genes with the largest absolute value Log2(Fold Change) in the comparison between WT and Atxn1(175Q) mice) from each region are found to be significantly differentially expressed. (C-E) Jitter plots of motif enrichment among genes corrected by the NLS mutation relative to genes that are not significantly differentially expressed in the WT vs. Atxn1(175Q) comparison. Black dots indicate the percentage of corrected genes with a CIC (C), RFX1 (D), or ZKSCAN1 (E) motif within 1kb of the transcriptional start site for genes in each brain region. Colored jitter plot dots represent the percentage of non-differentially expressed genes with a given motif within 1kb of the transcriptional start site. Each colored jitter plot dot represents one of 10,000 random iterations selecting a set of genes the same size as the number of corrected genes in each brain region. P value was computed as (r+1)/(n+1) where r is the number of repetitions where percent motifs in selected non-differentially expressed genes is greater than the percent of motifs or peaks in DEGs experimentally determined and n is the total number of repetitions.
Figure 7.
Figure 7.. Corrected Gene Pathway enrichment
Pathway analysis of the top 500 corrected genes from each brain region performed using the molecular function domain of the Gene Ontology database.

Comment in

Comment on

References

    1. Paulson HL, Shakkottai VG, Clark HB, and Orr HT (2017). Polyglutamine spinocerebellar ataxias-from genes to potential treatments. Nat. Rev. Neurosci 18, 613–626. 10.1038/nrn.2017.92. - DOI - PMC - PubMed
    1. Klement IA, Skinner PJ, Kaytor MD, Yi H, Hersch SM, Clark HB, Zoghbi HY, and Orr HT (1998). Ataxin-1 Nuclear Localization and Aggregation. Cell 95, 41–53. 10.1016/S0092-8674(00)81781-X. - DOI - PubMed
    1. Peters MF, Nucifora FC, Kushi J, Seaman HC, Cooper JK, Herring WJ, Dawson VL, Dawson TM, and Ross CA (1999). Nuclear targeting of mutant huntingtin increases toxicity. Mol. Cell. Neurosci 14, 121–128. 10.1006/mcne.1999.0773. - DOI - PubMed
    1. Nucifora FC, Ellerby LM, Wellington CL, Wood JD, Herring WJ, Sawa A, Hayden MR, Dawson VL, Dawson TM, and Ross CA (2003). Nuclear localization of a non-caspase truncation product of atrophin-1, with an expanded polyglutamine repeat, increases cellular toxicity. J. Biol. Chem 278, 13047–13055. 10.1074/jbc.M211224200. - DOI - PubMed
    1. Bichelmeier U, Schmidt T, Hübener J, Boy J, Rüttiger L, Häbig K, Poths S, Bonin M, Knipper M, Schmidt WJ, et al. (2007). Nuclear localization of ataxin-3 is required for the manifestation of symptoms in SCA3: In vivo evidence. J. Neurosci 27, 7418–7428. 10.1523/JNEUROSCI.4540-06.2007. - DOI - PMC - PubMed

Publication types

LinkOut - more resources