

Distinct blood inflammatory biomarker clusters stratify host phenotypes during the middle phase of COVID-19
- PMID: 36577783
- PMCID: PMC9795438
- DOI: 10.1038/s41598-022-26965-7
Distinct blood inflammatory biomarker clusters stratify host phenotypes during the middle phase of COVID-19
Abstract
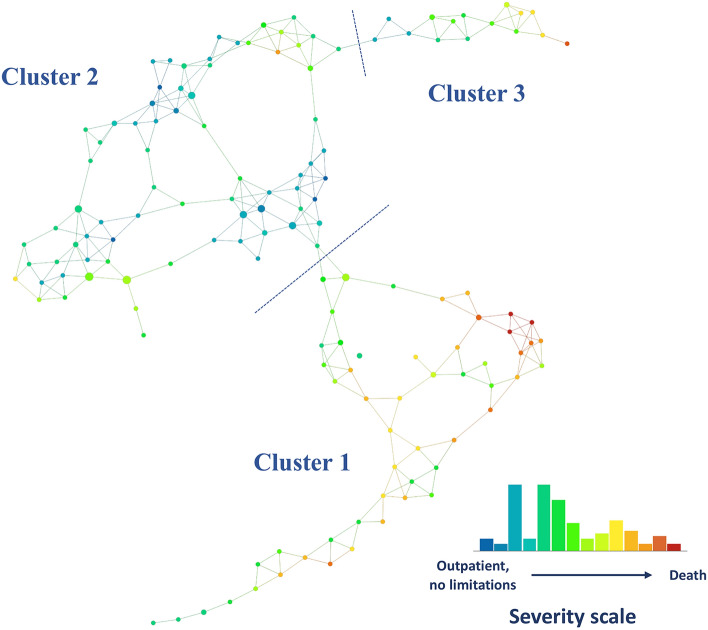
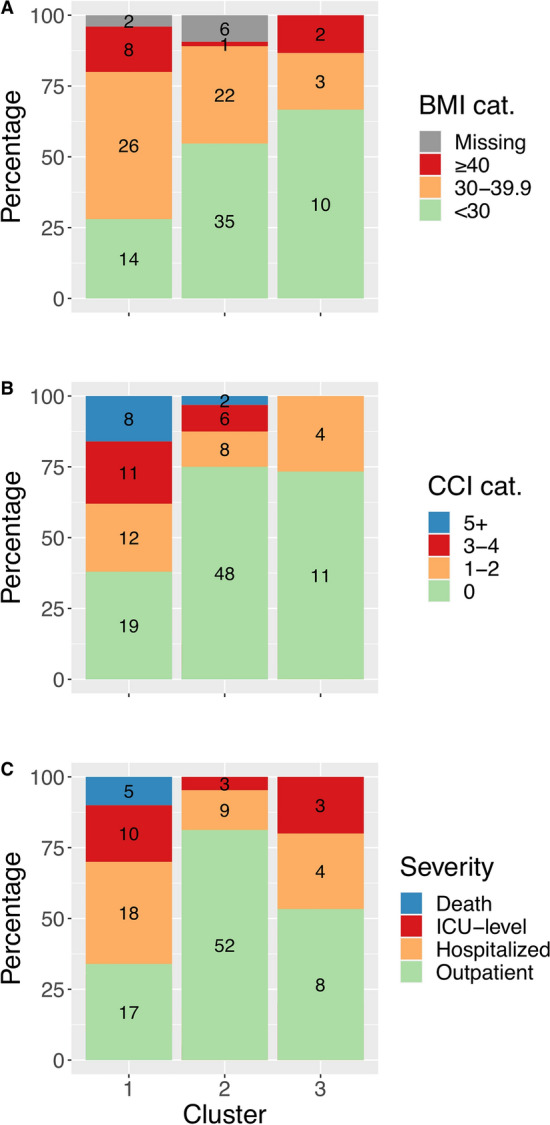
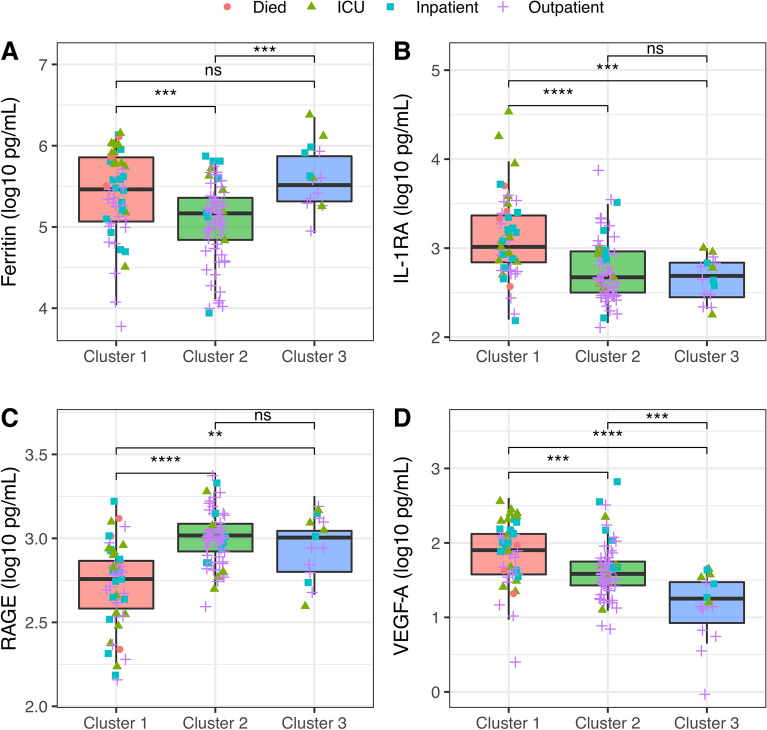
The associations between clinical phenotypes of coronavirus disease 2019 (COVID-19) and the host inflammatory response during the transition from peak illness to convalescence are not yet well understood. Blood plasma samples were collected from 129 adult SARS-CoV-2 positive inpatient and outpatient participants between April 2020 and January 2021, in a multi-center prospective cohort study at 8 military hospitals across the United States. Plasma inflammatory protein biomarkers were measured in samples from 15 to 28 days post symptom onset. Topological Data Analysis (TDA) was used to identify patterns of inflammation, and associations with peak severity (outpatient, hospitalized, ICU admission or death), Charlson Comorbidity Index (CCI), and body mass index (BMI) were evaluated using logistic regression. The study population (n = 129, 33.3% female, median 41.3 years of age) included 77 outpatient, 31 inpatient, 16 ICU-level, and 5 fatal cases. Three distinct inflammatory biomarker clusters were identified and were associated with significant differences in peak disease severity (p < 0.001), age (p < 0.001), BMI (p < 0.001), and CCI (p = 0.001). Host-biomarker profiles stratified a heterogeneous population of COVID-19 patients during the transition from peak illness to convalescence, and these distinct inflammatory patterns were associated with comorbid disease and severe illness due to COVID-19.
© 2022. The Author(s).
Conflict of interest statement
S. D. P., M.P.S., T. H. B, and D.R.T. report that the Uniformed Services University (USU) Infectious Diseases Clinical Research Program (IDCRP), a US Department of Defense institution, and the Henry M. Jackson Foundation for the Advancement of Military Medicine, Inc (HJF) were funded under a Cooperative Research and Development Agreement to conduct an unrelated phase III COVID-19 monoclonal antibody immunoprophylaxis trial sponsored by AstraZeneca. The HJF, in support of the USU IDCRP, was funded by the Department of Defense Joint Program Executive Office for Chemical, Biological, Radiological, and Nuclear Defense to augment the conduct of an unrelated phase III vaccine trial sponsored by AstraZeneca. Both of these trials were part of the US Government COVID-19 response. Neither is related to the work presented here. All other authors declare no competing interests.
Figures
References
Publication types
MeSH terms
Substances
LinkOut - more resources
Full Text Sources
Medical
Miscellaneous
