. 2022 Dec 28;10(1):243.
doi: 10.1186/s40168-022-01435-4.

Alterations of oral microbiota and impact on the gut microbiome in type 1 diabetes mellitus revealed by integrated multi-omic analyses

Affiliations

Alterations of oral microbiota and impact on the gut microbiome in type 1 diabetes mellitus revealed by integrated multi-omic analyses

B J Kunath et al. Microbiome. .

Abstract

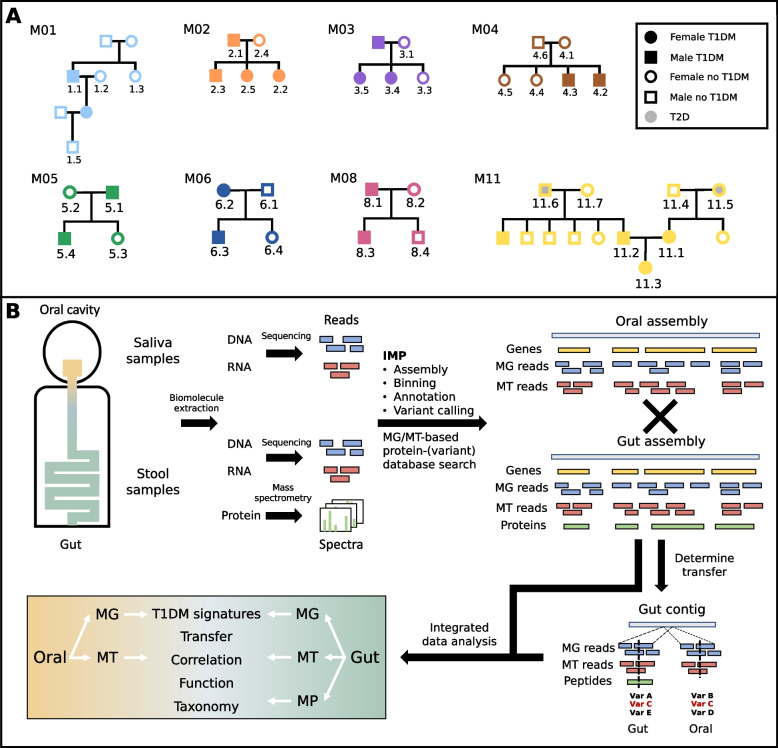
Background: Alterations to the gut microbiome have been linked to multiple chronic diseases. However, the drivers of such changes remain largely unknown. The oral cavity acts as a major route of exposure to exogenous factors including pathogens, and processes therein may affect the communities in the subsequent compartments of the gastrointestinal tract. Here, we perform strain-resolved, integrated meta-genomic, transcriptomic, and proteomic analyses of paired saliva and stool samples collected from 35 individuals from eight families with multiple cases of type 1 diabetes mellitus (T1DM).

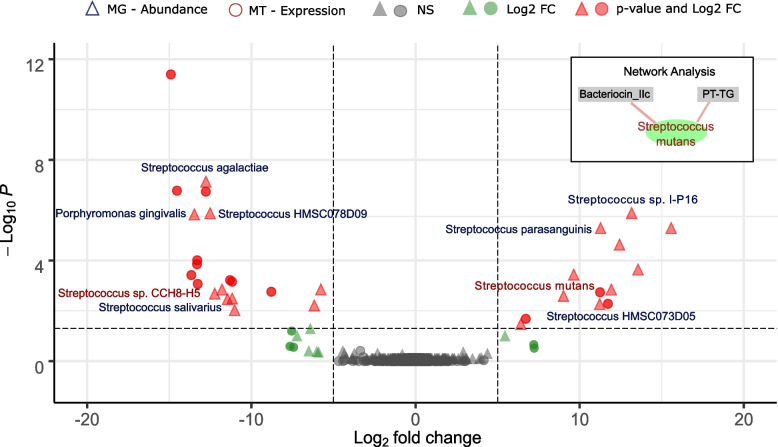
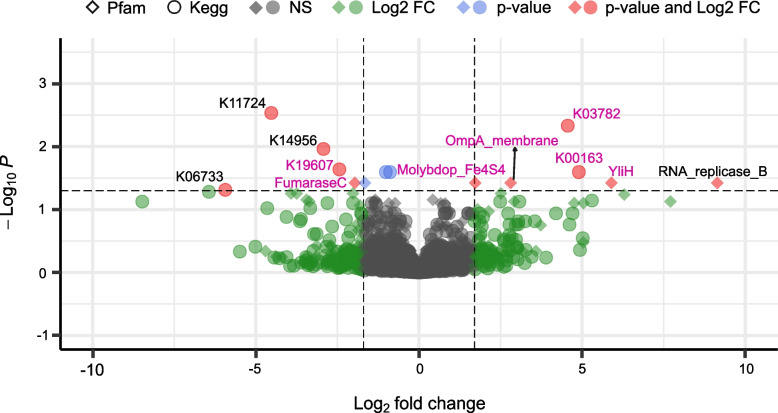
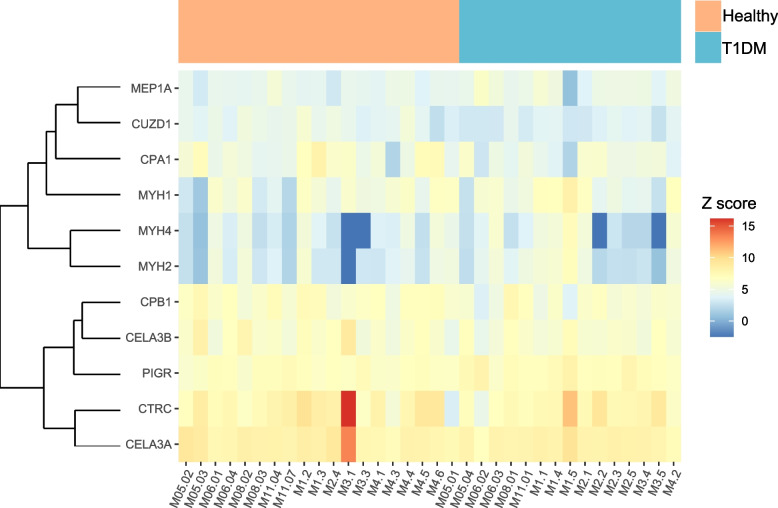
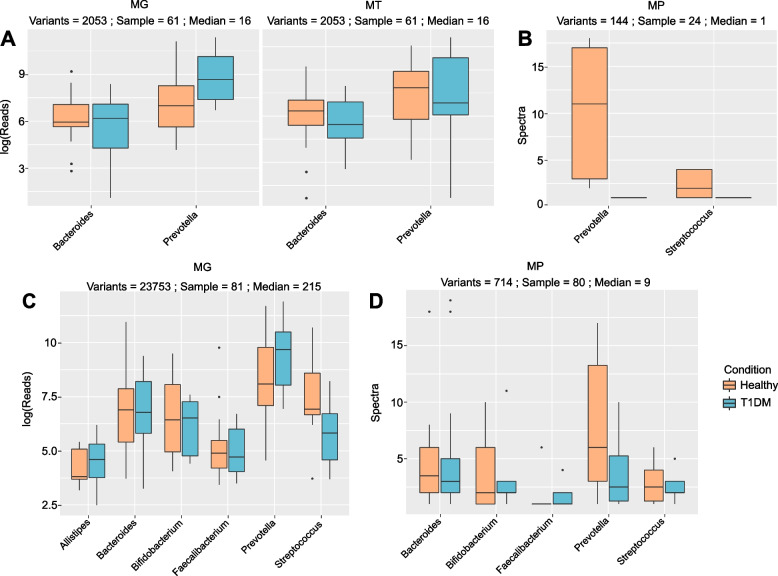
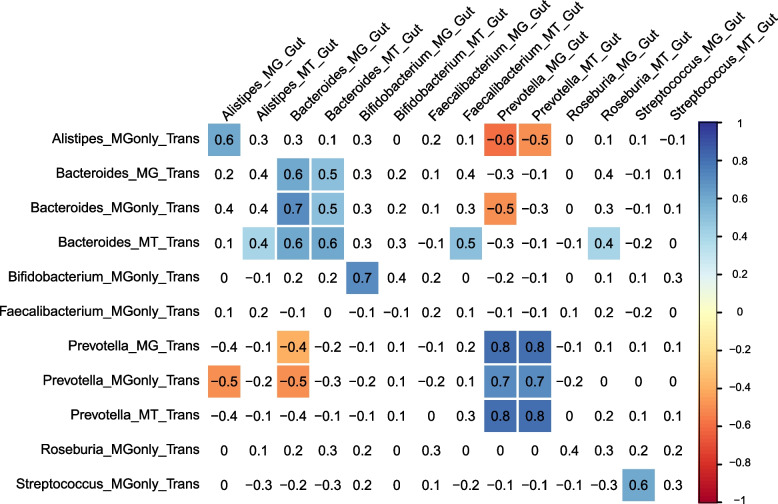
Results: We identified distinct oral microbiota mostly reflecting competition between streptococcal species. More specifically, we found a decreased abundance of the commensal Streptococcus salivarius in the oral cavity of T1DM individuals, which is linked to its apparent competition with the pathobiont Streptococcus mutans. The decrease in S. salivarius in the oral cavity was also associated with its decrease in the gut as well as higher abundances in facultative anaerobes including Enterobacteria. In addition, we found evidence of gut inflammation in T1DM as reflected in the expression profiles of the Enterobacteria as well as in the human gut proteome. Finally, we were able to follow transmitted strain-variants from the oral cavity to the gut at the individual omic levels, highlighting not only the transfer, but also the activity of the transmitted taxa along the gastrointestinal tract.

Conclusions: Alterations of the oral microbiome in the context of T1DM impact the microbial communities in the lower gut, in particular through the reduction of "mouth-to-gut" transfer of Streptococcus salivarius. Our results indicate that the observed oral-cavity-driven gut microbiome changes may contribute towards the inflammatory processes involved in T1DM. Through the integration of multi-omic analyses, we resolve strain-variant "mouth-to-gut" transfer in a disease context. Video Abstract.


Conflict of interest statement

All authors declare that they have no competing interests.

Figures

Fig. 1
Fig. 1
Description of the cohort and overview of the study workflow. The upper panel (A) shows the different individuals with family membership as well as disease status in the cohort. The lower panel (B) describes the integrated multi-omics analysis workflow to process, integrate and analyse metagenomic (MG), metatranscriptomic (MT), and metaproteomic (MP) data from saliva and stool samples
Fig. 2
Fig. 2
Taxon-resolved differential abundance and gene expression in the oral microbiome in T1DM. The differences in abundance (triangles) and expression (circle) in T1DM versus healthy individuals using metagenomic and metatranscriptomic data, respectively, are shown on the volcano plot. A minimum log2 fold change of 5 (dashed vertical lines) and an adjusted p value of 0.01 (dashed horizontal line) were required (red dots). Taxa that satisfy the fold-change threshold but not the adjusted p value threshold are displayed in green. A subset of Supplementary Fig. 2 is shown in the insert in the upper-right and highlights the correlation between S. mutans activity and the expression of a target-specific bacteriocin
Fig. 3
Fig. 3
Differential gene expression analysis within the gut in T1DM. Difference in expression using metatranscriptomic data is shown on the volcano plot. A minimum log2 fold change of 2 (dashed vertical lines) and adjusted p value of 0.05 (dashed horizontal line) were required (red dot). Functions that satisfy only the fold change or the adjusted p value threshold are displayed in green and blue, respectively. Diamonds and circles respectively indicate complementary annotations from both the Pfam and KEGG databases. Genes associated with Enterobacteria are marked in pink
Fig. 4
Fig. 4
Human proteome differences in T1DM. Heatmap displaying the relative abundances of human proteins with the highest significance in a differential analysis of T1DM versus healthy individuals (unadjusted p value < 0.05). The samples are ordered by conditions. Healthy individuals and T1DM patients are respectively shown in orange and blue boxes
Fig. 5
Fig. 5
Identified variants of genera across multiple omes. The figure indicates the distribution of reads for metagenomic (MG) and metatranscriptomic (MT) abundance, and spectra for metaproteomic (MP) abundance for each set of variants associated with a taxa. The numbers on top of each box indicate the number of identified variants, the number of samples in which variants have been identified and the median number of variants per sample. A and B correspond to the MG-MT supported variants while C and D show the MG-only supported variants. Comparisons of distributions were also performed and are represented by a light orange (healthy controls) and a light blue box (T1DM patients)
Fig. 6
Fig. 6
Correlations between the abundances of transferred taxa in comparison to the abundance in the gut. The figure shows the correlation between the transfer and the gut abundances. Abundances of taxa with either MG or MT labels correspond to the abundances of supported variants at the metagenomic and metatranscriptomic levels. MGonly is used if variants were supported with MG reads only and not on the MT level. Colored values indicate positive (blue) or negative (red) significant correlations (adj. p value < 0.05). Values with white background indicate non-significant correlations

Similar articles

Cited by

References

    1. Gilbert JA, et al. Current understanding of the human microbiome. Nat Med. 2018;24:392–400. doi: 10.1038/nm.4517. - DOI - PMC - PubMed
    1. Karczewski J, Poniedziałek B, Adamski Z, Rzymski P. The effects of the microbiota on the host immune system. Autoimmunity. 2014;47:494–504. doi: 10.3109/08916934.2014.938322. - DOI - PubMed
    1. Zheng D, Liwinski T, Elinav E. Interaction between microbiota and immunity in health and disease. Cell Res. 2020;30:492–506. doi: 10.1038/s41422-020-0332-7. - DOI - PMC - PubMed
    1. Duvallet C, Gibbons SM, Gurry T, Irizarry RA, Alm EJ. Meta-analysis of gut microbiome studies identifies disease-specific and shared responses. Nat Commun. 2017;8:1784. doi: 10.1038/s41467-017-01973-8. - DOI - PMC - PubMed
    1. Gilbert JA, et al. Microbiome-wide association studies link dynamic microbial consortia to disease. Nature. 2016;535:94–103. doi: 10.1038/nature18850. - DOI - PubMed

Publication types

LinkOut - more resources