. 2022 Nov 19;6(6):426-437.
doi: 10.1002/evl3.305. eCollection 2022 Dec.

Impact of Salmonella genome rearrangement on gene expression

Affiliations

Impact of Salmonella genome rearrangement on gene expression

Emma V Waters et al. Evol Lett. .

Abstract

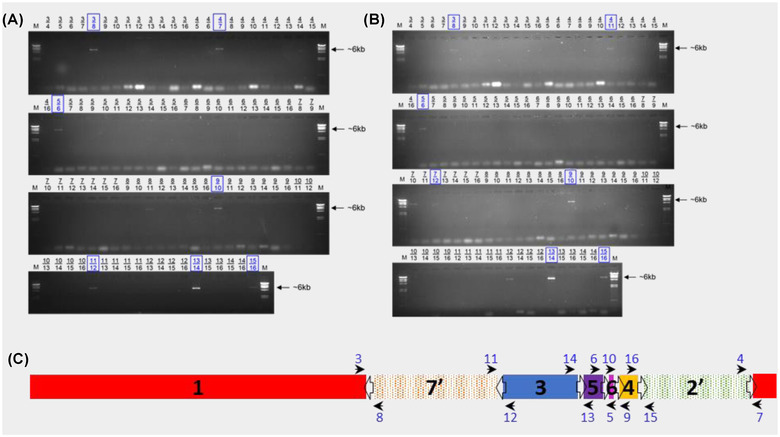
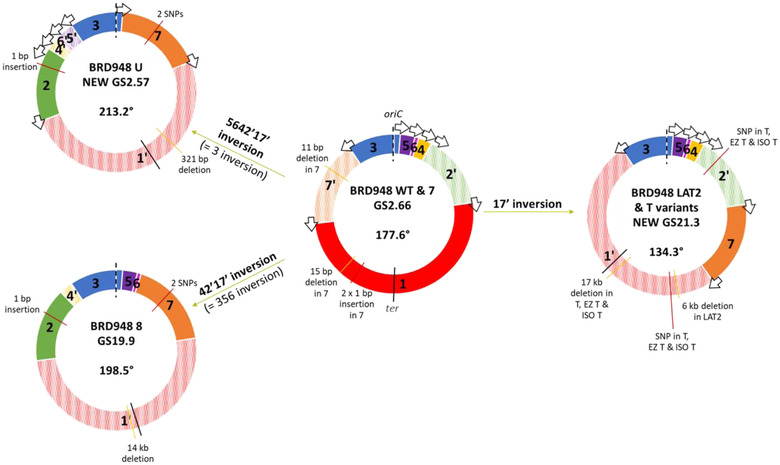
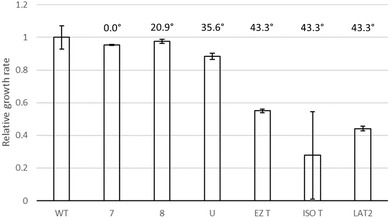
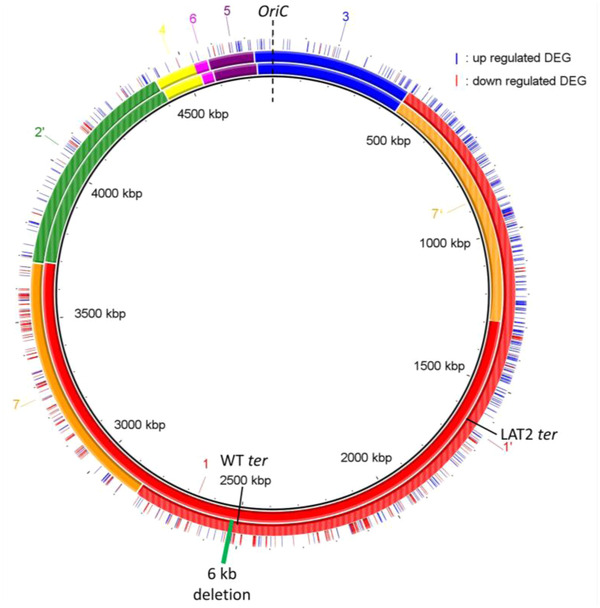
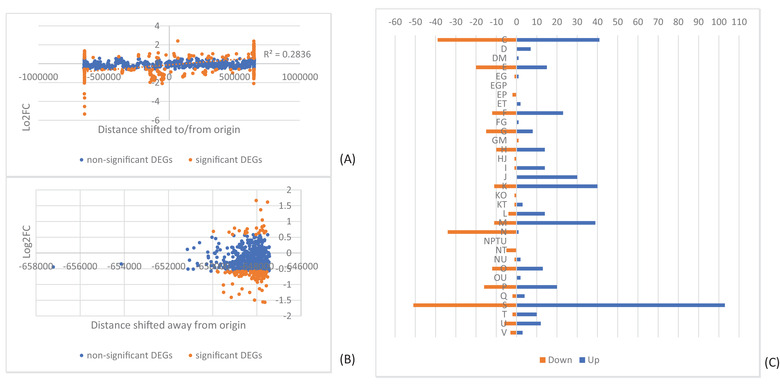
In addition to nucleotide variation, many bacteria also undergo changes at a much larger scale via rearrangement of their genome structure (GS) around long repeat sequences. These rearrangements result in genome fragments shifting position and/or orientation in the genome without necessarily affecting the underlying nucleotide sequence. To date, scalable techniques have not been applied to GS identification, so it remains unclear how extensive this variation is and the extent of its impact upon gene expression. However, the emergence of multiplexed, long-read sequencing overcomes the scale problem, as reads of several thousand bases are routinely produced that can span long repeat sequences to identify the flanking chromosomal DNA, allowing GS identification. Genome rearrangements were generated in Salmonella enterica serovar Typhi through long-term culture at ambient temperature. Colonies with rearrangements were identified via long-range PCR and subjected to long-read nanopore sequencing to confirm genome variation. Four rearrangements were investigated for differential gene expression using transcriptomics. All isolates with changes in genome arrangement relative to the parent strain were accompanied by changes in gene expression. Rearrangements with similar fragment movements demonstrated similar changes in gene expression. The most extreme rearrangement caused a large imbalance between the origin and terminus of replication and was associated with differential gene expression as a factor of distance moved toward or away from the origin of replication. Genome structure variation may provide a mechanism through which bacteria can quickly adapt to new environments and warrants routine assessment alongside traditional nucleotide-level measures of variation.

Keywords: Genome structure; RNAseq; long‐read sequencing.


Conflict of interest statement

GCL has previously consulted for RevoluGen Ltd on bioinformatic analyses. Fire Monkey DNA extraction kits were provided free of charge by RevoluGen in this project.

Figures

Figure 1
Figure 1
Long‐range PCR for genome structure determination. Gel images of long‐range PCR products of WT derivatives 7 (A) and T (B). Primer combinations are given above every well. Combinations indicated in blue boxes lead to the conclusion of the respective GS for that isolate. (C) Illustration of the primer binding sites within the Salmonella genome (Ty2 [WT] GS2.66, 17ʹ35642ʹ). Open arrows indicate the rrn operons and their orientation; black arrows indicate the direction and location of the primers numbered in blue; black numbers denote genome fragments.
Figure 2
Figure 2
Genome rearrangements of variants relative to WT. Schematic showing variant genome structures (GSs) and the rearrangement of WT fragments required to achieve these. GS fragments are labeled in respect to the Salmonella enterica database reference LT2 (genome accession GCF_000006945.2) and drawn with oriC at the 12 o'clock position and working in a clockwise fashion around the chromosome. The fragment containing origin of replication (here fragment 3) has its orientation fixed to match the orientation of the database reference and therefore any inversion involving fragment 3 is depicted as the rest of the chromosome inverted. The depicted inversion is given in bold but for clarity the equivalent inversion is given in parentheses. Individual inverted fragment orientations are denoted prime (ʹ) with striped colors. Oriter balance is given in degrees for each GS, going clockwise from ter to oriC as drawn. Arrows: ribosomal operons; oriC and dashed lines: origin of replication; and ter and black whole lines: terminus of replication. Data from genome sequencing are used to identify insertions (red lines) and deletions (yellow lines) in each variant in comparison to WT; bp, base pairs.
Figure 3
Figure 3
Growth rates of the six derivatives labeled with their oriter imbalance. Calculated for at least three independent biological replicates per isolate, relative to the WT parent strain. Imbalance calculated as the difference in oriter balance caused by each rearrangement, relative to the WT parent strain GS (Figure 1). Error bars indicate standard deviation.
Figure 4
Figure 4
Gene expression in LAT2. BRIG representation of the WT genome (inner circle, GS 2.66 [17ʹ35642ʹ]) and the LAT2 genome (middle circle, GS21.3 [1ʹ35642ʹ7]). Genome fragments are numbered and shown as colored blocks; inverted fragments are colored with stripes (e.g., green fragment 2) as per (Page et al. 2020). Same origin (oriC, dashed black line) and different termini (ter, solid black lines) of replication are shown for each genome. Outer circle shows location of up‐ (blue line) and down‐ (red line) regulated differentially expressed genes (DEG). Deletion event denoted in LAT2 by solid green rectangle
Figure 5
Figure 5
Impact of genome rearrangement on gene expression in LAT2. Graphical distribution of log2FC against distance a gene has moved toward or away from the origin of replication for LAT2 genes on (A) fragment 1 and (B) fragment 7. Genes colored by nonsignificance (blue) and significance (orange). Linear correlation in panel (A) shown as orange dotted line. (C) Distribution of significant differentially expressed genes (DEGs) from LAT2 across COG categories. Downregulated DEGs shown in orange, upregulated in blue. COG categories: C, Energy production and conversion; D, Cell cycle control, cell division, chromosome partitioning; E, Amino acid transport and metabolism; F, Nucleotide transport and metabolism; G, Carbohydrate transport and metabolism; H, Coenzyme transport and metabolism; I, Lipid transport and metabolism; J, Translation, ribosomal structure, and biogenesis; K, Transcription; L, Replication, recombination and repair; M, Cell wall/membrane/envelope biogenesis; N, Cell motility; O, Posttranslational modification, protein turnover, chaperones; P, Inorganic ion transport and metabolism; Q, Secondary metabolites biosynthesis, transport and catabolism; S, Function unknown; T, Signal transduction mechanisms; U, Intracellular trafficking, secretion, and vesicular transport; V, Defense mechanisms

References

    1. Achaz, G. , Rocha, E.P.C. , Netter, P. & Coissac, E. (2002) Origin and fate of repeats in bacteria. Nucleic Acids Res., 30, 2987–2994. - PMC - PubMed
    1. Arredondo‐Alonso, S. , Pöntinen, A.K. , Cléon, F. , Gladstone, R.A. , Schürch, A.C. , Johnsen, P.J. , et al. (2021) A high‐throughput multiplexing and selection strategy to complete bacterial genomes. Gigascience, 10, 1–13. - PMC - PubMed
    1. Blom, J. , Kreis, J. , Spänig, S. , Juhre, T. , Bertelli, C. , Ernst, C. , et al. (2016) EDGAR 2.0: an enhanced software platform for comparative gene content analyses. Nucleic Acids Res., 44, W22–W28. - PMC - PubMed
    1. Brüssow, H. , Canchaya, C. & Hardt, W.‐D. (2004) Phages and the evolution of bacterial pathogens: from genomic rearrangements to lysogenic conversion. Microbiol. Mol. Biol. Rev., 68, 560–602. - PMC - PubMed
    1. Casino, P. , Miguel‐Romero, L. , Huesa, J. , García, P. , García‐del Portillo, F. & Marina, A. (2018) Conformational dynamism for DNA interaction in the Salmonella RcsB response regulator. Nucleic Acids Res., 46, 456–472. - PMC - PubMed