. 2023 Feb;43(2):234-252.
doi: 10.1161/ATVBAHA.122.318135. Epub 2022 Dec 29.

Aortic Stress Activates an Adaptive Program in Thoracic Aortic Smooth Muscle Cells That Maintains Aortic Strength and Protects Against Aneurysm and Dissection in Mice

Affiliations

Aortic Stress Activates an Adaptive Program in Thoracic Aortic Smooth Muscle Cells That Maintains Aortic Strength and Protects Against Aneurysm and Dissection in Mice

Chen Zhang et al. Arterioscler Thromb Vasc Biol. 2023 Feb.

Abstract

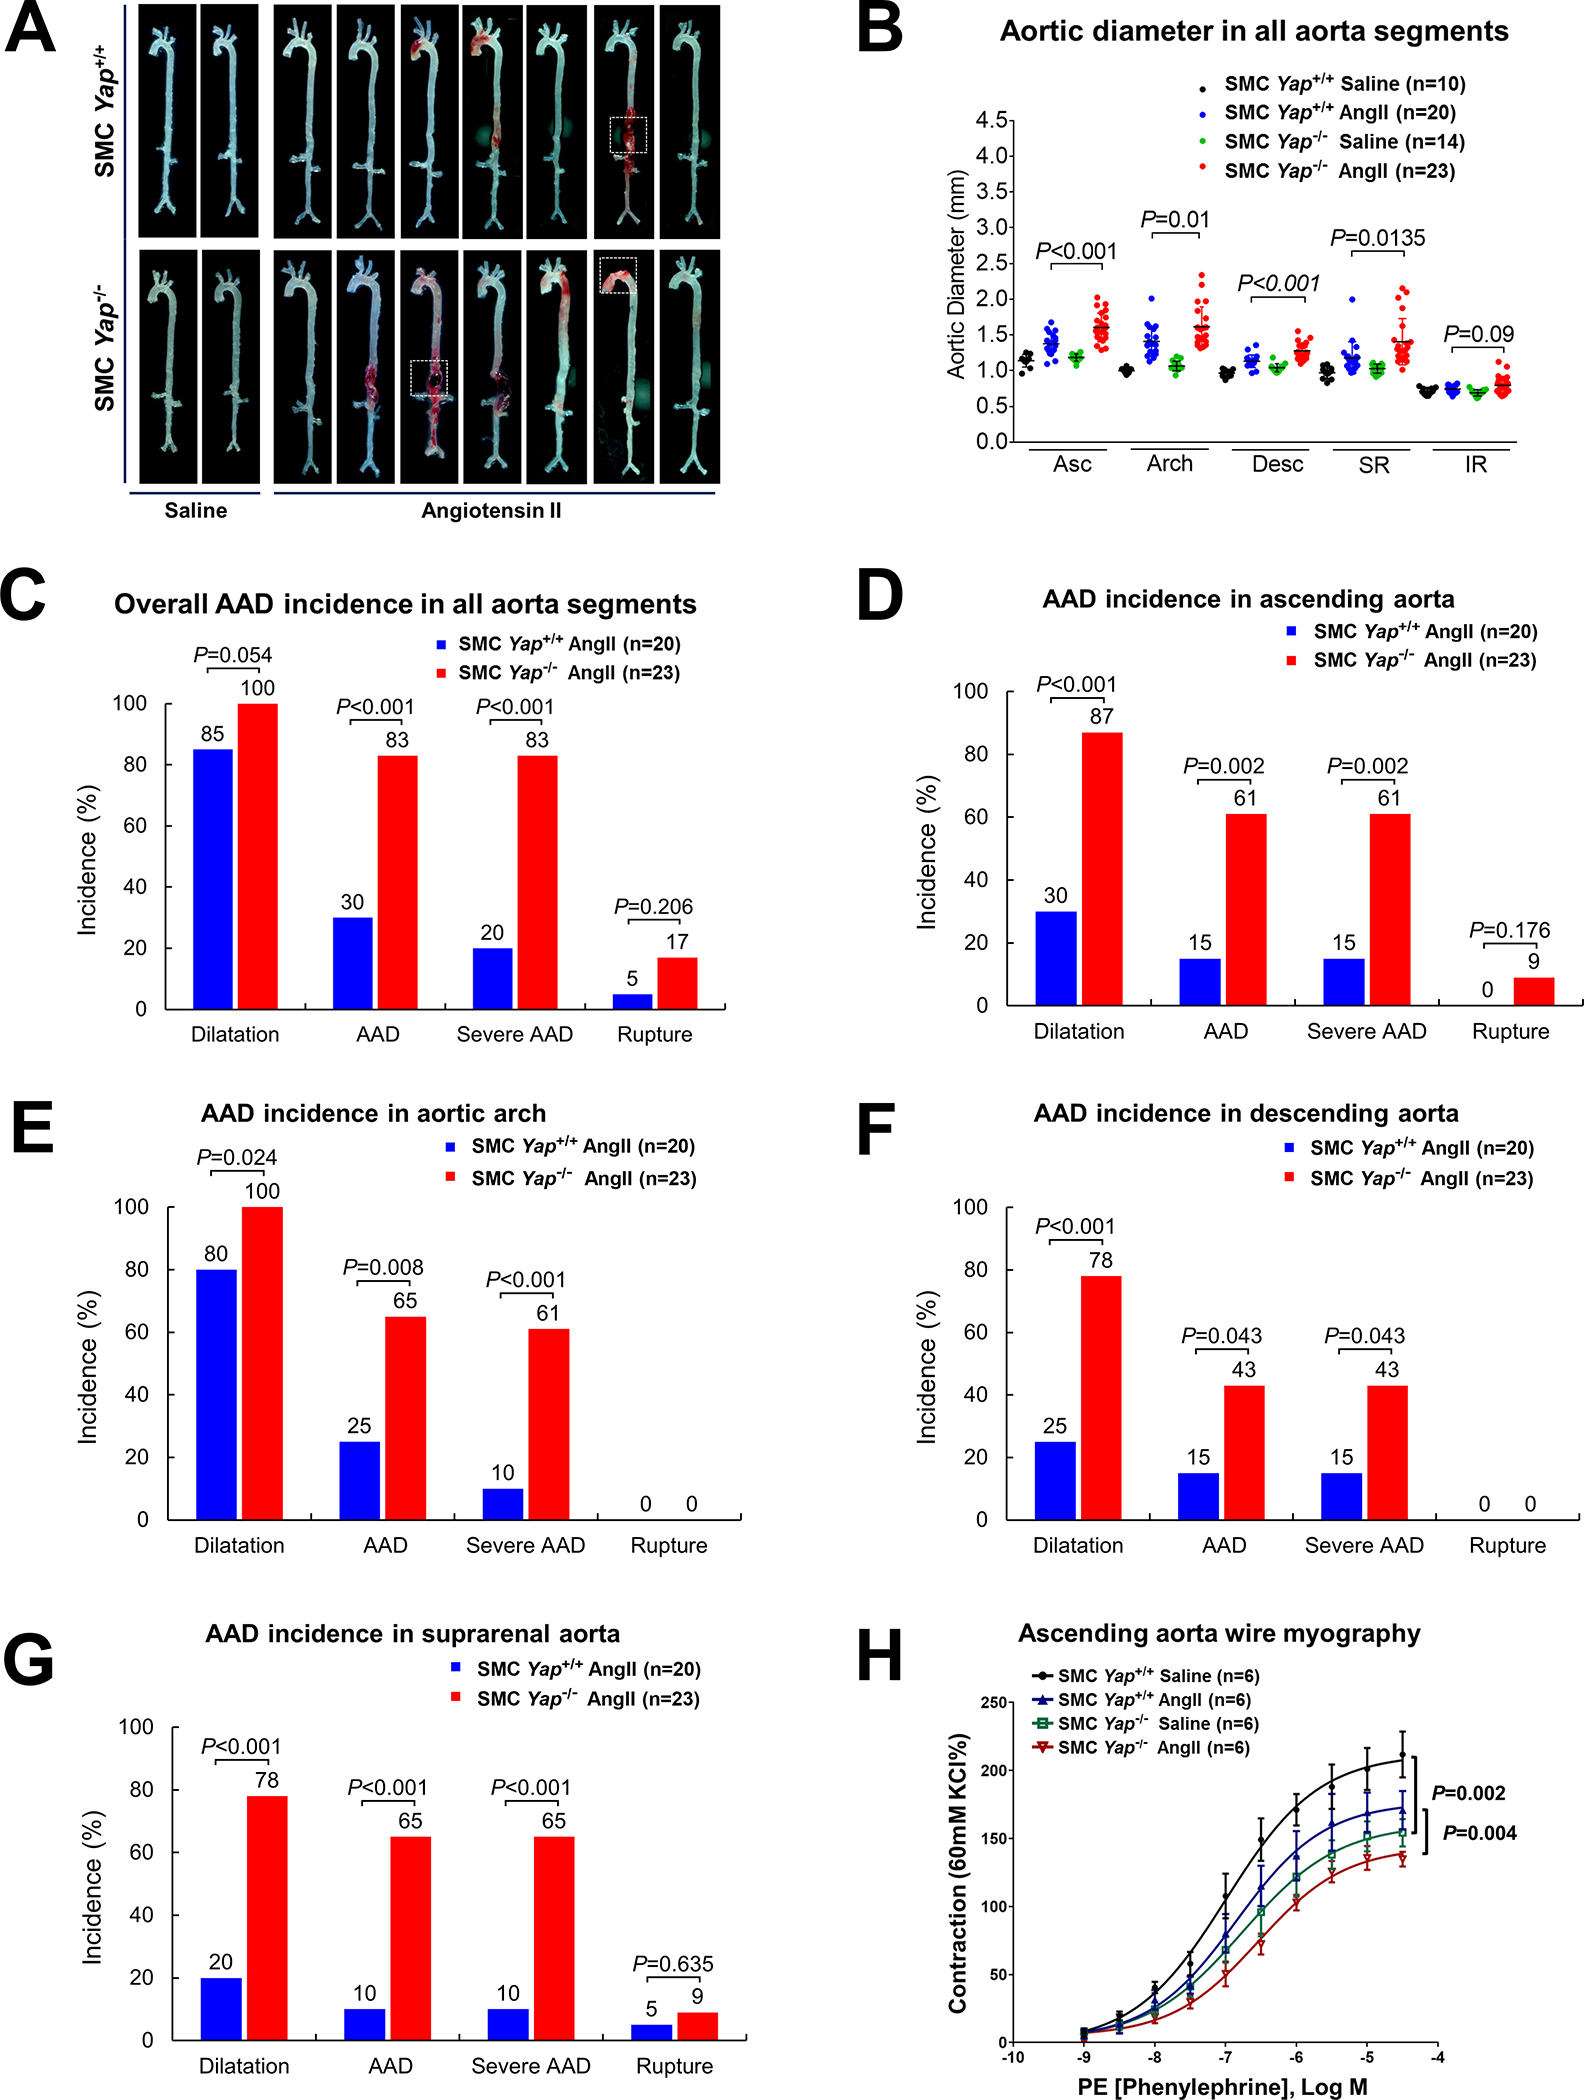
Background: When aortic cells are under stress, such as increased hemodynamic pressure, they adapt to the environment by modifying their functions, allowing the aorta to maintain its strength. To understand the regulation of this adaptive response, we examined transcriptomic and epigenomic programs in aortic smooth muscle cells (SMCs) during the adaptive response to AngII (angiotensin II) infusion and determined its importance in protecting against aortic aneurysm and dissection (AAD).

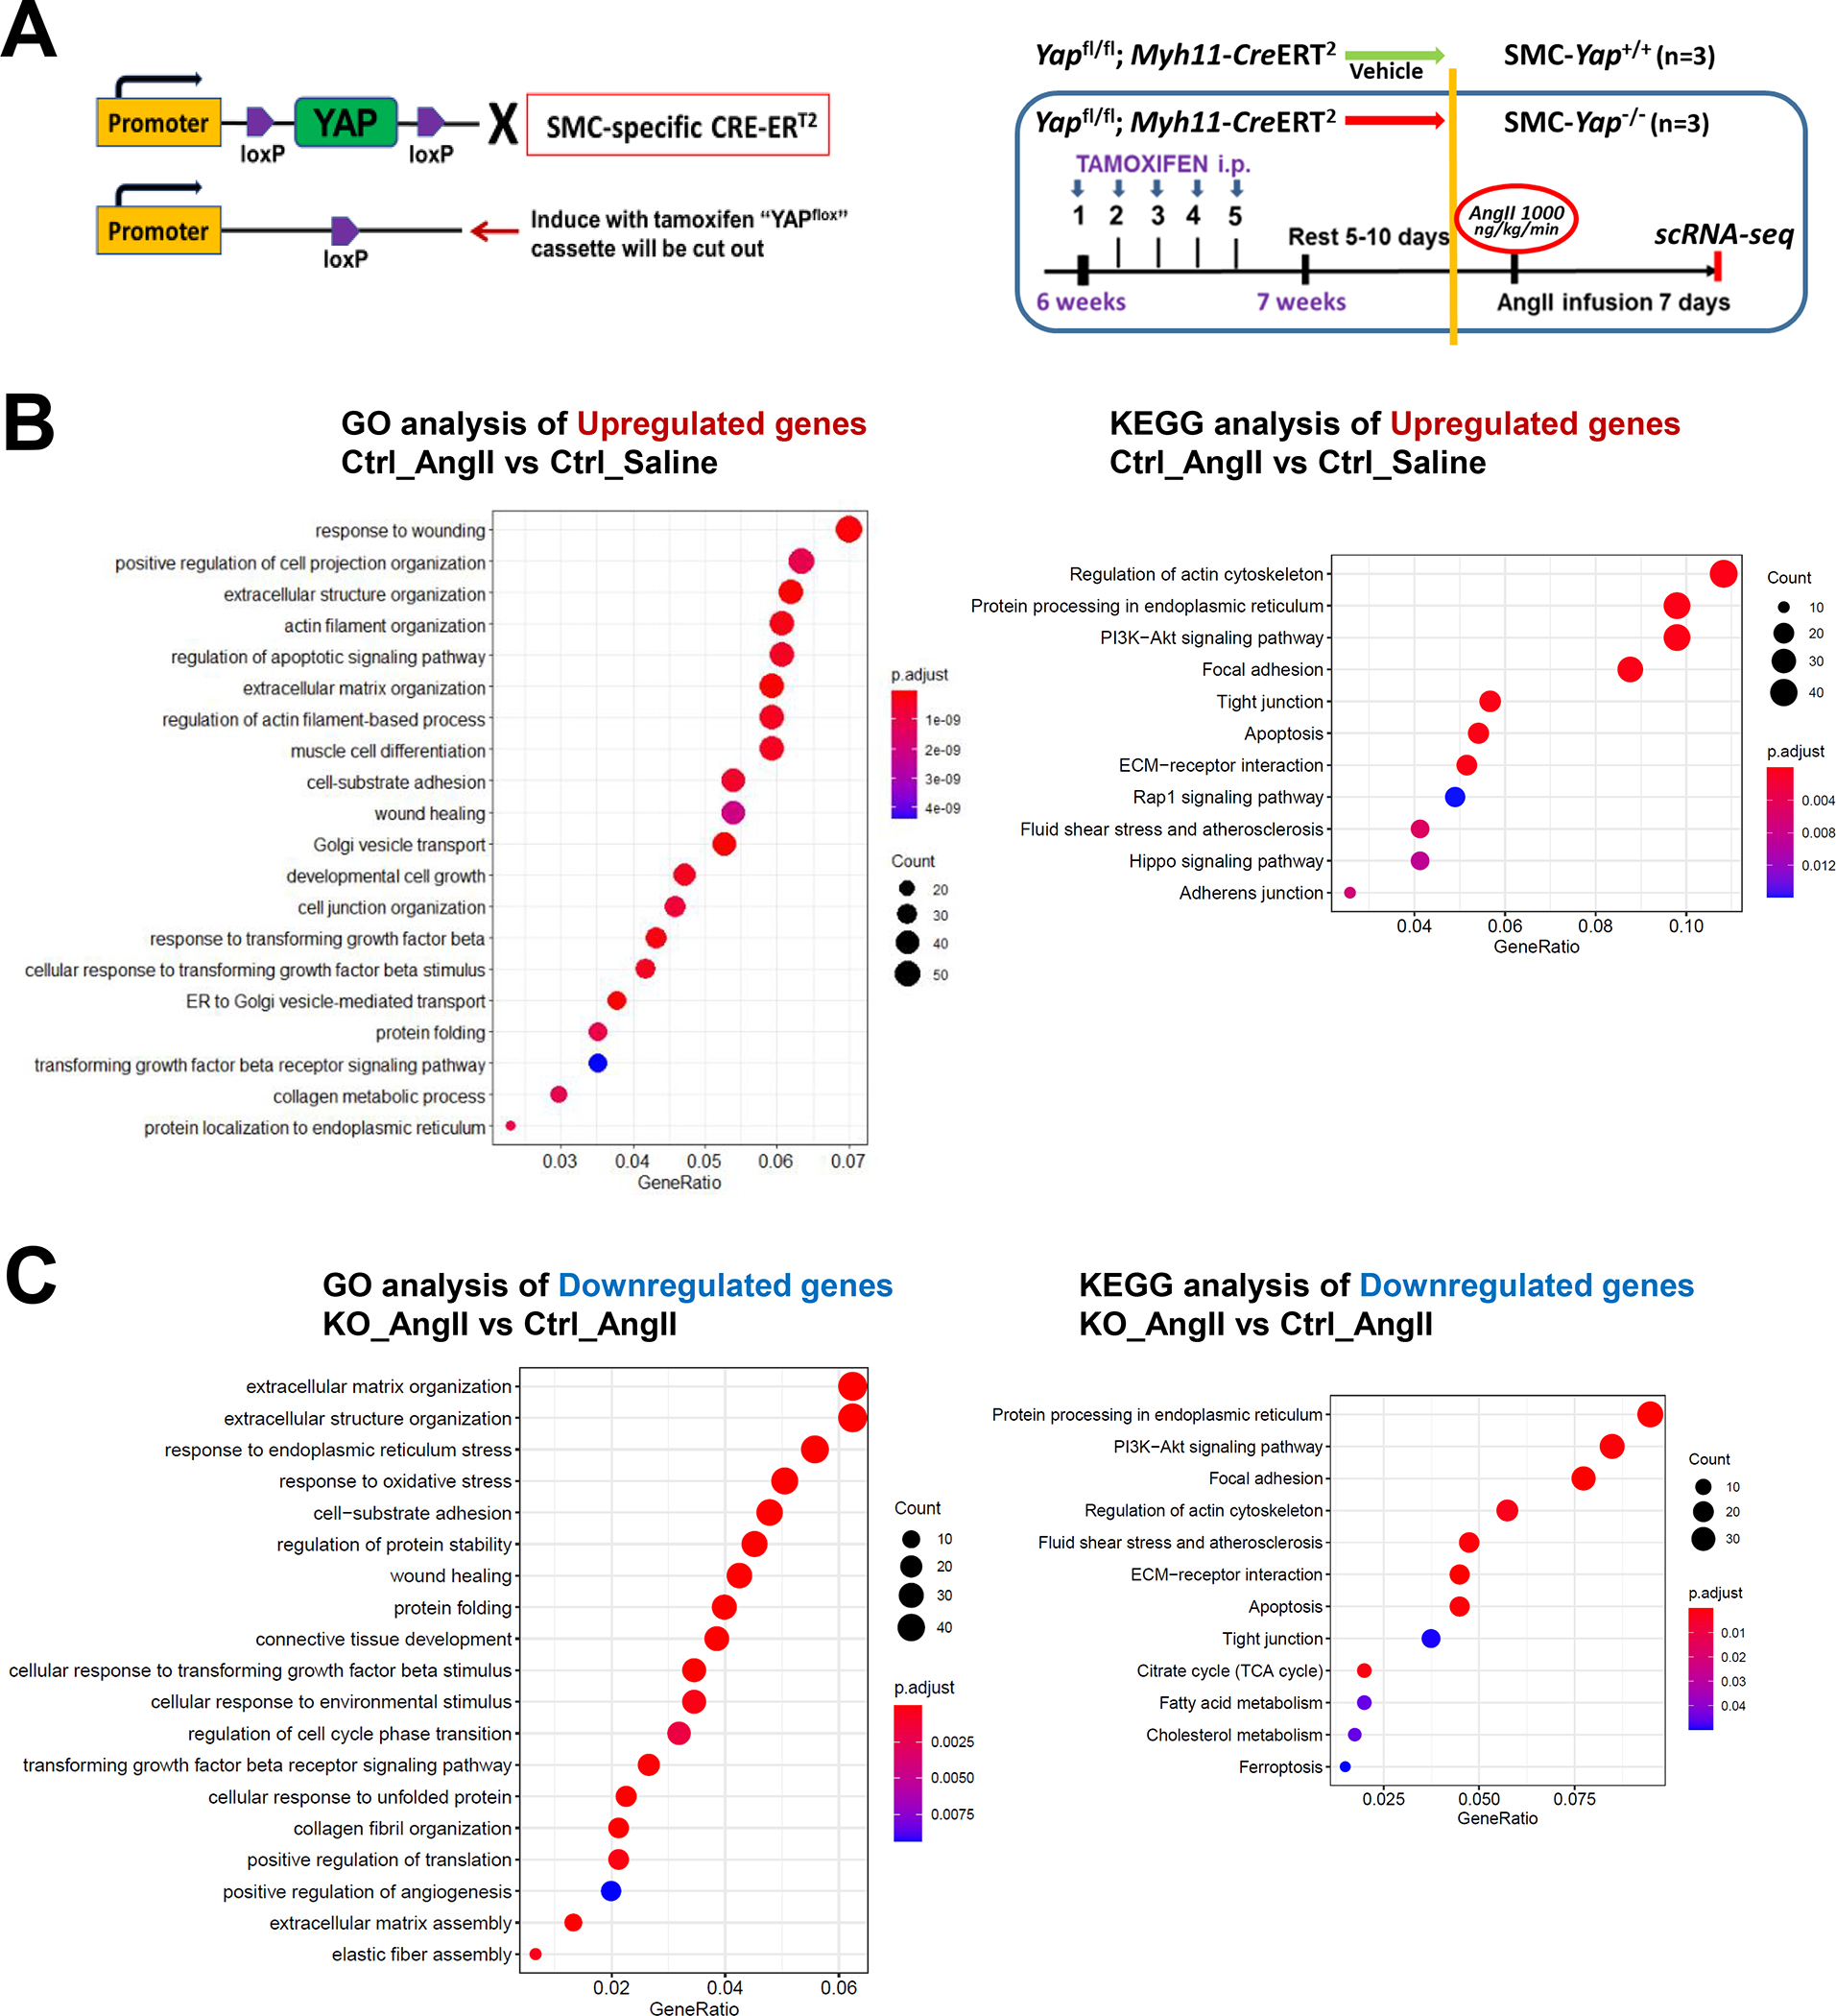
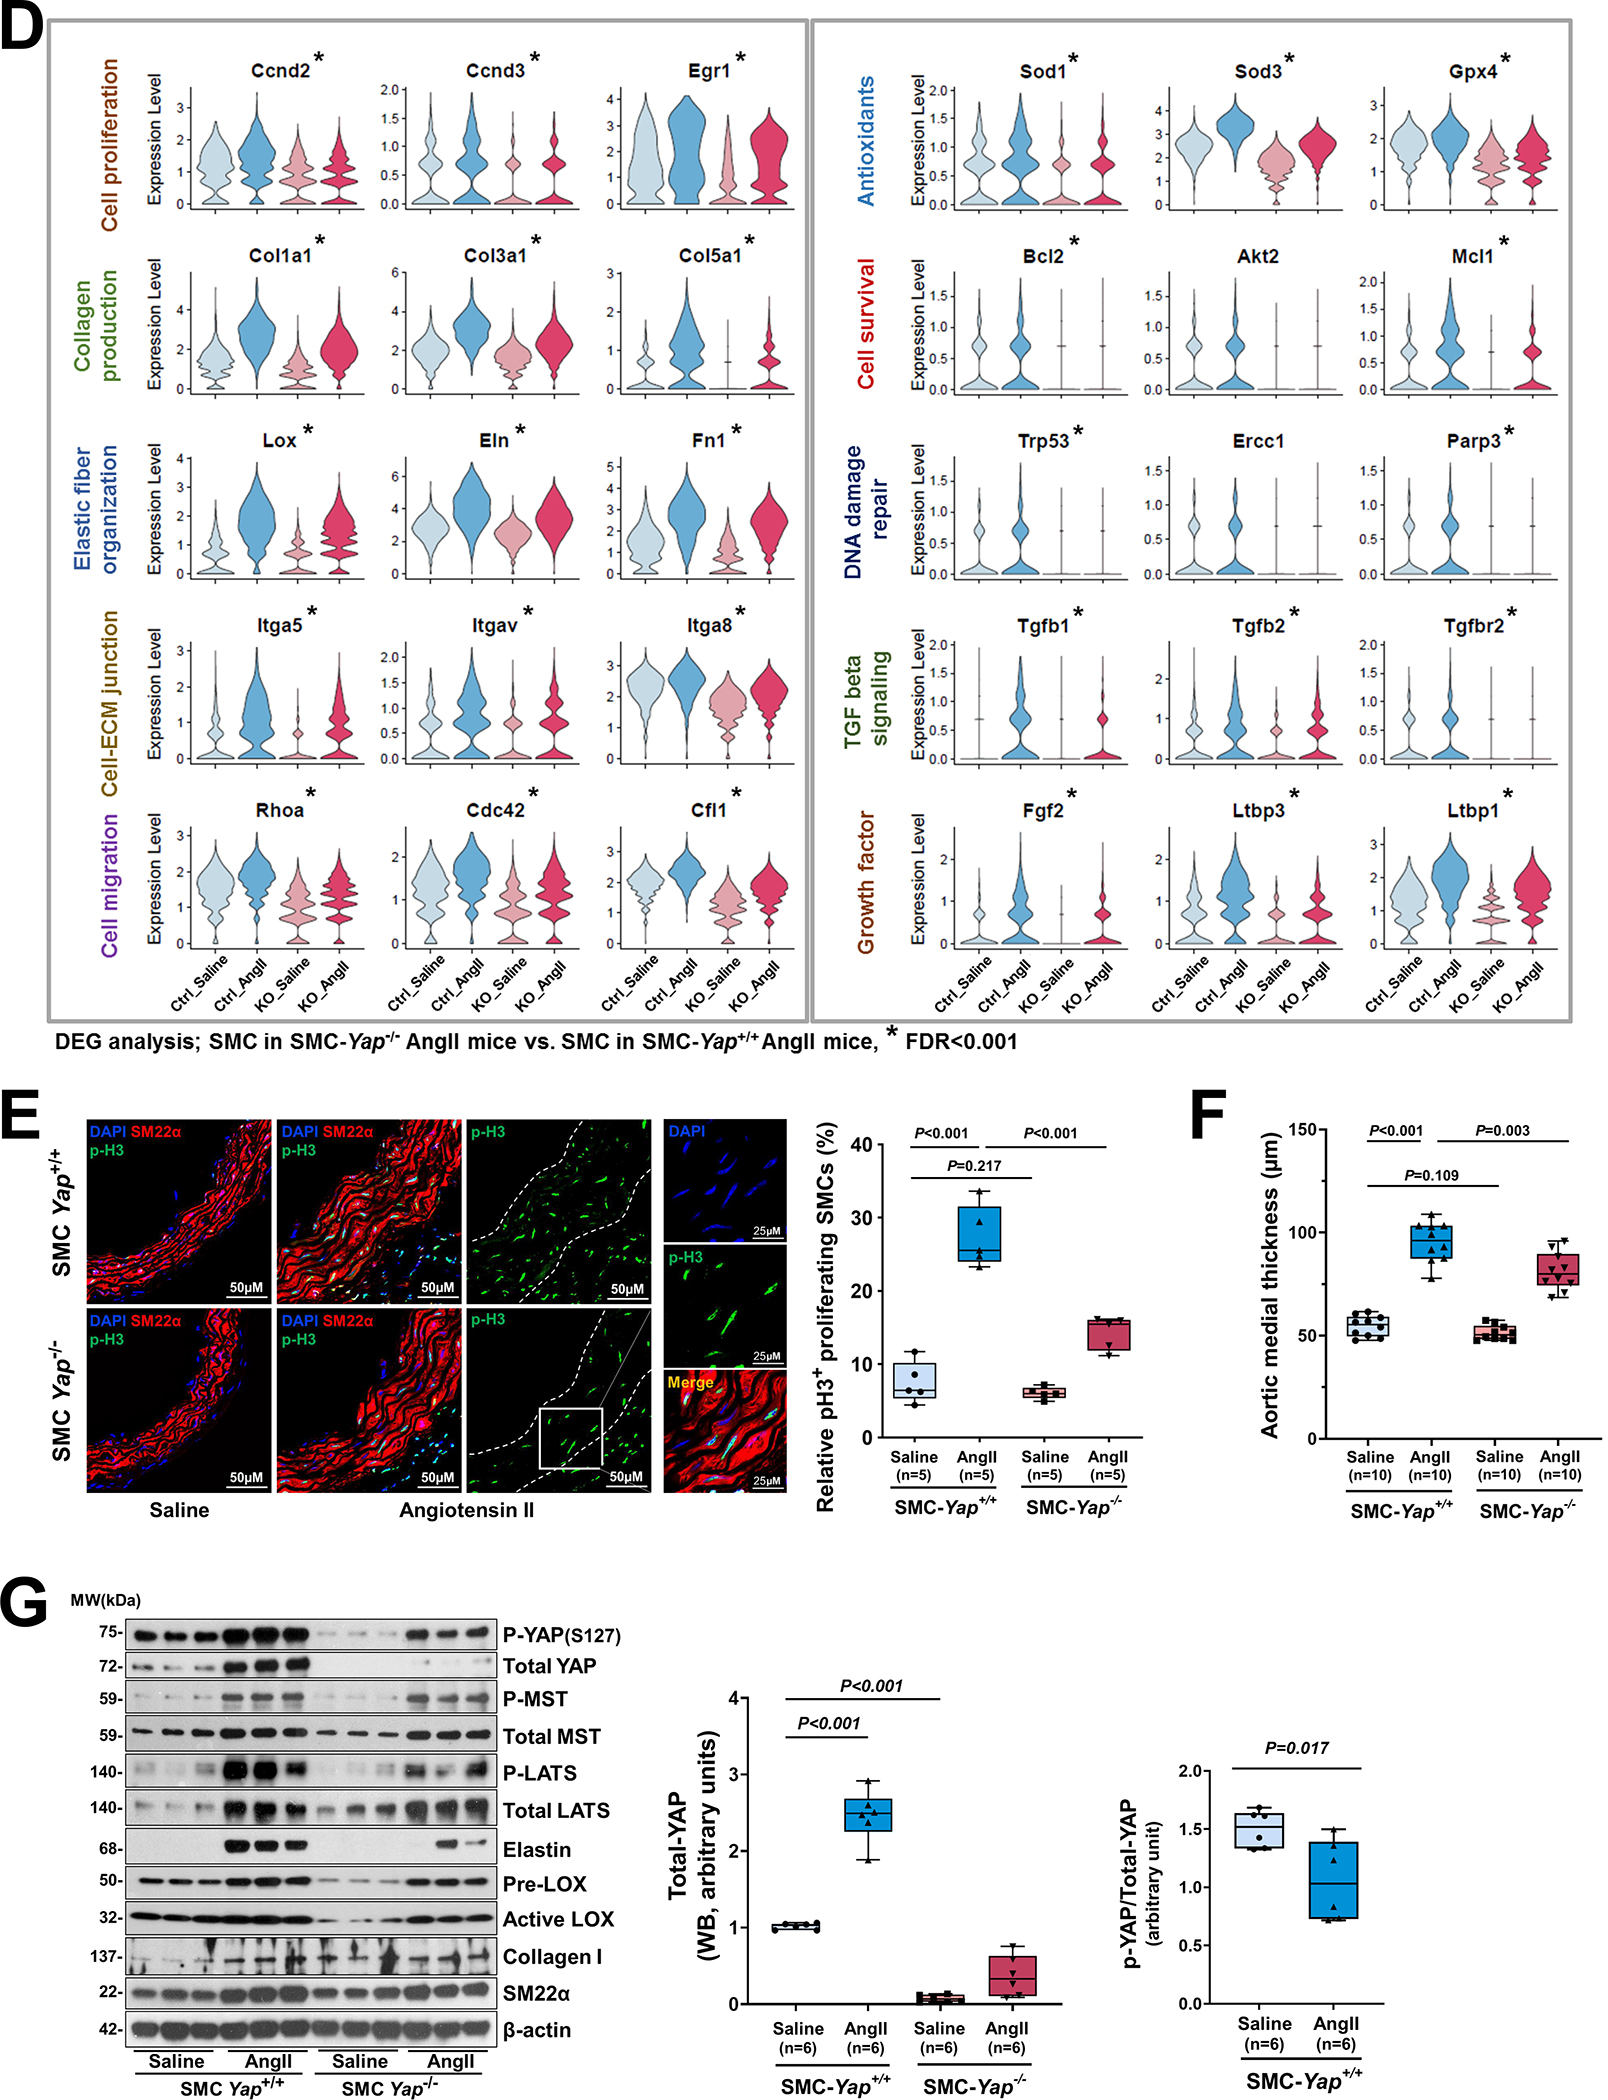
Methods: We performed single-cell RNA sequencing and single-cell sequencing assay for transposase-accessible chromatin (scATAC-seq) analyses in a mouse model of sporadic AAD induced by AngII infusion. We also examined the direct effects of YAP (yes-associated protein) on the SMC adaptive response in vitro. The role of YAP in AAD development was further evaluated in AngII-infused mice with SMC-specific Yap deletion.

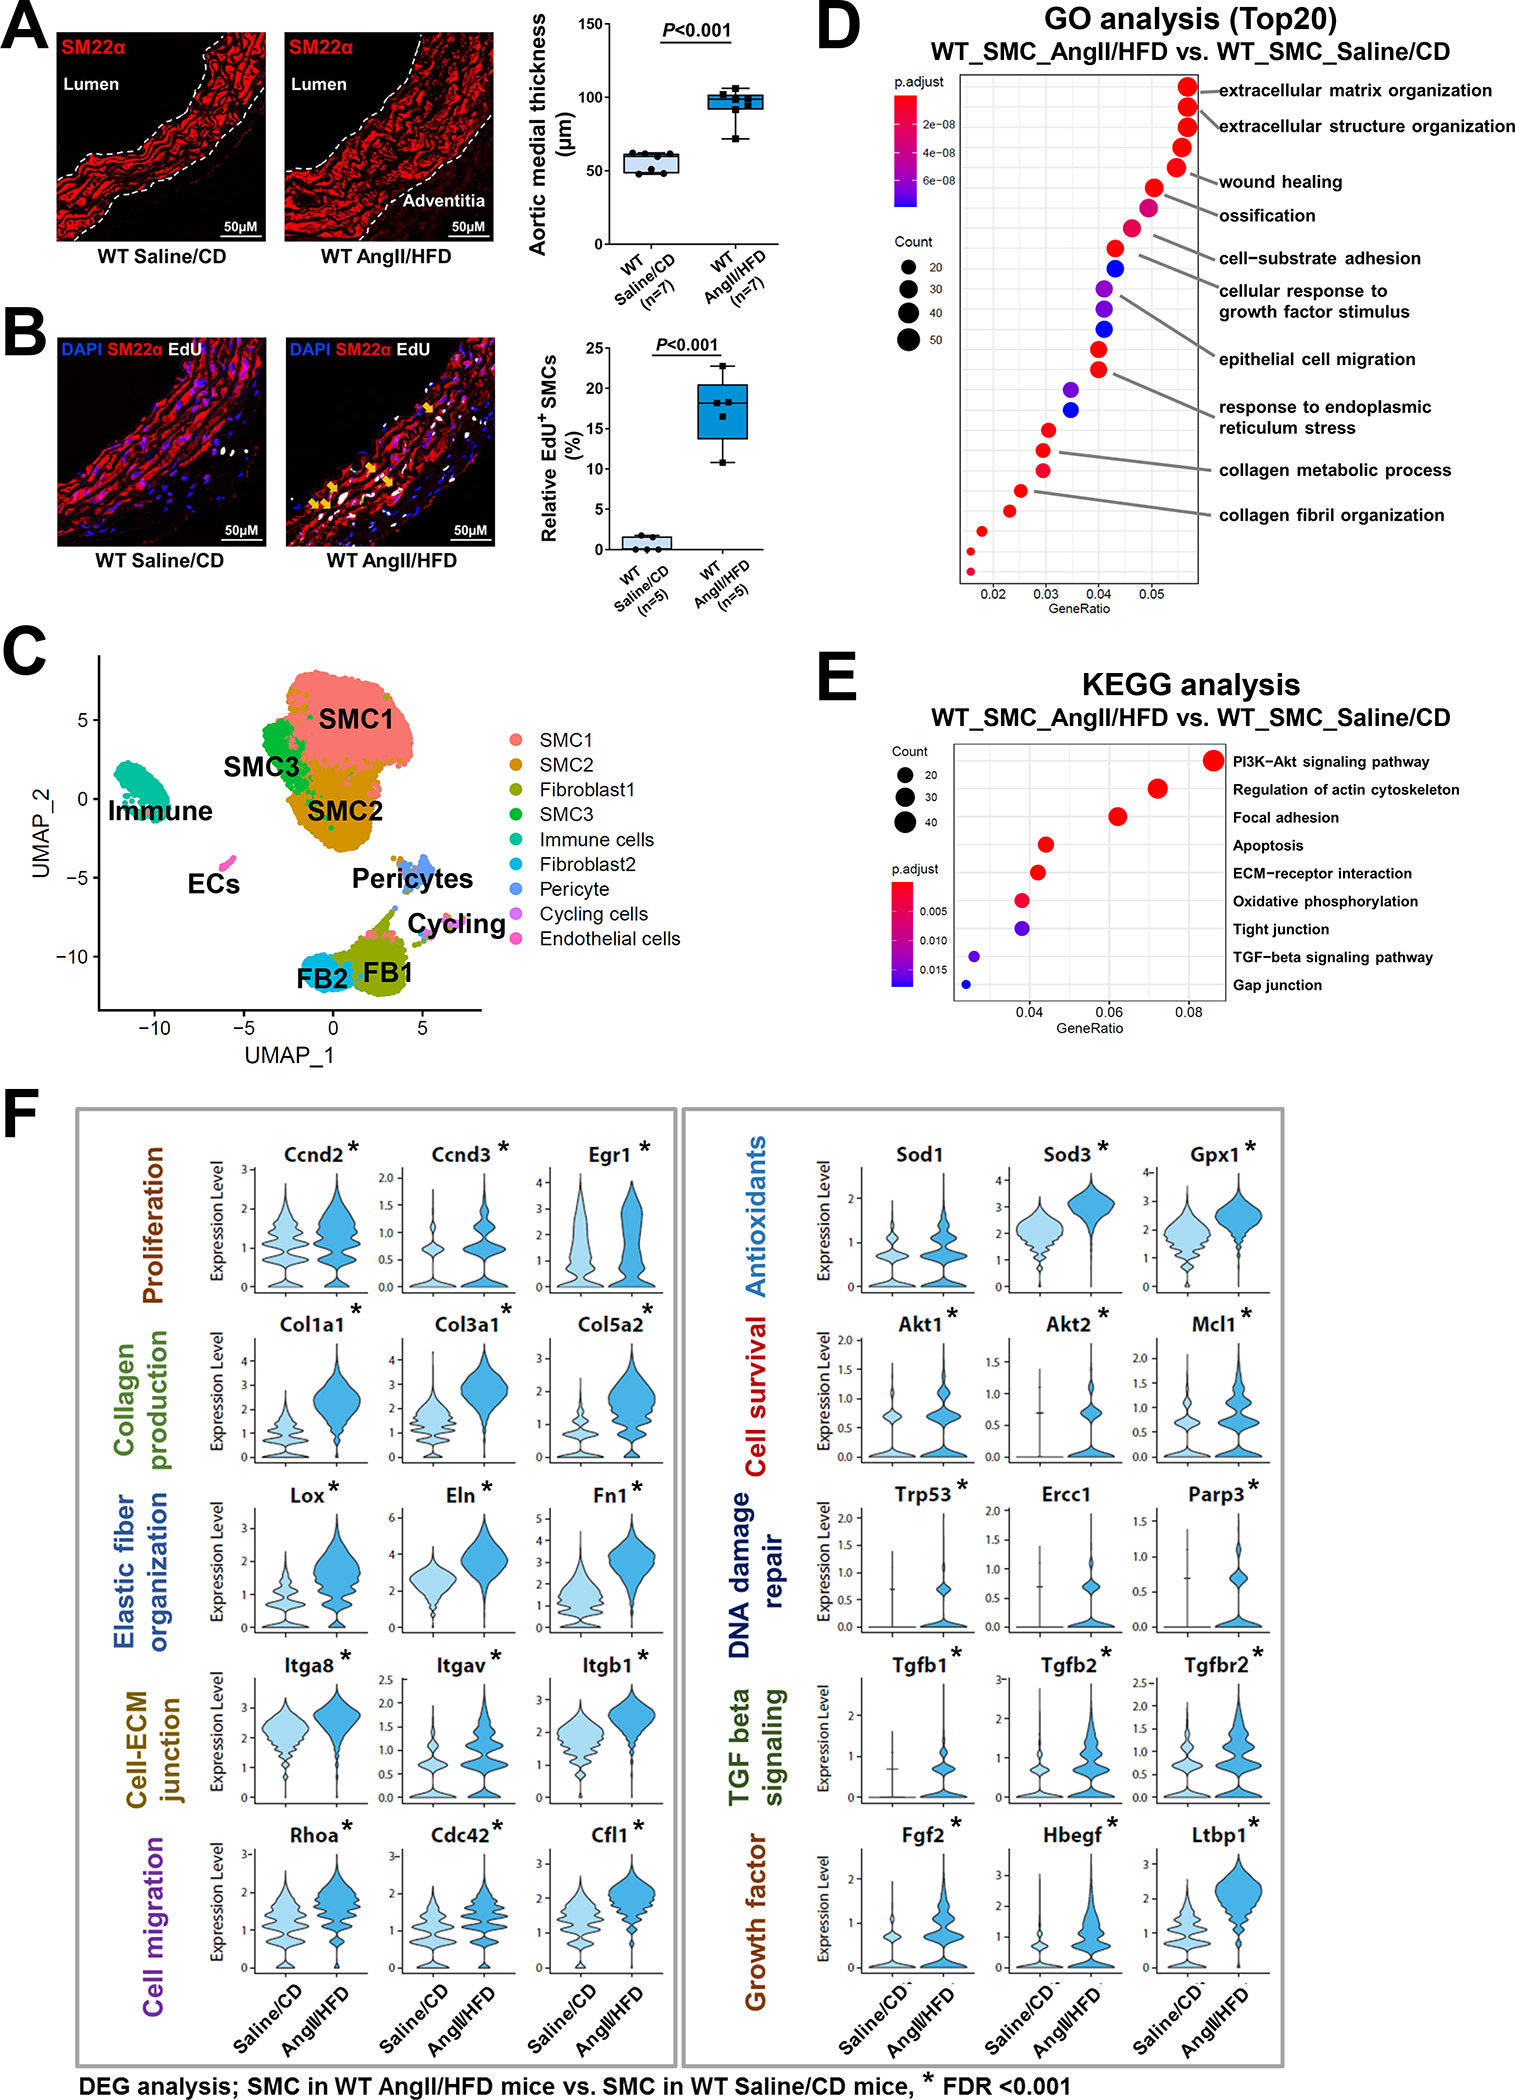
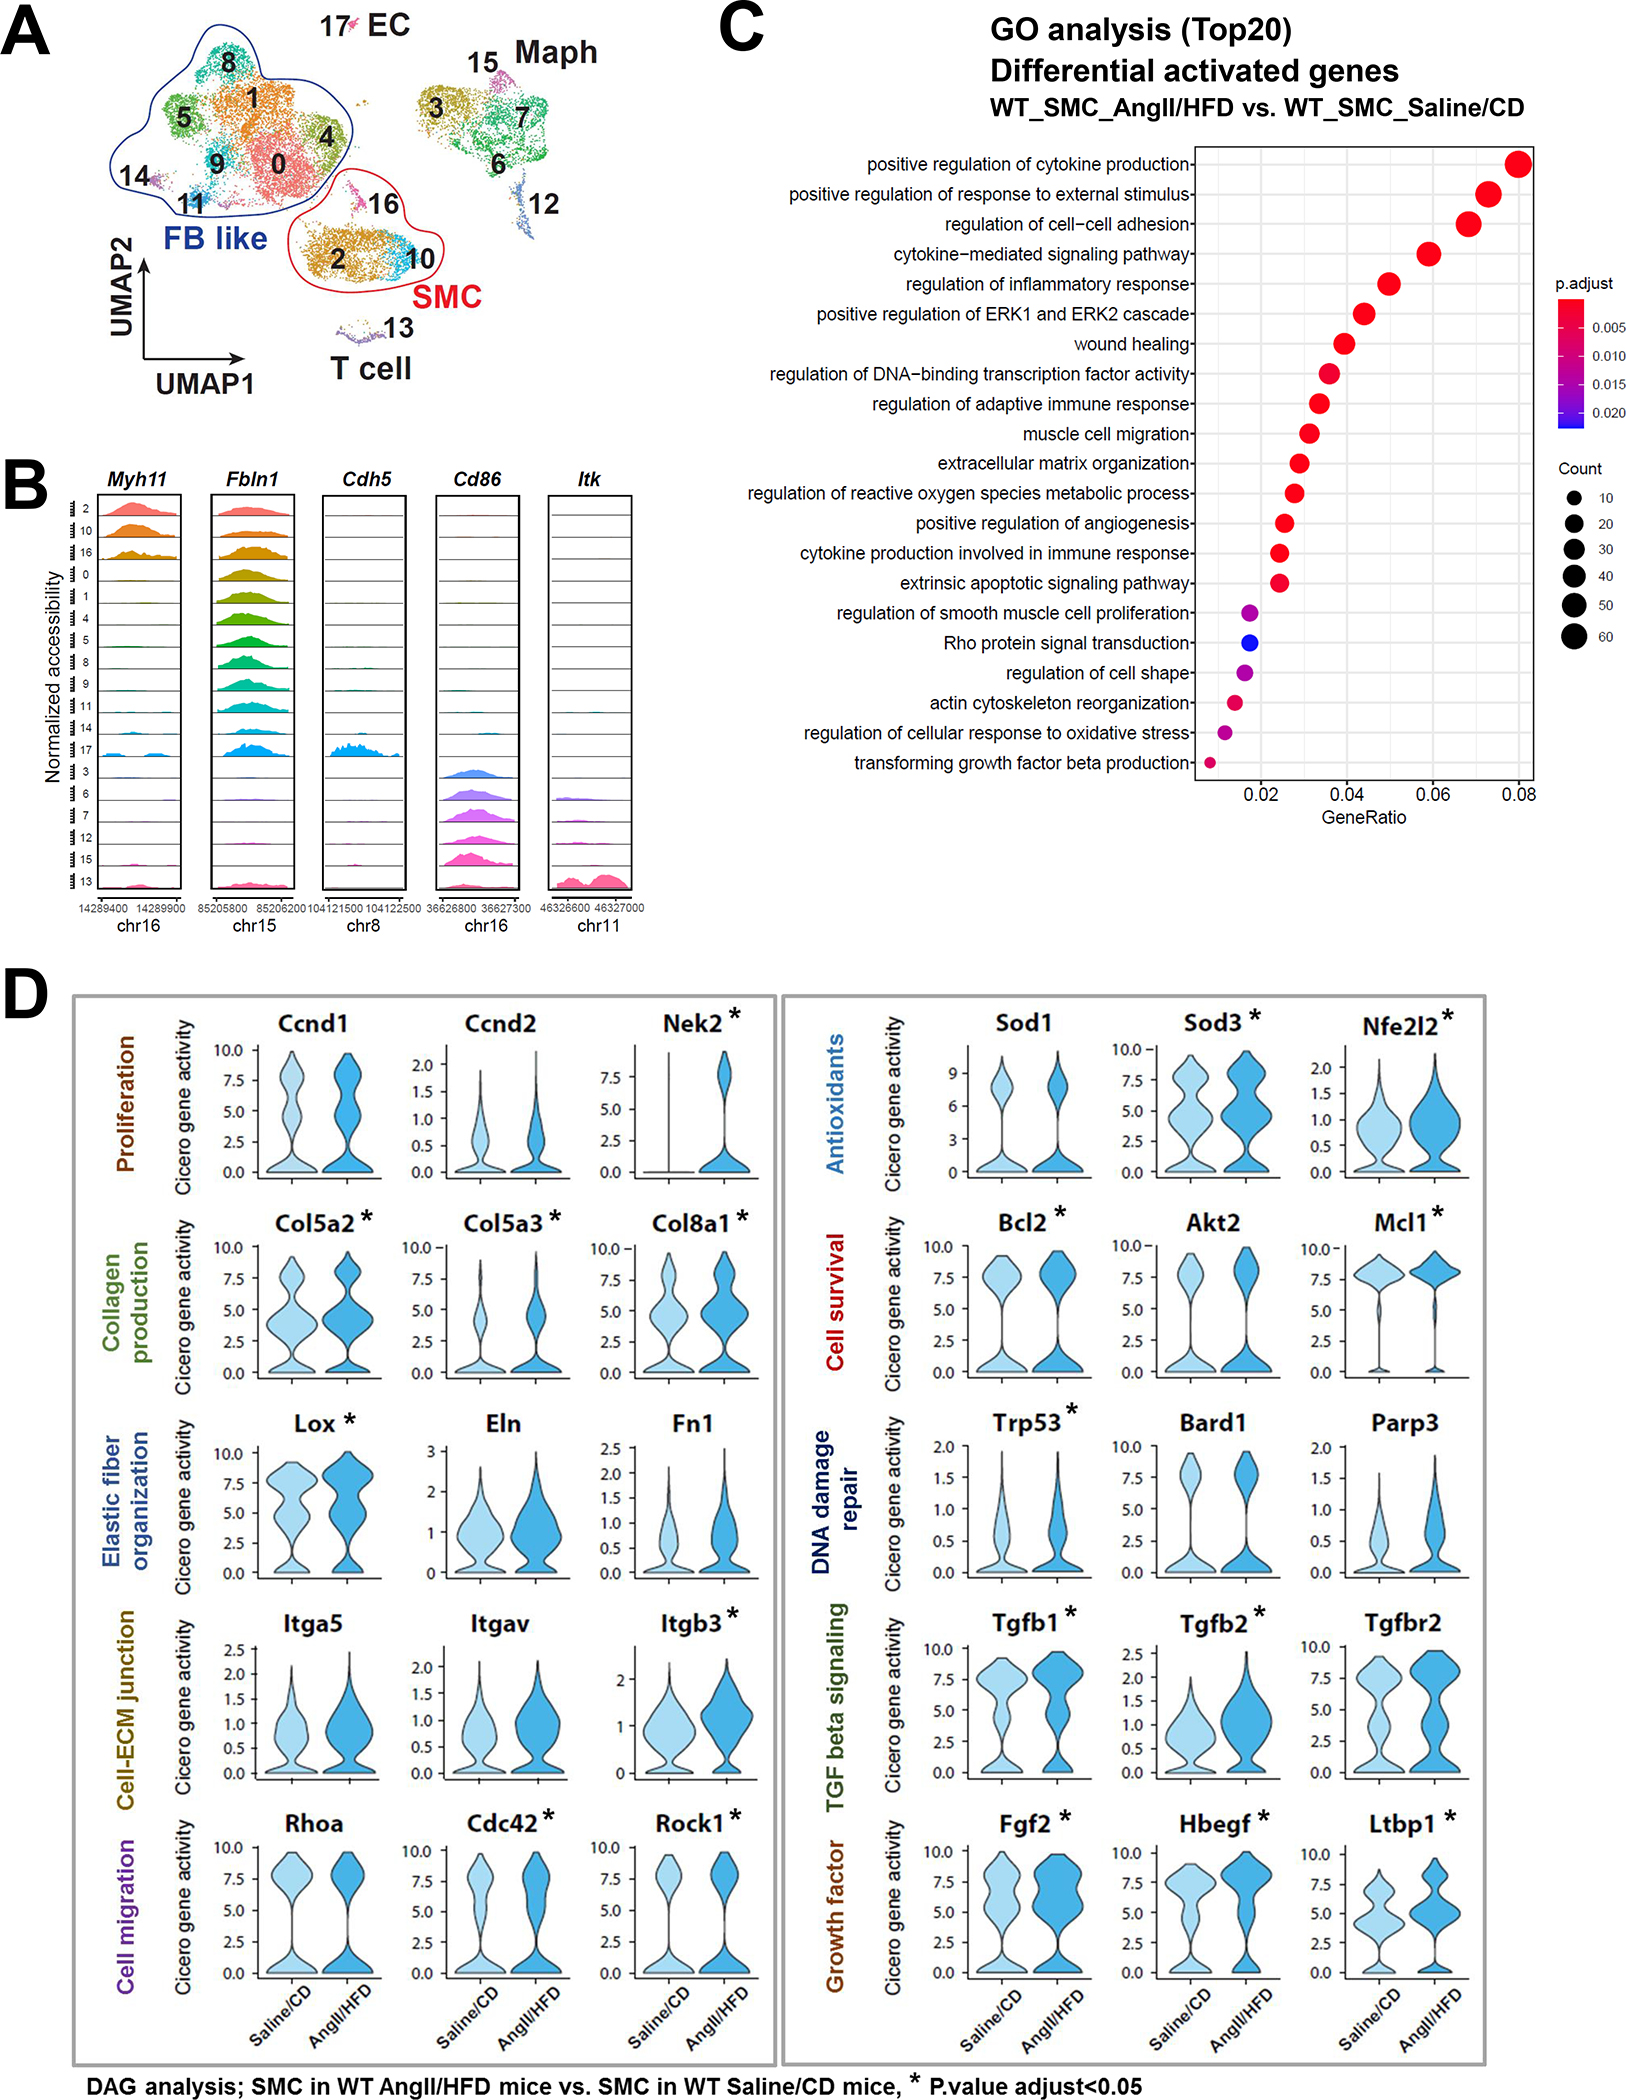
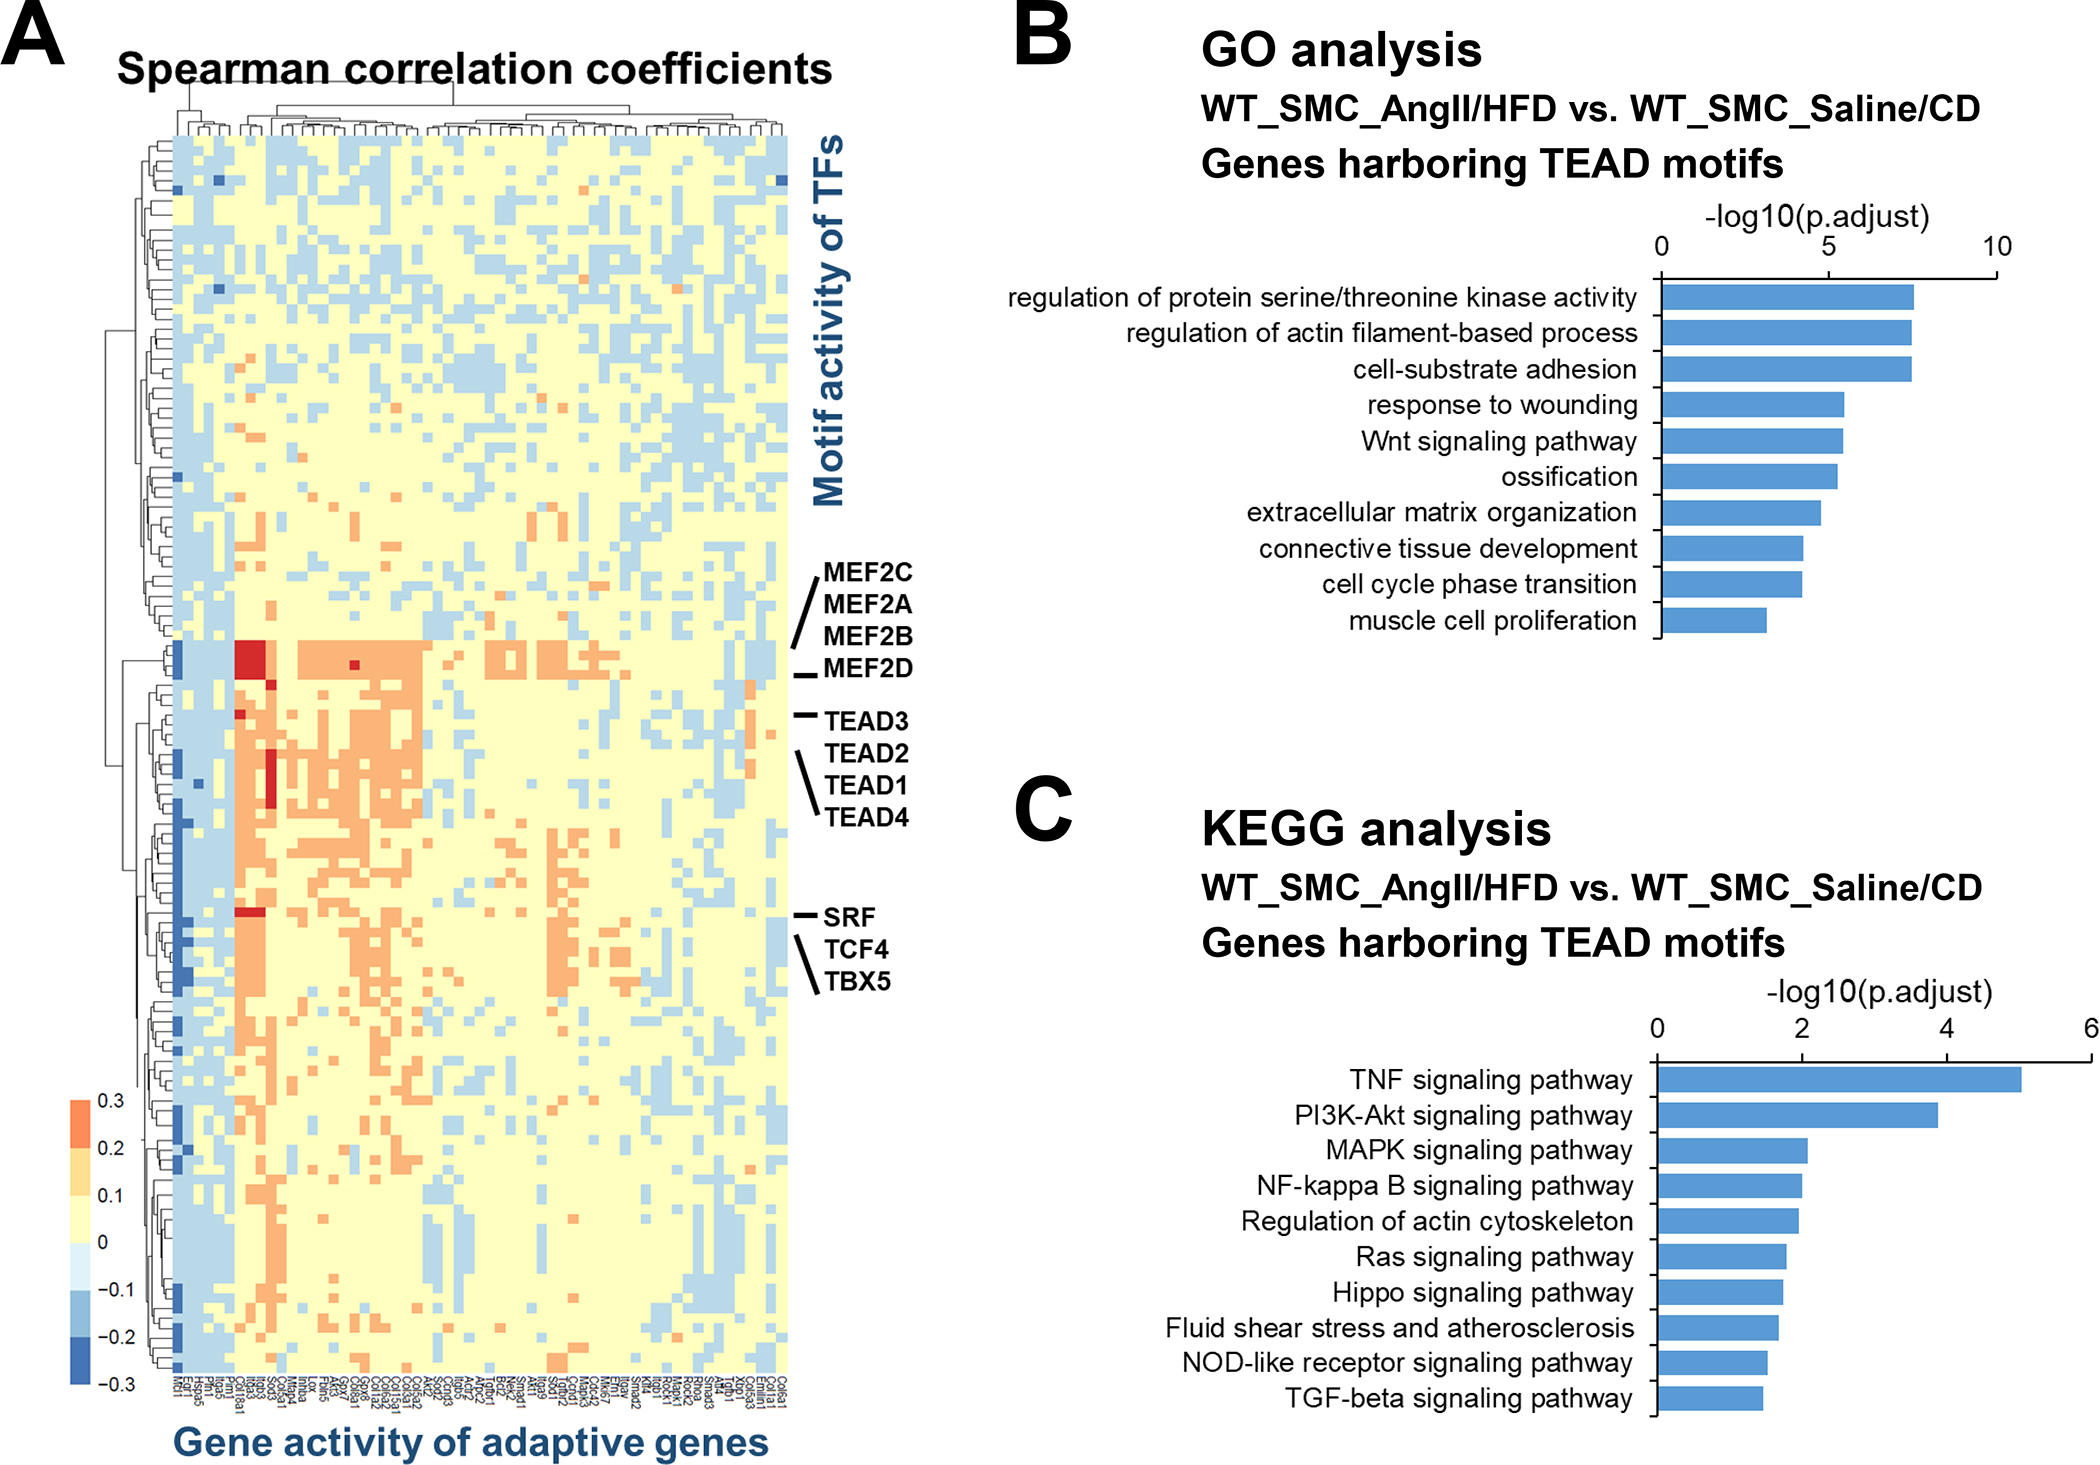
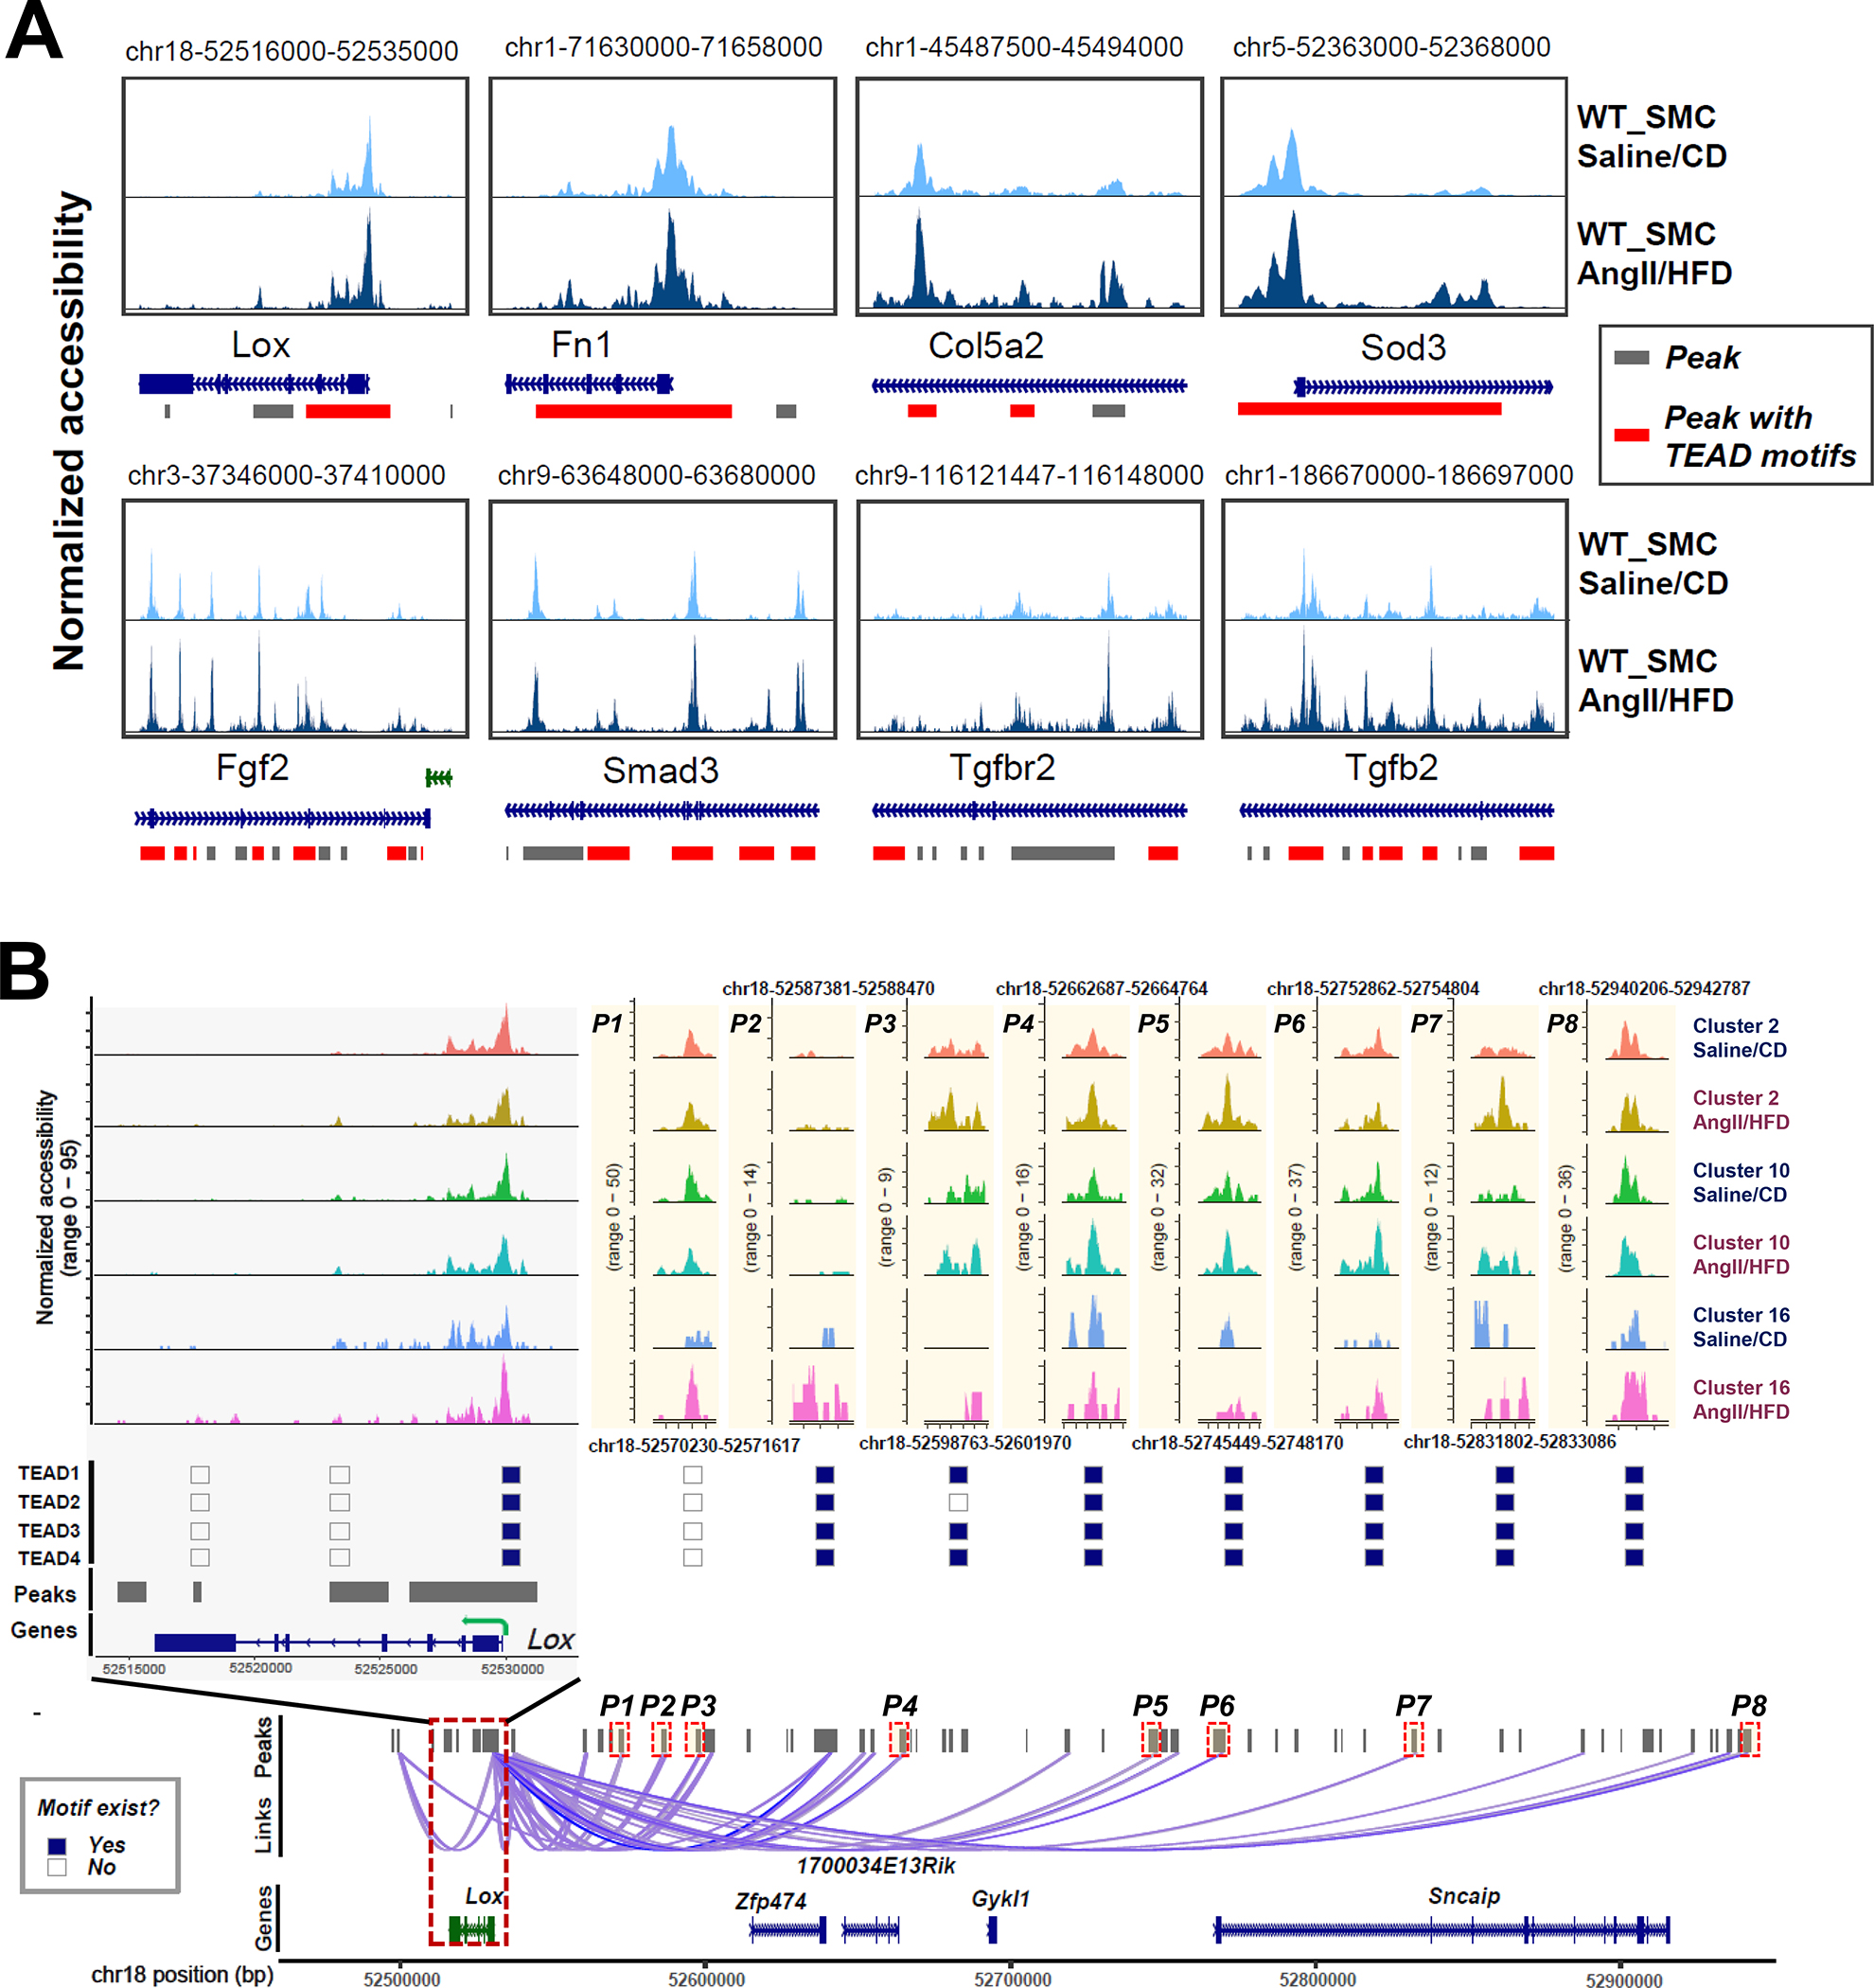
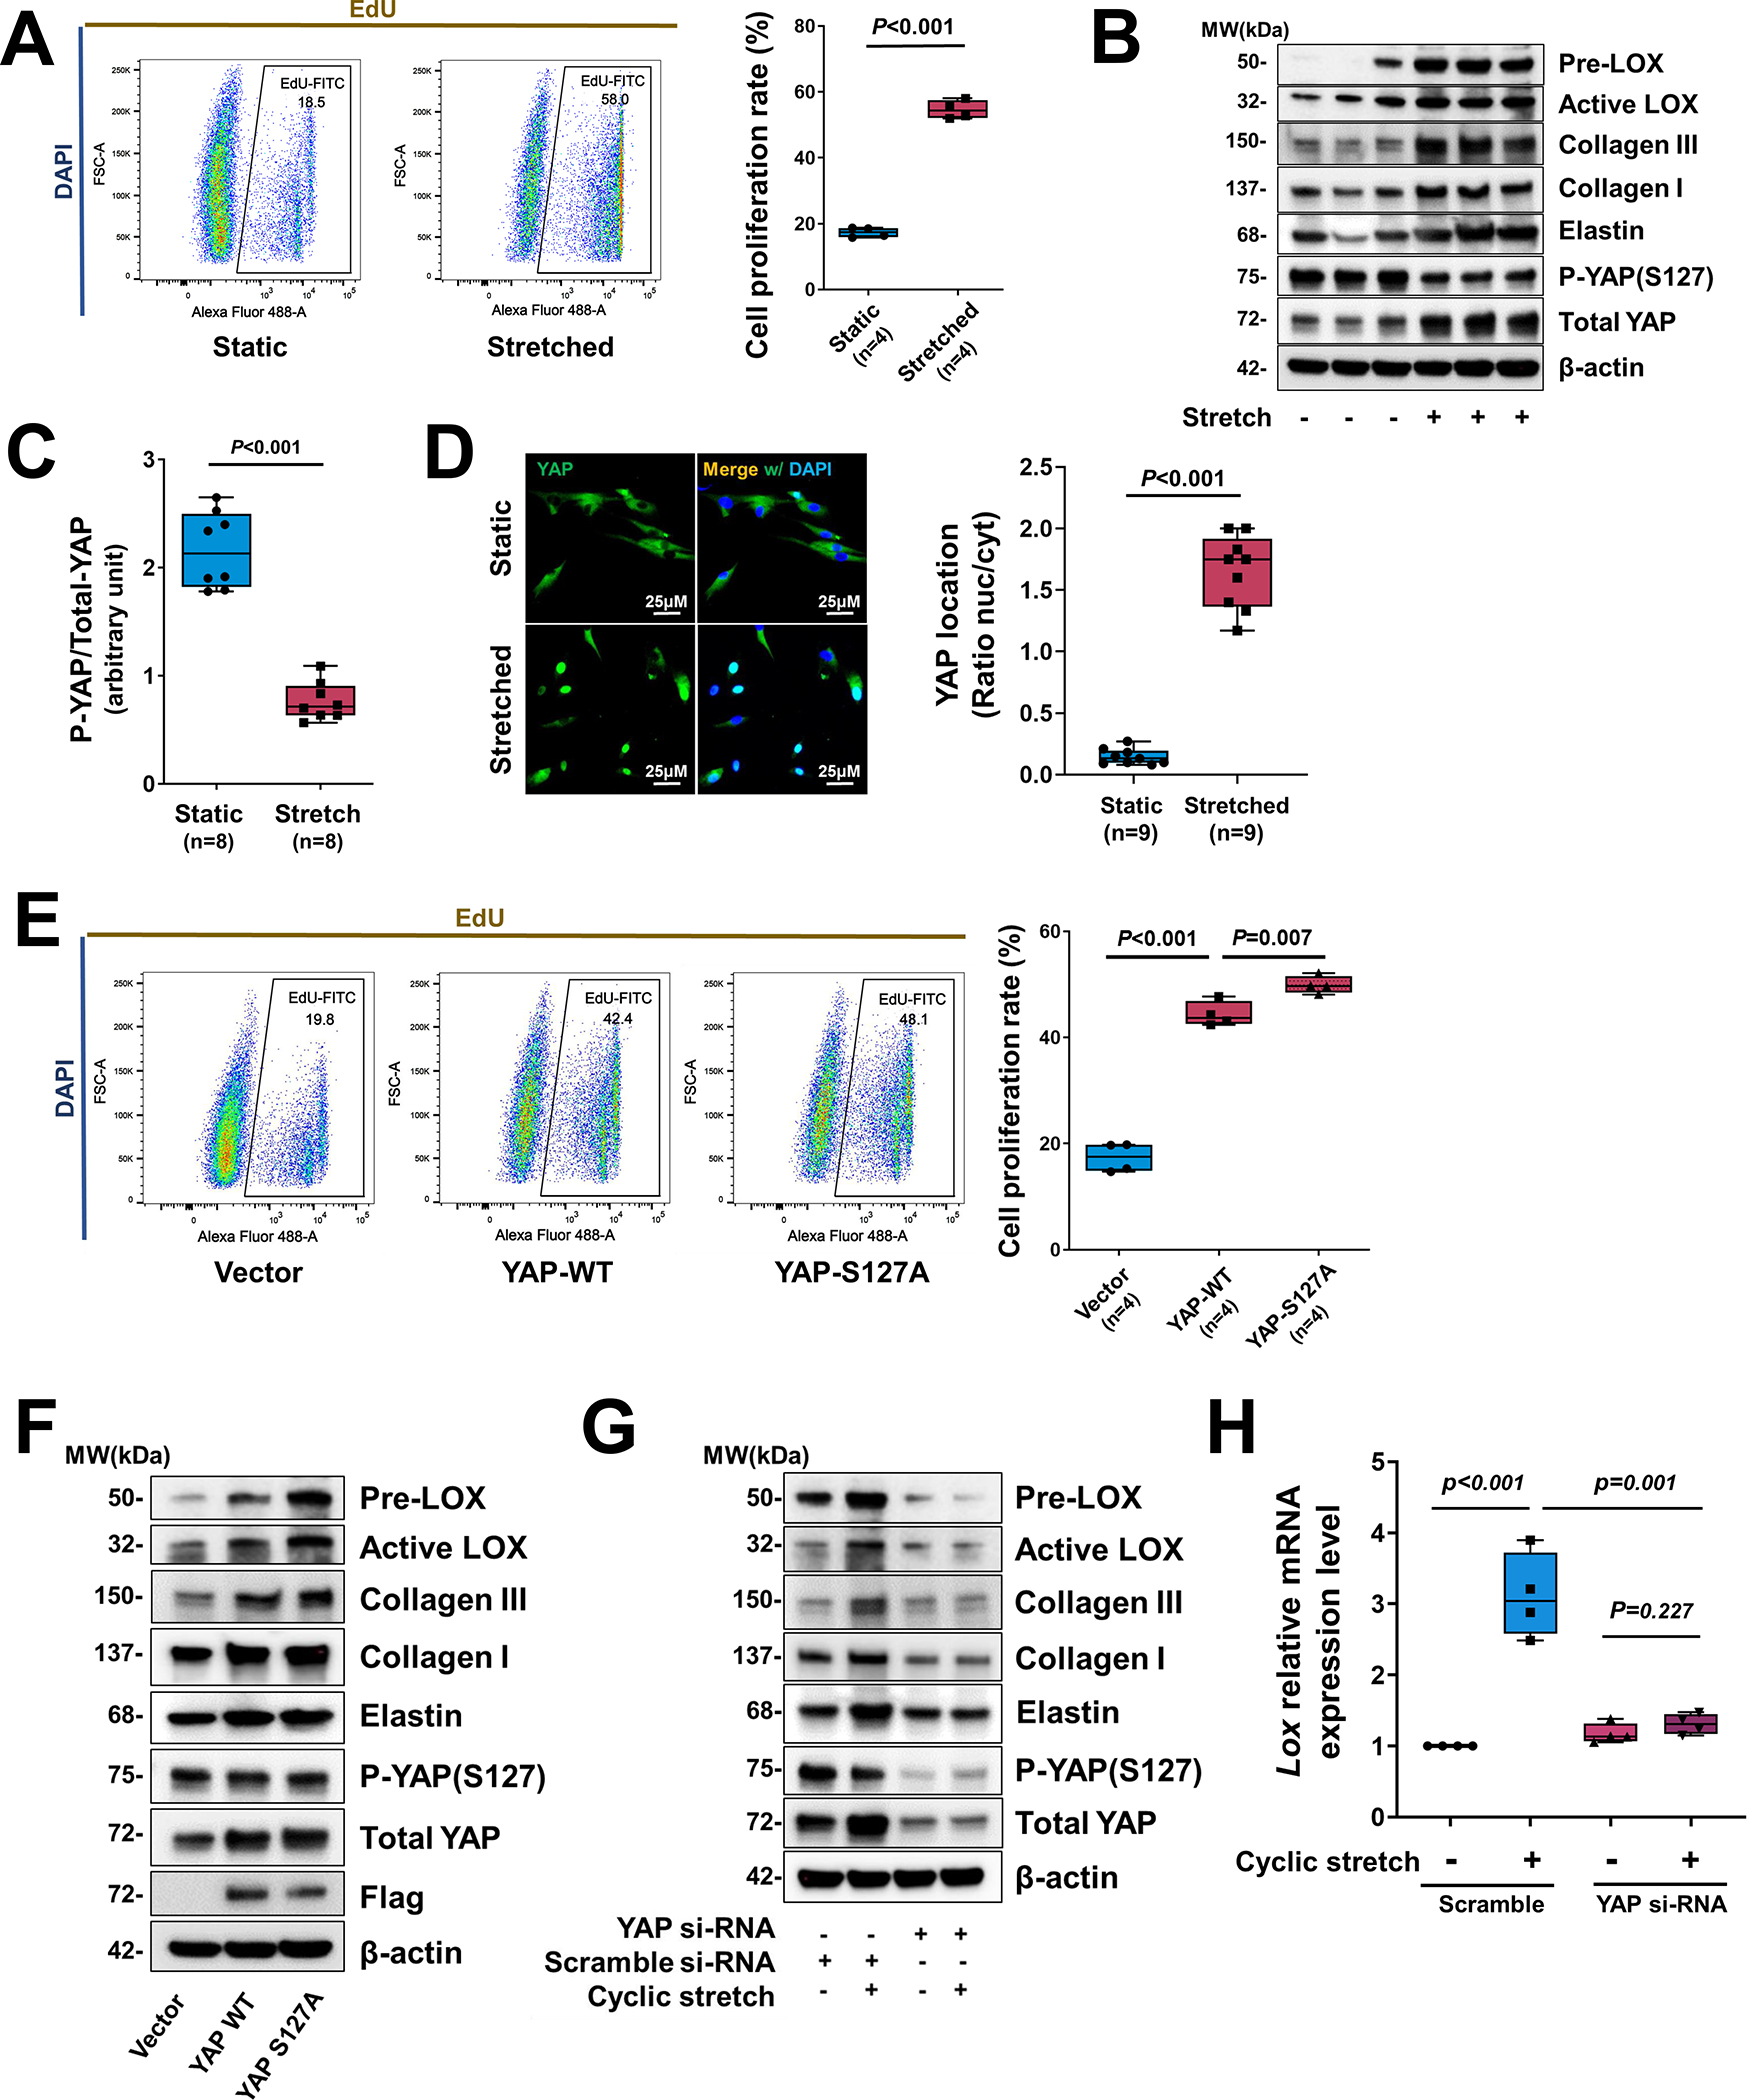
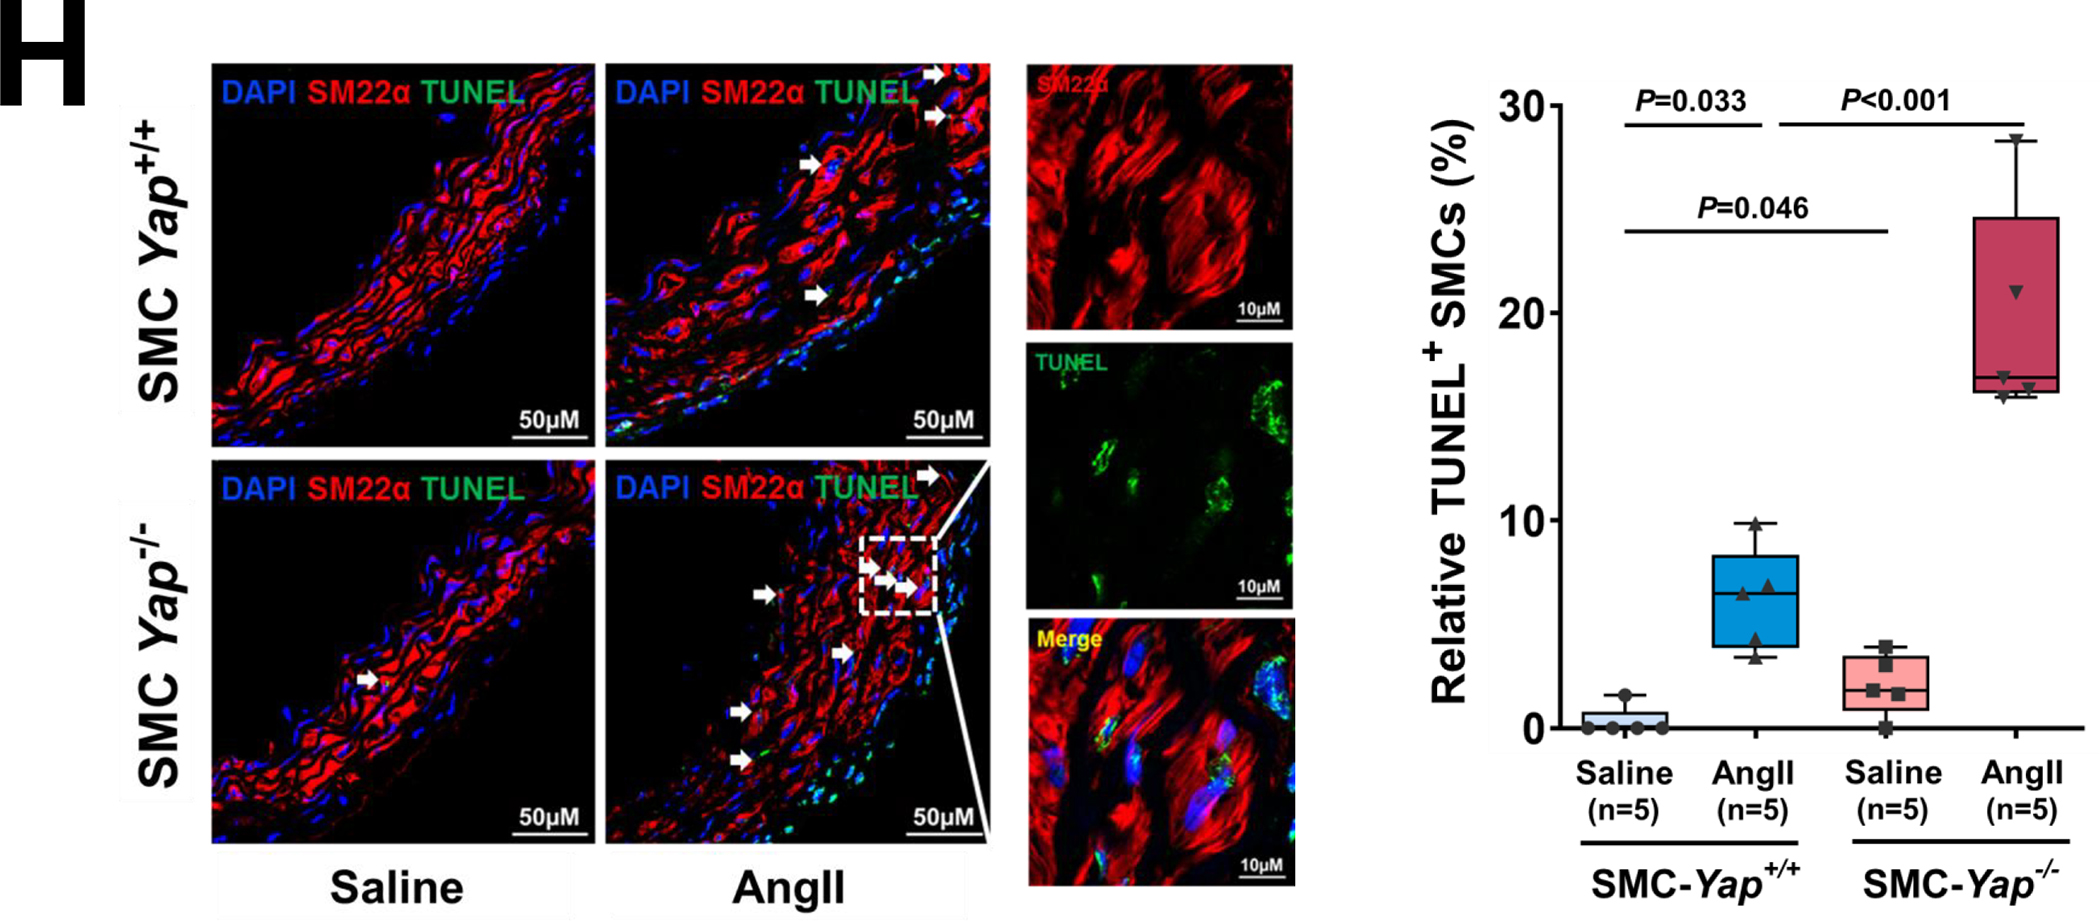
Results: In wild-type mice, AngII infusion increased medial thickness in the thoracic aorta. Single-cell RNA sequencing analysis revealed an adaptive response in thoracic SMCs characterized by upregulated genes with roles in wound healing, elastin and collagen production, proliferation, migration, cytoskeleton organization, cell-matrix focal adhesion, and PI3K-PKB/Akt (phosphoinositide-3-kinase-protein kinase B/Akt) and TGF-β (transforming growth factor beta) signaling. ScATAC-seq analysis showed increased chromatin accessibility at regulatory regions of adaptive genes and revealed the mechanical sensor YAP/transcriptional enhanced associate domains as a top candidate transcription complex driving the expression of these genes (eg, Lox, Col5a2, Tgfb2). In cultured human aortic SMCs, cyclic stretch activated YAP, which directly bound to adaptive gene regulatory regions (eg, Lox) and increased their transcript abundance. SMC-specific Yap deletion in mice compromised this adaptive response in SMCs, leading to an increased AAD incidence.

Conclusions: Aortic stress triggers the systemic epigenetic induction of an adaptive response (eg, wound healing, proliferation, matrix organization) in thoracic aortic SMCs that depends on functional biomechanical signal transduction (eg, YAP signaling). Our study highlights the importance of the adaptive response in maintaining aortic homeostasis and preventing AAD in mice.

Keywords: aortic aneurysm; extracellular matrix; homeostasis; mechanical stress; smooth muscle cell.


Conflict of interest statement

Disclosures

Dr. LeMaire serves as a consultant for Terumo Aortic and Cerus; and serves as a principal investigator for clinical studies sponsored by Terumo Aortic and CytoSorbents.

Figures

Figure 1.
Figure 1.. Single-cell RNA sequencing (scRNA-seq) analysis showing a dynamic smooth muscle cell (SMC) adaptive response to angiotensin II infusion and a high-fat diet (AngII/HFD).
A, Representative immunofluorescence staining of SMCs (SM22-α) showing that AngII/HFD increased medial thickness in the aortic wall (M, media) of wild-type (WT) mice. Box and whisker plots showing that the extent of medial thickness was increased in the ascending aorta of AngII/HFD-treated WT mice compared with saline/control diet (CD) (standard rodent diet)-treated mice (n=7 per group). B, Immunostaining showing an increase in EdU-labeled proliferating SMCs (SM22-α+) in the ascending aortic tissue of AngII/HFD-treated WT mice and the depletion of SMCs in aneurysm and dissection (AAD) tissues of AngII/HFD-treated mice. Box and whisker plots showing that the quantity of EdU+ SMCs was increased in the ascending aorta of AngII/HFD-treated WT mice (n=5) compared with saline/CD-treated WT mice (n=5). C, A 2-dimensional uniform manifold approximation and projection (UMAP) plot showing all cells colored according to the 9 major cell clusters. D-E, Dot plots showing gene ontology (GO) enrichment terms (top 20) and Kyoto Encyclopedia of Genes and Genomes (KEGG) pathway enrichment of differentially expressed genes (DEGs) induced by AngII infusion in all SMCs. F, Violin plots showing the mRNA abundance of select adaptive response genes in all SMCs. *FDR (false discovery rate) <0.001, SMCs in AngII/HFD-treated WT mice vs. SMCs in saline/CD-treated WT mice in scRNA-seq. An unpaired Student’s t-test was used in (A) and (B). P<0.001. Data are shown as box and whisker plots with the first quartile, minimum, median, third quartile, and maximum.
Figure 2.
Figure 2.. Single-cell sequencing assay for transposase-accessible chromatin (scATAC-seq) analysis showing that aortic stress triggers chromatin accessibility dynamics of smooth muscle cells (SMCs).
A, Ascending aortas of AngII/HFD-treated mice (i.e., infused with AngII for 7 days) and of saline/CD-treated mice (n=3 per group) were used for single live-cell isolation, single nuclei preparation, and scATAC-seq analysis. ScATAC-seq data projected on a 2-dimensional uniform manifold approximation and projection (UMAP). Cells are colored by cluster. Maph: macrophage, FB: fibroblast, EC: endothelial cell. B, Genome browser views (IGV) of cell-cluster combined scATAC-seq cell type marker peaks. Each row is a cluster (left), and each column is a locus within 50 kb of an ATAC-seq cell type marker gene. The colored peaks represent the normalized read count coverage. C, Dot plot showing the gene ontology (GO) enrichment terms of genes activated by AngII infusion. D, Violin plots showing the Cicero gene activity of select adaptive response genes in all SMCs. *Adjusted P-value <0.05, SMCs in AngII/HFD-treated mice vs. SMCs in saline/CD-treated mice in scATAC-seq.
Figure 3.
Figure 3.. TEADs involved in the adaptive response of smooth muscle cells (SMCs).
A, Heat map showing correlation coefficients between selected adaptive response genes and SMC-related transcription factor (TF) motif activity. B-C, Selected enriched gene ontology (GO) terms and Kyoto Encyclopedia of Genes and Genomes (KEGG) annotations for potential TEAD targets involved in the SMC adaptive response.
Figure 4.
Figure 4.. Chromatin accessibility landscape and TEAD motif distribution at the locus of Lox and other adaptive genes in smooth muscle cell (SMC) clusters.
A, Accessibility and peaks detected at the chromatin regions of 8 selected adaptive genes. Accessibility was shown for SMCs under different conditions. Peaks harboring TEAD motifs were highlighted in red. B, Aortic stress–inducible peaks at the Lox gene locus and the distal peaks that were co-accessible with peaks at the Lox gene locus in SMC clusters are shown. The distribution of TEAD motifs on aortic stress–inducible Lox peaks in SMC clusters is shown.
Figure 5.
Figure 5.. Critical role of YAP in promoting smooth muscle cell (SMC) proliferation and the expression of extracellular matrix (ECM) genes in response to cyclic stretch.
A, Human aortic SMCs (in low serum) underwent cyclic stretch for 24 h. Flow cytometry analysis showing that cyclic stretch induced cell proliferation (indicated by EdU labeling) in cultured SMCs (n=4 biologic repeats). B, Western blotting results showing that cyclic stretch induced ECM protein production in cultured SMCs and YAP expression and dephosphorylation in cultured SMCs that underwent cyclic stretch (n=8 biologic repeats). C, Western blotting quantification showing that cyclic stretch induced a marked dephosphorylating of YAP in cultured SMCs. D, Representative immunofluorescence staining (images and quantification data) showing the cyclic stretch–induced nuclear translocation of YAP (n=3 biologic repeats and 3 replicates). E-F, SMCs were transfected with wild-type (WT) YAP or constitutively-active YAP (S127A) (n=5 biologic repeats). Overexpression of YAP induced cell proliferation (E) and ECM protein production (F). G, Silencing YAP with siRNA prevented ECM protein production. H, LOX mRNA levels (n=5 biologic repeats) were increased by cyclic stretch, and silencing Yap with siRNA partially prevented LOX expression induced by cyclic stretch. Two-way analysis of variance (ANOVA) with Bonferroni’s post hoc test for pairwise comparisons was used in (H). A paired Student’s t-test was used in (C). Data are shown as box and whisker plots with the first quartile, minimum, median, third quartile, and maximum in (A), (C), (D), (E), and (H).
Figure 6.
Figure 6.. The YAP-mediated adaptive response identified by performing single-cell transcriptomic analysis of smooth muscle cell (SMC)-specific Yap knockout mouse aortas.
A, Six-week-old male Yap1fl/fl; Myh11-CreERT2 mice were given tamoxifen or vehicle (corn oil) via daily intraperitoneal injection for 5 days. Seven days later, mice were infused with angiotensin II (AngII 1,000 ng/kg/min; n=3) or saline (n=3; control) for 7 days, and ascending aortas were collected for single-cell RNA-seq. B, Dot plot of the top 20 enriched gene ontology (GO) biologic process terms and top-enriched Kyoto Encyclopedia of Genes and Genomes (KEGG) pathway terms identified in SMCs of AngII-infused SMC-Yap+/+ mice (Ctrl_AngII) compared with SMCs of saline-infused SMC-Yap+/+ mice (Ctrl_Saline). Associated genes were significantly upregulated in SMC-Yap+/+ AngII mice (logFC< −0.3 & FDR<0.05). The size of the dots represents the number of genes that are on the list of significant differentially expressed genes associated with GO and KEGG terms. The color of the dots represents the P-adjusted values. C, Dot plot of the top GO biologic process terms and KEGG pathway terms identified in SMCs of AngII-infused SMC-Yap−/− mice (KO_AngII) compared with SMCs of AngII-infused SMC-Yap+/+ mice (Ctrl_AngII) showing the significant downregulation of the associated genes in SMC-Yap−/− AngII-infused mice (logFC< −0.3 & FDR<0.05). D, Violin plots showing the mRNA abundance changes of adaptive response genes in all Myh11+ SMCs of 4 groups of mice (Ctrl_Saline, Ctrl_AngII, KO_Saline, and KO_ AngII). *FDR <0.001, SMCs in SMC-Yap−/− AngII-treated mice vs. SMCs in SMC-Yap+/+ AngII-treated mice in scRNAseq. E, Immunofluorescence staining and quantification of the cell proliferation marker phospho-histone H3 indicated that less SMC proliferation occurred in the ascending aortic medial wall of SMC-Yap−/− AngII-treated mice than in that of SMC-Yap+/+ AngII-treated mice. F, Box and whisker plots showing that medial thickness was reduced in the ascending aorta of AngII-treated SMC-Yap−/− mice compared with AngII-treated SMC-Yap+/+ mice (n=10 per group). G, Western blot analysis of ascending aorta lysates showing that levels of ECM proteins elastin, collagen I, and LOX were markedly lower in AngII-treated SMC-Yap−/− mice than in AngII-treated SMC-Yap+/+ mice. Box and whisker plots showing the quantification of the fold change in total-Yap and the quantification of the p-YAP/total-Yap ratio in Ctrl_Saline and Ctrl_AngII. H, Representative images and corresponding quantification of TUNEL (terminal deoxynucleotidyl transferase dUTP nick end labeling) staining showing a significant increase in the number of TUNEL-positive cells in the ascending aortas of AngII-treated SMC-Yap−/− mice compared with AngII-treated SMC-Yap+/+ mice. Nuclei were counterstained with DAPI (blue). Two-way analysis of variance with the Bonferroni post hoc test was used for pairwise comparisons in (E), (F), (G), and (H). Data are shown as box and whisker plots with the first quartile, minimum, median, third quartile, and maximum.
Figure 7.
Figure 7.. Protective role of smooth muscle cell (SMC)-specific YAP in the aortic wall.
A, Representative images of excised aortas showing more aortic damage in AngII-infused SMC-specific Yap-deficient mice (SMC-Yap−/− AngII; n=23) than in AngII-infused littermate control mice (SMC-Yap+/+ AngII; n=20). Boxes indicate rupture area. B, Median aortic diameters of SMC-Yap−/− AngII mice were enlarged in various aortic segments compared with those of SMC-Yap+/+ AngII mice. Asc, ascending; Desc, descending; SR, suprarenal; IR, infrarenal. C, The overall incidence of AAD was significantly higher in SMC-Yap−/− AngII mice than in SMC-Yap+/+ AngII mice. D-G, The incidence of AAD in different aortic segments was significantly lower in SMC-Yap−/− AngII mice than in SMC-Yap+/+ AngII mice. H, Wire myography analysis of ascending thoracic aortic rings showing that the contractile response to phenylephrine was significantly reduced in saline-infused SMC-Yap−/− mice (SMC-Yap−/− Saline, n=6) compared with saline-infused littermate control mice (SMC-Yap+/+ Saline, n=6). AngII infusion decreased contractile ability in both SMC-Yap−/− AngII mice (n=6) and SMC-Yap+/+ AngII mice (n=6). Multi-way analysis of variance with the Holm-Sidak test was used for pairwise comparisons in (H). Data are presented as mean ± standard deviation of the mean.

References

    1. Humphrey JD, Schwartz MA, Tellides G, Milewicz DM. Role of mechanotransduction in vascular biology: focus on thoracic aortic aneurysms and dissections. Circ Res. 2015;116:1448–1461. doi: 10.1161/CIRCRESAHA.114.304936 - DOI - PMC - PubMed
    1. Sherifova S, Holzapfel GA. Biomechanics of aortic wall failure with a focus on dissection and aneurysm: A review. Acta Biomater. 2019;99:1–17. doi: 10.1016/j.actbio.2019.08.017 - DOI - PMC - PubMed
    1. Humphrey JD, Milewicz DM, Tellides G, Schwartz MA. Cell biology. Dysfunctional mechanosensing in aneurysms. Science. 2014;344:477–479. doi: 10.1126/science.1253026 - DOI - PMC - PubMed
    1. Shen YH, LeMaire SA, Webb NR, Cassis LA, Daugherty A, Lu HS. Aortic Aneurysms and Dissections Series. Arterioscler Thromb Vasc Biol. 2020;40:e37–e46. doi: 10.1161/ATVBAHA.120.313991 - DOI - PMC - PubMed
    1. Anwar MA, Shalhoub J, Lim CS, Gohel MS, Davies AH. The effect of pressure-induced mechanical stretch on vascular wall differential gene expression. J Vasc Res. 2012;49:463–478. doi: 10.1159/000339151 - DOI - PubMed

Publication types