. 2023 Jun;64(6):918-929.
doi: 10.1111/jcpp.13749. Epub 2022 Dec 29.

Adolescent functional network connectivity prospectively predicts adult anxiety symptoms related to perceived COVID-19 economic adversity

Affiliations

Adolescent functional network connectivity prospectively predicts adult anxiety symptoms related to perceived COVID-19 economic adversity

Felicia A Hardi et al. J Child Psychol Psychiatry. 2023 Jun.

Abstract

Background: Stressful events, such as the COVID-19 pandemic, are major contributors to anxiety and depression, but only a subset of individuals develop psychopathology. In a population-based sample (N = 174) with a high representation of marginalized individuals, this study examined adolescent functional network connectivity as a marker of susceptibility to anxiety and depression in the context of adverse experiences.

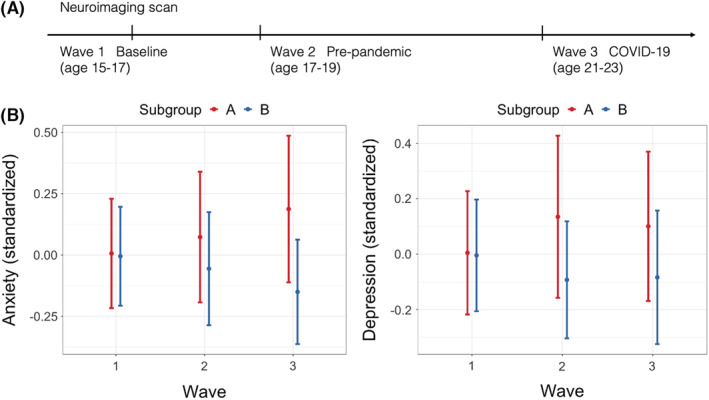
Methods: Data-driven network-based subgroups were identified using an unsupervised community detection algorithm within functional neural connectivity. Neuroimaging data collected during emotion processing (age 15) were extracted from a priori regions of interest linked to anxiety and depression. Symptoms were self-reported at ages 15, 17, and 21 (during COVID-19). During COVID-19, participants reported on pandemic-related economic adversity. Differences across subgroup networks were first examined, then subgroup membership and subgroup-adversity interaction were tested to predict change in symptoms over time.

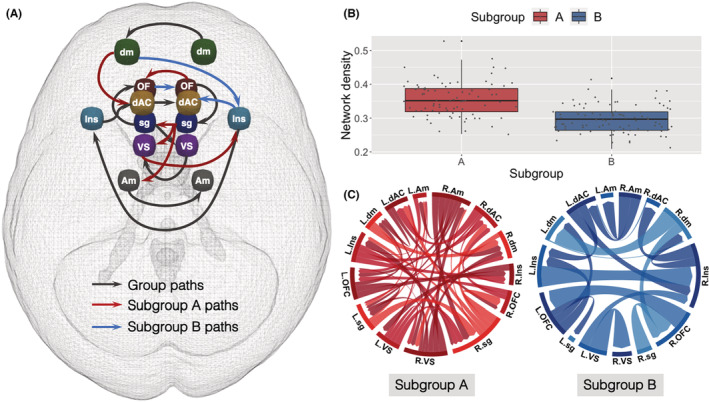
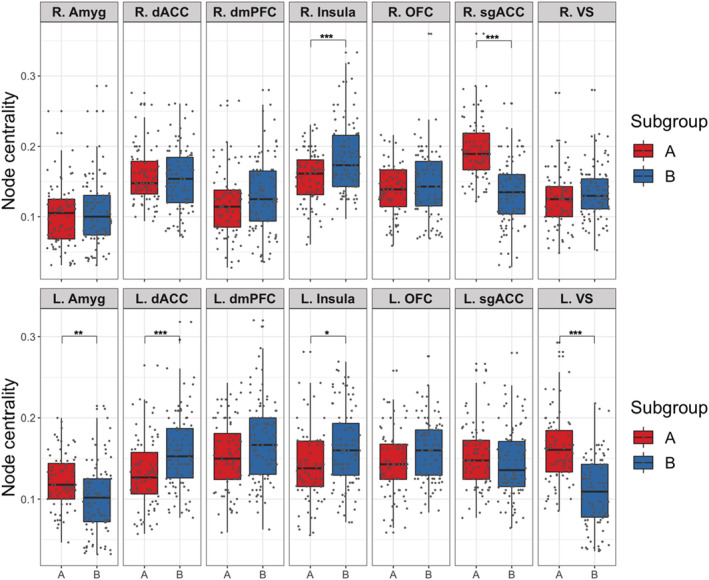
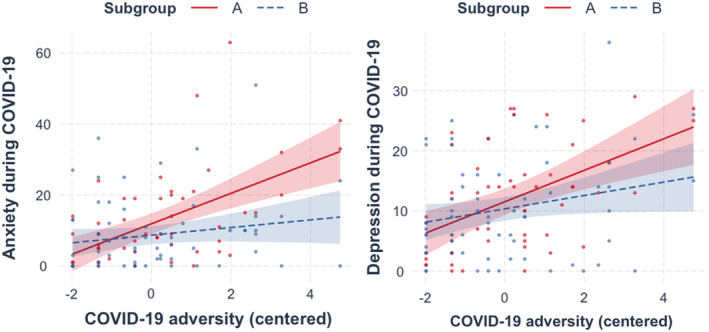
Results: Two subgroups were identified: Subgroup A, characterized by relatively greater neural network variation (i.e., heterogeneity) and density with more connections involving the amygdala, subgenual cingulate, and ventral striatum; and the more homogenous Subgroup B, with more connections involving the insula and dorsal anterior cingulate. Accounting for initial symptoms, subgroup A individuals had greater increases in symptoms across time (β = .138, p = .042), and this result remained after adjusting for additional covariates (β = .194, p = .023). Furthermore, there was a subgroup-adversity interaction: compared with Subgroup B, Subgroup A reported greater anxiety during the pandemic in response to reported economic adversity (β = .307, p = .006), and this remained after accounting for initial symptoms and many covariates (β = .237, p = .021).

Conclusions: A subgrouping algorithm identified young adults who were susceptible to adversity using their personalized functional network profiles derived from a priori brain regions. These results highlight potential prospective neural signatures involving heterogeneous emotion networks that predict individuals at the greatest risk for anxiety when experiencing adverse events.

Keywords: Stress susceptibility; anxiety; functional connectivity; person-specific network.


Figures

Figure 1
Figure 1
Neural networks derived during an emotion processing task. (A) S‐GIMME derived group level, subgroup level, and illustrative individual‐level connections. Nodes shown are as follows: amygdala (Am; gray), dorsal anterior cingulate cortex (dAC; yellow), dorsomedial prefrontal cortex (dm; green), insula (Ins; blue), orbitofrontal cortex (OF; dark red), subgenual anterior cingulate cortex (sg; dark blue), and ventral striatum (VS; purple). Eighty (N = 80) individuals were clustered into Subgroup A, whereas 94 (N = 94) individuals were clustered into Subgroup B. Group‐level paths (connections present in at least 75% of the entire sample) are shown in black; subgroup paths (connections present in at least 50% of individuals in each subgroup) are shown in red (Subgroup A) and blue (Subgroup B). Thresholds were default parameters used in connectivity and subgrouping estimation based on large‐scale simulations. All connections were positive on average, in exception for left dorsomedial prefrontal cortex (dm) to right insula (Ins) Subgroup B path (all average path estimates reported in Table S8). (B) Network density (i.e., the proportion of actual contemporaneous connections from the number of possible connections in a network) for each individual in Subgroup A (red) and Subgroup B (blue). Network density was significantly greater in Subgroup A compared with Subgroup B (M A = .36, SD A = .05; M B = .30, SD B = .04; t(147.36) = 8.47, p < .001). (C) Person‐specific network maps (i.e., individual‐level functional connectivity estimated for each individual in the sample) for one individual in Subgroup A (red) and another individual in Subgroup B (blue). L. and R. indicate left/right hemisphere. Subgroup A individual had a more heterogeneous network, with more connections beyond group‐ and subgroup‐level connections, whereas Subgroup B individual had a more homogenous network, with fewer connections overall but more similar connections to the group‐ and subgroup‐level patterns. All edges shown were contemporaneous, and figures were created using customized R codes and circlize package (Gu, Gu, Eils, Schlesner, & Brors, 2014)
Figure 2
Figure 2
Node centrality across each ROI plotted for each subgroup. ***Bonferroni‐corrected p < .001, **Bonferroni‐corrected p < .01, *Bonferroni‐corrected p < .05. Left to right: amygdala (Amyg), dorsal anterior cingulate (dACC), dorsomedial prefrontal cortex (dmPFC), insula, orbitofrontal (OFC), subgenual anterior cingulate (sgACC), ventral striatum (VS). Hemispheres denoted by R. and L. Compared with Subgroup B (blue), Subgroup A (red) shows significantly greater node centrality, specifically in the left amygdala (L.Amyg), left striatum (L.VS), and right subgenual anterior cingulate (R.sgACC). In contrast, Subgroup B shows greater node centrality in the left dorsal anterior cingulate (L.dACC) and bilateral insula (R.Insula, L.Insula). p Values were Bonferroni‐corrected for multiple comparisons (Table S5)
Figure 3
Figure 3
Anxiety and depressive symptoms across three waves. (A) Illustration of timepoints and ages at each wave of data collection. (B) Anxiety and depression for each subgroup (A: more heterogeneous network with greater centrality in the amygdala, subgenual, and striatum and B: relatively sparser network with greater centrality in the insula and dorsal anterior cingulate) across each wave. Participants across subgroups did not differ in initial anxiety and depression at wave 1, but symptoms began to diverge at wave 2, which persisted through wave 3. For anxiety, this divergence was exacerbated by COVID‐19 at wave 3, whereas subgroup difference for depression during COVID‐19 remained similar to prepandemic difference. Each point represents mean values, and the bars indicate standard errors
Figure 4
Figure 4
Differential effects of COVID‐19 economic adversity on anxiety and depression across neural‐based subgroups. Symptoms during COVID‐19 (wave 3) were elevated as a function of COVID‐19 economic adversity, especially for subgroup A. Subgroup–adversity interaction was significant for anxiety (b = .275, 95% CI = [.470, .080], p = .006), but not depression (b = .175, 95% CI = [−.026, .376], p = .088). Subgroup A slope is depicted in red and Subgroup B slope in blue. COVID‐19 adversity scores were mean‐centered to aid interpretation. LEFT: Subgroup–adversity interaction for anxiety symptoms. Subgroup A slope (b = .366, 95% CI = [.218, .514], p < .001); Subgroup B slope (b = .092, 95% CI = [−.035, .219], p = .154). RIGHT: Subgroup–adversity interaction for depressive symptoms. Subgroup A slope (b = .304, 95% CI = [.151, .457], p < .001); Subgroup B slope (b = .129, 95% CI = [−.001, .260], p = .053)

References

    1. Bassett, D.S. , & Bullmore, E.T. (2017). Small‐world brain networks revisited. The Neuroscientist, 23, 499–516. - PMC - PubMed
    1. Beck, A.T. , & Clark, D.A. (1988). Anxiety and depression: An information processing perspective. Anxiety Research, 1, 23–36.
    1. Beltz, A. , Dotterer, H. , & Goetschius, L. (2019). GIMME preprocessing: Initial release (version v1. 0). Zenodo . doi: 10.5281/zenodo.2692522 - DOI
    1. Beltz, A.M. , & Gates, K.M. (2017). Network mapping with GIMME. Multivariate Behavioral Research, 52, 789–804. - PMC - PubMed
    1. Boyce, W.T. , & Ellis, B.J. (2005). Biological sensitivity to context: I. An evolutionary–developmental theory of the origins and functions of stress reactivity. Development and Psychopathology, 17, 271–301. - PubMed

Publication types