. 2022 Dec 1;23(12):4005-4012.
doi: 10.31557/APJCP.2022.23.12.4005.

Assessment of hOGG1 Genetic Polymorphism (rs1052133) and DNA Damage in Radiation-Exposed Workers

Affiliations

Assessment of hOGG1 Genetic Polymorphism (rs1052133) and DNA Damage in Radiation-Exposed Workers

Harry Nugroho Eko Surniyantoro et al. Asian Pac J Cancer Prev. .

Abstract

Objective: The aim of this study was to assess the effect of radiation exposure, human 8-oxoguanine DNA N-glycosylase-1 (hOGG1) exon 7 genetic polymorphism and confounding factors on DNA damage response.

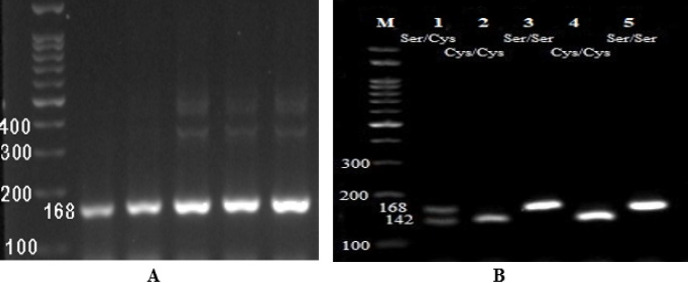
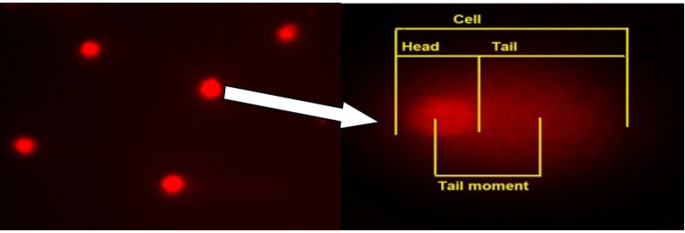
Methods: Polymerase Chain Reaction-Restriction Fragment Length Polymorphism (PCR-RFLP) and alkaline Comet assay method were applied to determine the hOGG1 genetic polymorphisms and DNA damage response. A total of 80 participants were enrolled in this study, consisting of 40 radiation-exposed workers as a case group and 40 non-radiation workers as a control group.

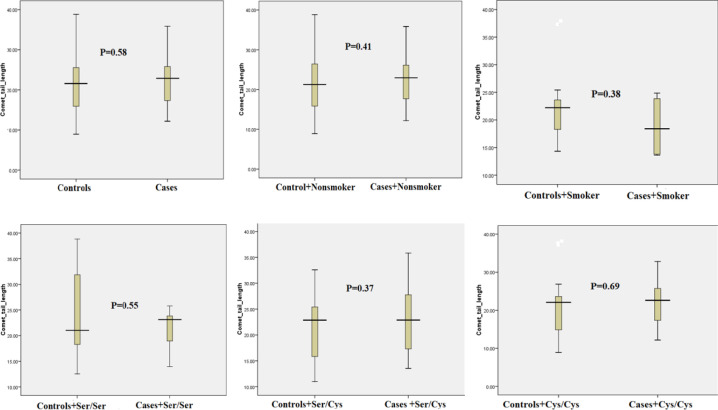
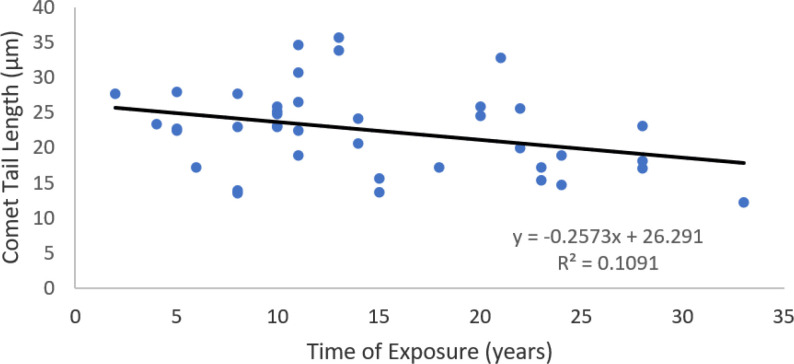
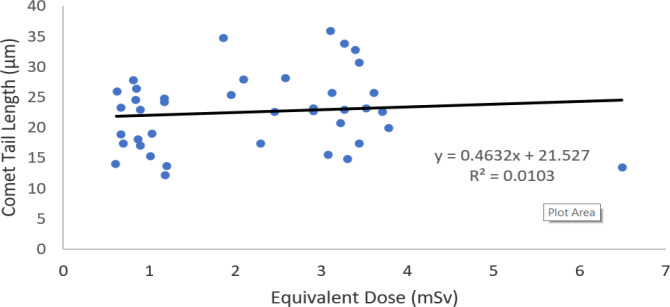
Result: The genotypes frequencies for controls were Ser/Ser (35%), Ser/Cys (32.5%), and Cys/Cys (32.5%), with frequencies of alleles being 326Ser (0.52) and 326Cys (0.48), whereas the genotypes frequencies for radiation-exposed workers (cases group) were Ser/Ser (17.5%), Ser/Cys (57.5%), and Cys/Cys (25%), with frequencies of alleles being 326Ser (0.46) and 326Cys (0.54). The results indicated that DNA damage response were not significantly higher in the exposed workers than in controls (22.55 ± 6.02 versus 21.72 ± 7.14; P=0.58). The time of exposure has a significantly negative correlation with comet tail length value among radiation workers. In addition, it was found that the DNA damage response was strongly associated with age and time of exposure with a decrease of 0.6 percent (P-value: 0.008) and 0.58 percent (P-value: 0.009), respectively. Whereas gender, smoking habit, and equivalent dose were not correlated with DNA damage.

Conclusion: The single-nucleotide polymorphism of hOGG1 exon 7 (rs1052133) demonstrated no association with the extent of DNA damage in radiation-exposed workers.

Keywords: Alkaline comet assay; DNA damage; Genetic polymorphism; Radiation-exposed workers; hOGG1 exon 7.


Figures

Figure 1
Figure 1
A. The original fragment of PCR product before restriction (168 bp). B. The digestion of PCR product with MspI generates two bands of 168 and 142 bp indicate Ser/Cys (lane 1), single band of 142 indicates Cys/Cys (lane 2 and 4), single band of 168 indicates Ser/Ser (lane 3 and 5), while lane M is DNA ladder/marker
Figure 2
Figure 2
DNA Damage Response (Comet Tail Length) of Controls and Radiation-Exposed Workers According to Smoking Habit, Ser/Ser, Ser/Cys, and Cys/Cys Genotypes. Box plots of comet tail length were measured in all of participants by alkaline comet assay. The box delimits the 25th and 75th percentiles and the horizontal-thick line inside the box indicate the median. The mean expression values are indicated with squares. The vertical-thick lines indicate the interval between the 5th and 95th percentiles. Significant differences were calculated using an independent sample T-test
Figure 3
Figure 3
The Epifluorescence Microscopy Visualization of DNA Damage Using Alkaline Comet Assay. The comet head contains undamaged DNA and the comet tail contains damaged DNA fragments. The damage DNA fragments migrate from head to tail during electrophoresis process through the gel matrix
Figure 4
Figure 4
The Relationship between DNA Damage Response, assessed as Comet Tail Length (µm), and Time of Exposure (Years). The thick line is the result of linear regression analysis of the data. β = -0.33, P-value = 0.037
Figure 5
Figure 5
The Relationship between DNA Damage Response, assessed as Comet Tail Length (µm), and Equivalent Dose (mSv). The thick line is the result of linear regression analysis of the data. β = 0.101 , P-value = 0.53

Similar articles

Cited by

References

    1. Alanazi M, Pathan AAK, Shaik JP, et al. The hOGG1 Ser326Cys gene polymorphism and breast cancer risk in Saudi population. Pathol Oncol Res. 2017;23:525–35. - PubMed
    1. Amador MA, Cavalcante GC, Santos NP, et al. Distribution of allelic and genotypic frequencies of IL1A, IL4, NFKB1 and PAR1 variants in Native American, African, European and Brazilian populations. BMC Res Notes. 2016;9:101–8. - PMC - PubMed
    1. Azevedo AP, Silva SN, De Lima JP, et al. DNA repair genes polymorphisms and genetic susceptibility to Philadelphia-negative myeloproliferative neoplasms in a Portuguese population: The role of base excision repair genes polymorphisms. Oncol Lett. 2017;13:4641–50. - PMC - PubMed
    1. Berrington de Gonzalez A, Wong J, Kleinerman R, et al. Risk of second cancers according to radiation therapy technique and modality in prostate cancer survivors. Int J Radiat Oncol Biol Phys. 2015;91:295–302. - PMC - PubMed
    1. Bhattacharyya A, Chattopadhyay R, Mitra S, Crowe SE. Oxidative stress: an essential factor in the pathogenesis of gastrointestinal mucosal diseases. Physiol Rev. 2014;94:329–54. - PMC - PubMed