. 2023 Jan 3;120(1):e2213198120.
doi: 10.1073/pnas.2213198120. Epub 2022 Dec 29.

Election cycles and global religious intolerance

Affiliations

Election cycles and global religious intolerance

Gareth Nellis. Proc Natl Acad Sci U S A. .

Abstract

Mass elections are key mechanisms for collective decision-making. But they are also blamed for creating intergroup enmity, particularly while they are underway; politicians use polarizing campaign strategies, and losing sides feel resentful and marginalized after results are announced. I investigate the impact of election proximity-that is, closeness to elections in time-on social cleavages related to religion, a salient form of group identity worldwide. Integrating data from ∼1.2 million respondents across 25 cross-country survey series, I find no evidence that people interviewed shortly before or after national elections are more likely to express negative attitudes toward religious outgroups than those interviewed at other times. Subgroup analysis reveals little heterogeneity, including by levels of political competition. Generalized social trust, too, is unaffected by election calendars. Elections may not pose as great a risk to social cohesion as is commonly feared.

Keywords: elections; intolerance; political science; prejudice; religion.


Conflict of interest statement

The author declares no conflict of interest.

Figures

Fig. 1.
Fig. 1.
Average unweighted survey responses to questions about intolerance toward religious outgroups across 25 multinational survey series. Note, surveys pose different questions about religious intolerance across countries, as well as within countries over time; further, the number and timing of surveys varies cross-nationally. Panel A plots intolerance rates for the 30 countries with the largest share of intolerant responses; the Years column provides the range of years covered by the integrated surveys for a given country. Panel B maps average intolerance, split into terciles, by country. Panel C shows average intolerance rates by question-type in the full sample.
Fig. 2.
Fig. 2.
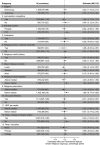
Coefficient plots of estimates from nine weighted least-squares regressions. Each regression employs a differently specified treatment variable, described in the panel titles and on the vertical axis. The unit of analysis is the respondent/question-item. Models include country, question-type, and question-target fixed effects. Only responses for which the survey date can be accurately pinpointed to within a 6-mo time bracket are included. Observations are weighted such that each country/election cycle contributes equally in estimation. 95% confidence intervals are based on robust standard errors clustered by country/election cycle. The number of observations, with the number of countries in parentheses, is displayed on the right-hand side of the plot.
Fig. 3.
Fig. 3.
Subgroup effects. Estimates from weighted least-squares regressions that include country, question-type, and question-target fixed effects. The treatment variable is an indicator for whether the respondent was surveyed within 6 mo prior to a national election. The unit of analysis is the respondent/question-item. Only responses for which the survey date can be accurately pinpointed to within a 6-mo time bracket are included. Observations are weighted such that each country/election cycle contributes equally in estimation. 95% confidence intervals are based on robust standard errors clustered by country/election cycle.
Fig. 4.
Fig. 4.
Coefficient plots of four weighted least-squares regressions that include country fixed effects. The treatment variable is an indicator of whether the respondent was surveyed within 6 mo prior to a national election. The unit of analysis is the respondent. Only responses for which the survey date can be accurately pinpointed to within a 6-mo time bracket are included. Observations are weighted such that each country/election cycle contributes equally in estimation. 95% confidence intervals are based on robust standard errors clustered by country/election cycle. The number of observations, with the number of countries in parentheses, is displayed on the right-hand side of the plot.

References

    1. Mill J. S., Considerations on Representative Government (Parker, Son, and Bourn, 1861).
    1. Schumpeter J. A., Capitalism, Socialism and Democracy (Harper and Brothers, 1942).
    1. Fukuyama F., Political Order and Political Decay: From the Industrial Revolution to the Globalization of Democracy (Farrar, Straus and Giroux, 2014).
    1. Matanock A. M., Electing Peace: From Civil Conflict to Political Participation (Cambridge University Press, 2017).
    1. Riker W. H., The Theory of Political Coalitions (Yale University Press, 1962).

LinkOut - more resources