. 2023 May 11;141(19):2372-2389.
doi: 10.1182/blood.2022018428.

DNA polymerase θ protects leukemia cells from metabolically induced DNA damage

Affiliations

DNA polymerase θ protects leukemia cells from metabolically induced DNA damage

Umeshkumar Vekariya et al. Blood. .

Abstract

Leukemia cells accumulate DNA damage, but altered DNA repair mechanisms protect them from apoptosis. We showed here that formaldehyde generated by serine/1-carbon cycle metabolism contributed to the accumulation of toxic DNA-protein crosslinks (DPCs) in leukemia cells, especially in driver clones harboring oncogenic tyrosine kinases (OTKs: FLT3(internal tandem duplication [ITD]), JAK2(V617F), BCR-ABL1). To counteract this effect, OTKs enhanced the expression of DNA polymerase theta (POLθ) via ERK1/2 serine/threonine kinase-dependent inhibition of c-CBL E3 ligase-mediated ubiquitination of POLθ and its proteasomal degradation. Overexpression of POLθ in OTK-positive cells resulted in the efficient repair of DPC-containing DNA double-strand breaks by POLθ-mediated end-joining. The transforming activities of OTKs and other leukemia-inducing oncogenes, especially of those causing the inhibition of BRCA1/2-mediated homologous recombination with and without concomitant inhibition of DNA-PK-dependent nonhomologous end-joining, was abrogated in Polq-/- murine bone marrow cells. Genetic and pharmacological targeting of POLθ polymerase and helicase activities revealed that both activities are promising targets in leukemia cells. Moreover, OTK inhibitors or DPC-inducing drug etoposide enhanced the antileukemia effect of POLθ inhibitor in vitro and in vivo. In conclusion, we demonstrated that POLθ plays an essential role in protecting leukemia cells from metabolically induced toxic DNA lesions triggered by formaldehyde, and it can be targeted to achieve a therapeutic effect.


Conflict of interest statement

Conflict-of-interest disclosure: H.F.F. serves on the advisory board of Jazz Pharmaceuticals and Incyte. R.T.P. is a co-founder and chief scientific officer of Recombination Therapeutics, LLC. M.S.T. received research funding from AbbVie, Orsenix, BioSight, Glycomimetics, Rafael Pharmaceuticals, and Amgen; is on advisory boards for AbbVie, Daiichi-Sankyo, Orsenix, KAHR, Jazz Pharma, Roche, Novartis, Innate Pharmaceuticals, Kura, Syros Pharmaceuticals, Ipsen Biopharmaceuticals, and Cellularity; and received royalties from UpToDate, the Data and Safety Monitoring Board (DSMB) HOVON protocol Ho156, and the Adjudication Committee Foghorn Therapeutics protocol FHD-286. R.L.L. is on the supervisory board of Qiagen; is a scientific advisor to Imago, Mission Bio, Zentalis, Ajax, Auron, Prelude, C4 Therapeutics and Isoplexis; receives research support from Ajax, Zentalis, and Abbvie; has consulted for Incyte, Janssen, and Astra Zeneca; and has received honoraria from Astra Zeneca for invited lectures. The remaining authors declare no competing financial interests.

Figures

None
Graphical abstract
Figure 1.
Figure 1.
POLθ is required to resolve DPCs caused by formaldehyde generated via serine/1C cycle metabolism in OTKs-positive hematological malignancies. (A) Mean ± SD of DPCs in the indicated cell lines; ∗P < .05 using t test. (B) Mean ± SD of DPCs in: (left) 32Dcl3 parental cells (P) and cells expressing FLT3(ITD), JAK2(V617F), and BCR-ABL1, and (right) human Lin-CD34+ primary cells from leukemias expressing FLT3(ITD), JAK2(V617F), and BCR-ABL1 and from healthy donors. ∗P < .05 when compared with P/N using t test. (C) Mean formaldehyde (FA) levels ± SD in 32Dcl3 parental cells (P) and cells expressing FLT3(ITD), JAK2(V617F), and BCR-ABL1. ∗P < .05 when compared with P using t test. (D) Mean ± SD of FA levels in FLT3(ITD) 32Dcl3 cells cultured in standard medium (Reg) and in medium without glucose, serine, and glycine (no GSG); ∗P < .05 using t test when compared with corresponding Reg. (E) Mean ± SD of FA levels, DPCs, and % of γ-H2AX–positive cells in FLT3(ITD) 32Dcl3 cells cultured in glucose + 5× serine + 5× glycine high (high GSG) medium and in medium without glucose, serine, and glycine (no GSG). ∗P < .05 using t test. (F) Mean ± SD of FA levels and DPCs in FLT3(ITD) 32Dcl3 cells cultured in glucose-supplemented serine + glycine–free medium and treated or not with WQ-2101; ∗P < .05 using t test. (G) Mean ± SD of FA levels and DPCs from 3 experiments in FLT3(ITD) 32Dcl3 cells cultured in standard medium and treated or not with SHIN1. ∗P < .05 using t test. (H) Lin-cKit+ mBMCs from Polq+/+ and Polq−/− mice (blue and orange, respectively) were cultured in high GSG and/or no GSG medium. Results represent mean ± SD of FA levels and DPCs and proliferation rate; ∗P < .05 when compared with corresponding high GSG using t test. (I) Clonogenic activity of Lin-cKit+ BMCs from Polq+/+ and Polq−/− mice treated with the indicated concentrations of formaldehyde for 4 hours after plating in methylcellulose. Results represent the mean percentage of colonies ± SD when compared with untreated counterparts. (J) Lin-cKit+ mBMCs from Polq+/+ and Polq−/− mice were untreated (0) and treated with 400 nM formaldehyde for 24 and 48 hours. Results represent mean ± SD of DPCs and tail DNA percentage from the neutral comet assay. ∗P ≤ .001 when compared with Polq+/+ counterpart using t test. (K) Lin-cKit+ mBMCs from Flt3ITD;Polq−/− (orange) and Flt3ITD;Polq+/+ (blue) mice were cultured in high GSG and/or no GSG medium. Results represent mean ± SD of FA levels and DPCs and proliferation rate; ∗P < .05 when compared with corresponding high GSG using t test. (L) Sensitivity of FLT3(ITD) 32Dcl3 cells to 25 μM ART558 in high GSG and no GSG medium. Results represent the mean percentage of colonies ± SD when compared with untreated counterparts; ∗P < .05 using t test. (M) A scheme illustrating functional pathway where serine/1C cycle–produced formaldehyde induces DPCs, which are likely repaired by POLθ-mediated TMEJ. SD, standard deviation.
Figure 1.
Figure 1.
POLθ is required to resolve DPCs caused by formaldehyde generated via serine/1C cycle metabolism in OTKs-positive hematological malignancies. (A) Mean ± SD of DPCs in the indicated cell lines; ∗P < .05 using t test. (B) Mean ± SD of DPCs in: (left) 32Dcl3 parental cells (P) and cells expressing FLT3(ITD), JAK2(V617F), and BCR-ABL1, and (right) human Lin-CD34+ primary cells from leukemias expressing FLT3(ITD), JAK2(V617F), and BCR-ABL1 and from healthy donors. ∗P < .05 when compared with P/N using t test. (C) Mean formaldehyde (FA) levels ± SD in 32Dcl3 parental cells (P) and cells expressing FLT3(ITD), JAK2(V617F), and BCR-ABL1. ∗P < .05 when compared with P using t test. (D) Mean ± SD of FA levels in FLT3(ITD) 32Dcl3 cells cultured in standard medium (Reg) and in medium without glucose, serine, and glycine (no GSG); ∗P < .05 using t test when compared with corresponding Reg. (E) Mean ± SD of FA levels, DPCs, and % of γ-H2AX–positive cells in FLT3(ITD) 32Dcl3 cells cultured in glucose + 5× serine + 5× glycine high (high GSG) medium and in medium without glucose, serine, and glycine (no GSG). ∗P < .05 using t test. (F) Mean ± SD of FA levels and DPCs in FLT3(ITD) 32Dcl3 cells cultured in glucose-supplemented serine + glycine–free medium and treated or not with WQ-2101; ∗P < .05 using t test. (G) Mean ± SD of FA levels and DPCs from 3 experiments in FLT3(ITD) 32Dcl3 cells cultured in standard medium and treated or not with SHIN1. ∗P < .05 using t test. (H) Lin-cKit+ mBMCs from Polq+/+ and Polq−/− mice (blue and orange, respectively) were cultured in high GSG and/or no GSG medium. Results represent mean ± SD of FA levels and DPCs and proliferation rate; ∗P < .05 when compared with corresponding high GSG using t test. (I) Clonogenic activity of Lin-cKit+ BMCs from Polq+/+ and Polq−/− mice treated with the indicated concentrations of formaldehyde for 4 hours after plating in methylcellulose. Results represent the mean percentage of colonies ± SD when compared with untreated counterparts. (J) Lin-cKit+ mBMCs from Polq+/+ and Polq−/− mice were untreated (0) and treated with 400 nM formaldehyde for 24 and 48 hours. Results represent mean ± SD of DPCs and tail DNA percentage from the neutral comet assay. ∗P ≤ .001 when compared with Polq+/+ counterpart using t test. (K) Lin-cKit+ mBMCs from Flt3ITD;Polq−/− (orange) and Flt3ITD;Polq+/+ (blue) mice were cultured in high GSG and/or no GSG medium. Results represent mean ± SD of FA levels and DPCs and proliferation rate; ∗P < .05 when compared with corresponding high GSG using t test. (L) Sensitivity of FLT3(ITD) 32Dcl3 cells to 25 μM ART558 in high GSG and no GSG medium. Results represent the mean percentage of colonies ± SD when compared with untreated counterparts; ∗P < .05 using t test. (M) A scheme illustrating functional pathway where serine/1C cycle–produced formaldehyde induces DPCs, which are likely repaired by POLθ-mediated TMEJ. SD, standard deviation.
Figure 2.
Figure 2.
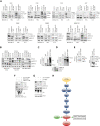
OTKs enhance the expression of POLθ. (A-C) Western analysis of POLθ expression in nuclear lysates from Lin-CD34+ cells from healthy donors (normal) and patients with FLT3(ITD)-positive AML, Jak2(V617F)-positive MPN (PV, ET, and PMF), and BCR-ABL1–positive CML (CP and BP) (A) and parental (32Dcl3, BaF3) cells and these expressing the indicated oncogenes (B). Lamin served as loading control. (C) Western blot of indicated proteins in total cell lysates from cells expressing OTKs and treated with specific TKi (FLT3 inhibitor AC220, JAK1/2 inhibitor ruxolitinib, and ABL1 inhibitor imatinib). (D) CHX chase assay: nuclear cell lysates obtained from indicated cells after CHX treatment (hours) were analyzed using western blot to detect POLθ and lamin (loading control). (E) Western blot of indicated proteins in total cell lysates from cells expressing OTKs and treated with specific TKi (FLT3 inhibitor AC220, JAK1/2 inhibitor ruxolitinib, ABL1 inhibitor imatinib) and proteasome inhibitor MG132. BP, blast phase; CHX, cycloheximide; CP, chronic blast; ET, essential thrombocythemia; PMF, primary myelofibrosis; PV, polycythemia vera.
Figure 3.
Figure 3.
OTKs→RAC→PI3K/PAK→AKT→RAF→MEK→ERK/c-CBL pathway enhances the expression of POLθ. (A) FLT3(ITD)-positive MOLM14 cells, JAK2(V617F)-positive HEL cells, and BCR-ABL1–positive 32Dcl3 cells, , , , , , , , , , , were treated with PI3K inhibitor buparlisib, AKT inhibitor perifosine, RAF1 inhibitor LY3009124, RAC inhibitor NSC23766, MEK inhibitor midrametinib, ERK inhibitor SCH772984, PAK1/2 inhibitor IPA-3 after western analysis of the total cell lysates. (B) Western blot of total cell lysates from 32D-FLT3(ITD), BAF3-JAK2(V617F), and 32D-BCR-ABL1 cells untreated (control) and treated with MG132 and/or SCH772984. (C-G) Total cell lysates were obtained from 32D-FLT3(ITD) cells treated with SCH772984 or diluent (control). (C) Western blot detecting ubiquitinated proteins in anti-POLθ immunoprecipitates. (D) Western blot detecting POLθ in antiubiquitin (Ub) immunoprecipitates. (E) Western blot detecting CBL proteins in anti-POLθ immunoprecipitates (IP:POLθ) and in total cell lysates (input) using pan-CBL and c-CBL and CBL-b specific antibodies. (F) Western blot of total cell lysates from 32D-FLT3(ITD) cells treated or not with SCH772984 and c-CBL siRNA or scrambled RNA. (G) Western blot of total cell lysates from 32D-FLT3(ITD cells treated or not with SCH772984 and pYTPEP CBL inhibitory peptide. (H) A diagram illustrating OTK-induced signaling pathways responsible for overexpression of POLθ.
Figure 4.
Figure 4.
OTKs-positive cells stimulate DNA resection and TMEJ/MMEJ. (A-B) BaF3 and 32D parental cells and the cells expressing JAK2(V617F), FLT3(ITD), or BCR-ABL1 were mock-treated or irradiated (10 Gy). (A) Immunofluorescence against BrdU and PCNA is shown. (B) The data show the mean ± SD; ∗P ≤ .05, ∗∗P ≤ .0001 using Mann-Whitney U test. (C) DPC-TMEJ assay and (D) pBABE-MMEJ assay. DPC-TMEJ or pBABE-MMEJ reporters and DsRed plasmid were transiently transfected in to parental 32Dcl3 cells (P) and cells expressing FLT3(ITD), JAK2(V617F), and BCR-ABL1 followed by flow cytometry. Results represent the mean percentage of GFP+ cells in DsRed+ population ± SD. ∗P < .05 when compared with P using t test. BrdU, 5-bromo-2′-deoxyuridine; SD, standard deviation.
Figure 5.
Figure 5.
POLθ promoted leukemogenesis of HR/D-NHEJ–proficient and HR/D-NHEJ–deficient cells. (A) Clonogenic activity of Lin-cKit+Polq−/− and Polq+/+ GFP+ bone marrow cells expressing GFP (normal) and the indicated oncogenes. Results represent mean ± SD number of colonies; ∗P < .05 when compared with Polq+/+ counterparts using t test. (B) Proliferation of Lin-cKit+ Polq−/− and Polq+/+ bone marrow cells expressing GFP (normal) and the indicated oncogenes. Results represent mean ± SD number of cells; ∗P < .05 using t test. (C) DSBs were assessed by neutral comet assay in Polq+/+ (blue bars) and Polq−/− (orange bars) Lin- mBMCs expressing GFP (normal) and the indicated oncogenes. Results represent mean olive tail moment ± SD; ∗P < .05 when compared with Polq+/+ counterparts using t test. (D) Mean ± SD number of colonies from Lin- bone marrow cells harvested from Flt3ITD;Polq−/− (n=2) and Flt3ITD;Polq+/+ (n=4) mice; ∗P < .05 when compared with Polq+/+ counterparts using t test. (E) Engraftment of BCR-ABL1–positive Polq+/+ and Polq−/− cells in sublethally irradiated syngeneic mice. Results represent the mean percentage ± SD of GFP+ cells detected 4 weeks after transplantation in 10 mice per group. ∗P < .05 using t test. SD, standard deviation.
Figure 5.
Figure 5.
POLθ promoted leukemogenesis of HR/D-NHEJ–proficient and HR/D-NHEJ–deficient cells. (A) Clonogenic activity of Lin-cKit+Polq−/− and Polq+/+ GFP+ bone marrow cells expressing GFP (normal) and the indicated oncogenes. Results represent mean ± SD number of colonies; ∗P < .05 when compared with Polq+/+ counterparts using t test. (B) Proliferation of Lin-cKit+ Polq−/− and Polq+/+ bone marrow cells expressing GFP (normal) and the indicated oncogenes. Results represent mean ± SD number of cells; ∗P < .05 using t test. (C) DSBs were assessed by neutral comet assay in Polq+/+ (blue bars) and Polq−/− (orange bars) Lin- mBMCs expressing GFP (normal) and the indicated oncogenes. Results represent mean olive tail moment ± SD; ∗P < .05 when compared with Polq+/+ counterparts using t test. (D) Mean ± SD number of colonies from Lin- bone marrow cells harvested from Flt3ITD;Polq−/− (n=2) and Flt3ITD;Polq+/+ (n=4) mice; ∗P < .05 when compared with Polq+/+ counterparts using t test. (E) Engraftment of BCR-ABL1–positive Polq+/+ and Polq−/− cells in sublethally irradiated syngeneic mice. Results represent the mean percentage ± SD of GFP+ cells detected 4 weeks after transplantation in 10 mice per group. ∗P < .05 using t test. SD, standard deviation.
Figure 6.
Figure 6.
Genetic and biochemical targeting of POLθ exerted antileukemia effect in HR-deficient and HR-proficient leukemias. (A) Representative anti-Flag flow cytometry profiles in Nalm6 (parental) and Nalm6(RAD54−/−) B-ALL cells infected with Flag-POLθ (D2230A+Y2231A) DNA polymerase–inactive mutant (orange), Flag- POLθ wild-type (blue), or GFP only (green). Geo mean ± SD of anti-Flag immunofluorescence is shown; ∗P < .001 when compared with wild-type using t test. (B) Results represent the percentage of colonies ± SD of GFP+ cells expressing POLθ (D2230A+Y2231A) mutant (orange) or POLθ wild-type (blue), when compared with cells expressing GFP only; ∗P < .01 using t test. (C) Results represent number of colonies ± SD from Lin-CD34+GFP+ BCR-ABL1–positive CML-CP and FLT3(ITD)-positive AML cells expressing POLθ (D2230A+Y2231A) mutant (orange) or POLθ wild-type (blue); ∗P < .01 using t test. (D) Representative anti-POLθ flow cytometry analyses showing expression of POLθ in GFP+ cells transduced with POLQ shRNA (orange) or scrambled RNA (blue). Results show Geo mean ± SD of anti-POLθ immunofluorescence; ∗P < .05 using t test. (E) Results represent the percentages of colonies ± SD from GFP+ cells transduced with POLQ shRNA (orange) and scrambled RNA (blue) when compared with cells expressing GFP only; ∗P < .01 using t test. (F) Results represent number of colonies ± SD from Lin-CD34+GFP+ BCR-ABL1–positive CML-CP and FLT3(ITD)-positive AML cells transduced with POLQ shRNA (orange) or scrambled RNA (blue); ∗P < .01 using t test. (G) Results represent the percentages of colonies ± SD from Lin-CD34+ cells isolated from FLT3(ITD)-positive AMLs (n = 3), FLT3(D835Y)-positive AML (n = 1), cKIT(D816V)-positive AML (n = 1), JAK2(V617F) MPN (n = 1), BCR-ABL1–positive CML-CP (n = 3), and normal healthy donors (n = 3) incubated with POLθi (ART558). (H-I) Cells from patients with Lin- AML were treated with ART558 for 6 days after SC-tDNAseq. (H) The fish plot reflects number of cells before (0 days) and 6 days after the treatment and the inferred clonal evolution pattern based on SC-tDNAseq data. (I) The phylogenic tree visualizes the predicted order of mutation acquisition and the proportion of subclones with a different combination of mutations in control and ART558-treated cells: ADO rate = 3.9%, FPR = 1.0%. ADO, allele dropout; FPR, false positive rate; SC-tDNAseq, single-cell targeted DNA sequencing; SD, standard deviation.
Figure 7.
Figure 7.
TKi enhanced the effect of POLθI against OTK-positive hematological malignancies. (A-C) Lin-CD34+ cells from FLT3(ITD)-positive AMLs (n = 3), JAK2(V617F)-positive MPN (n = 1), BCR-ABL1–positive CML-CPs (n = 3) and normal healthy donors (n = 3), and (D) mononuclear cells from Ph+ ALL (n = 3) and normal healthy donors (n = 3) were incubated with OTK-specific TKi (panel A, 10 nM FLT3 kinase inhibitor quizartinib; panel B, 25 nM JAK1/2 kinase inhibitor ruxolitinib; panels C,D, 1 μM ABL1 kinase inhibitor imatinib) and/or POLθi (25 μM ART558). Results represent the mean percentage of colonies ± SD compared with untreated controls (A,C), mean number of colonies ± SD (B), and mean percentage of living cells ± SD compared with untreated controls (D) ∗P < .05 when compared with individual treatments using two-tailed unpaired t test. (E) PLX treatment experimental diagram. (F) Sensitivity of Lin-CD34+ PLX patient cells to the indicated inhibitors. Results represent the mean percentage of colonies ± SD compared with untreated controls. P < .05 when compared with individual treatments using response additivity approach. (G) Mean number of hCD45+ AML cells ± SD in peripheral blood lymphocyte of PLX-bearing NRGS mice untreated (C) and treated with treated with quizartinib (Q), NVB (N), and the combination (Q + N). ∗P < .05 when compared with individual treatments using two-tailed unpaired t test. (H) Survival curves and MST of the mice. ∗P < .001 in comparison to quizartinib and NVB using Kaplan-Meier log-rank test. MST, median survival time; SD, standard deviation.

Comment in

References

    1. Hanahan D, Weinberg RA. Hallmarks of cancer: the next generation. Cell. 2011;144(5):646–674. - PubMed
    1. Inoue S, Li WY, Tseng A, et al. Mutant IDH1 downregulates ATM and alters DNA repair and sensitivity to DNA damage independent of TET2. Cancer Cell. 2016;30(2):337–348. - PMC - PubMed
    1. Sulkowski PL, Corso CD, Robinson ND, et al. 2-Hydroxyglutarate produced by neomorphic IDH mutations suppresses homologous recombination and induces PARP inhibitor sensitivity. Sci Transl Med. 2017;9(375):eaal2463. - PMC - PubMed
    1. Nagy K, Pollreisz F, Takáts Z, Vékey K. Atmospheric pressure chemical ionization mass spectrometry of aldehydes in biological matrices. Rapid Commun Mass Spectrom. 2004;18(20):2473–2478. - PubMed
    1. Luo W, Li H, Zhang Y, Ang CY. Determination of formaldehyde in blood plasma by high-performance liquid chromatography with fluorescence detection. J Chromatogr B Biomed Sci Appl. 2001;753:253–257. - PubMed

Publication types