. 2023 Jan 5;186(1):112-130.e20.
doi: 10.1016/j.cell.2022.11.030. Epub 2022 Dec 2.

SARS-CoV-2 replication in airway epithelia requires motile cilia and microvillar reprogramming

Affiliations

SARS-CoV-2 replication in airway epithelia requires motile cilia and microvillar reprogramming

Chien-Ting Wu et al. Cell. .

Abstract

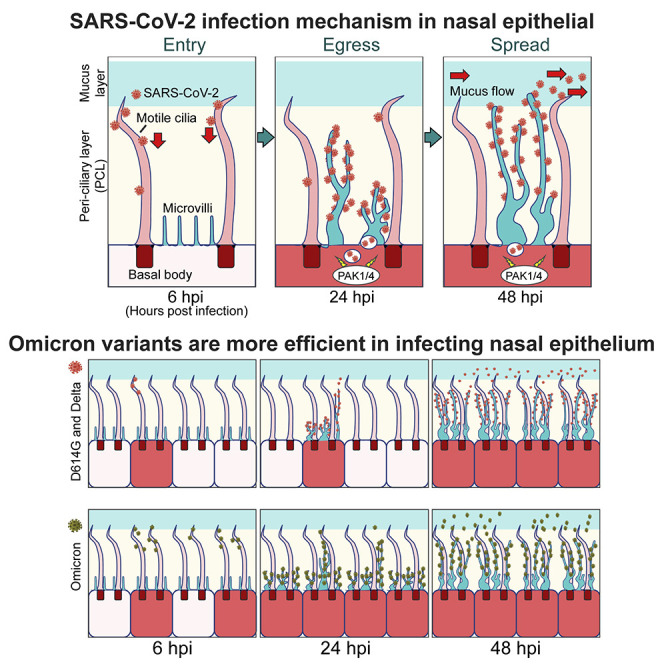
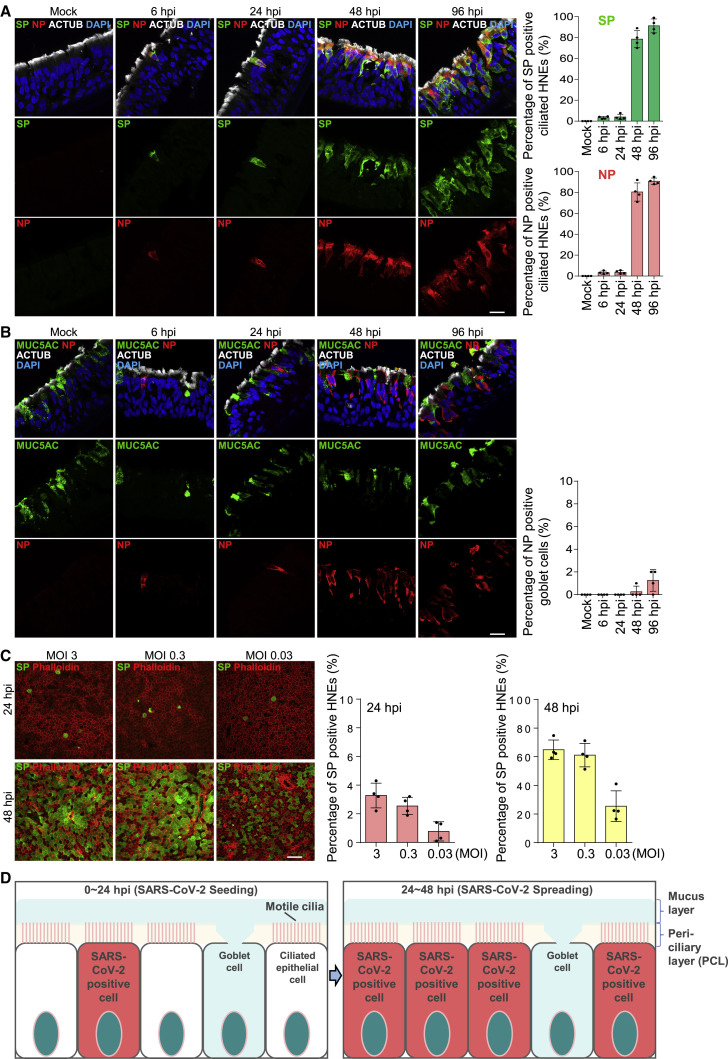
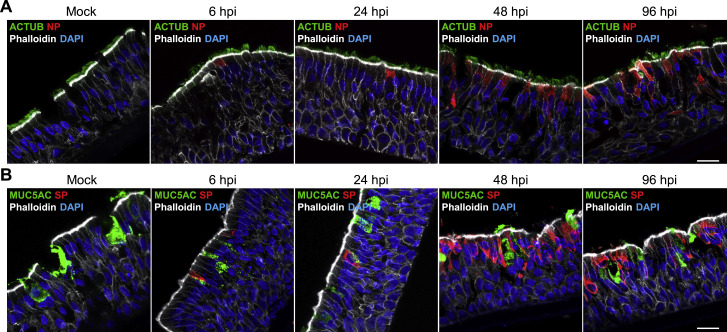
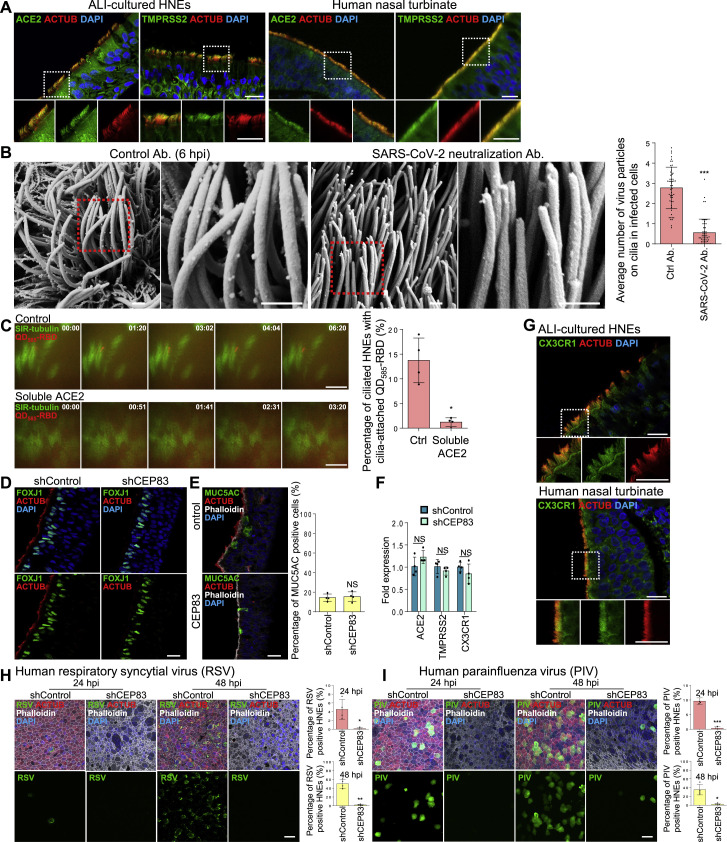
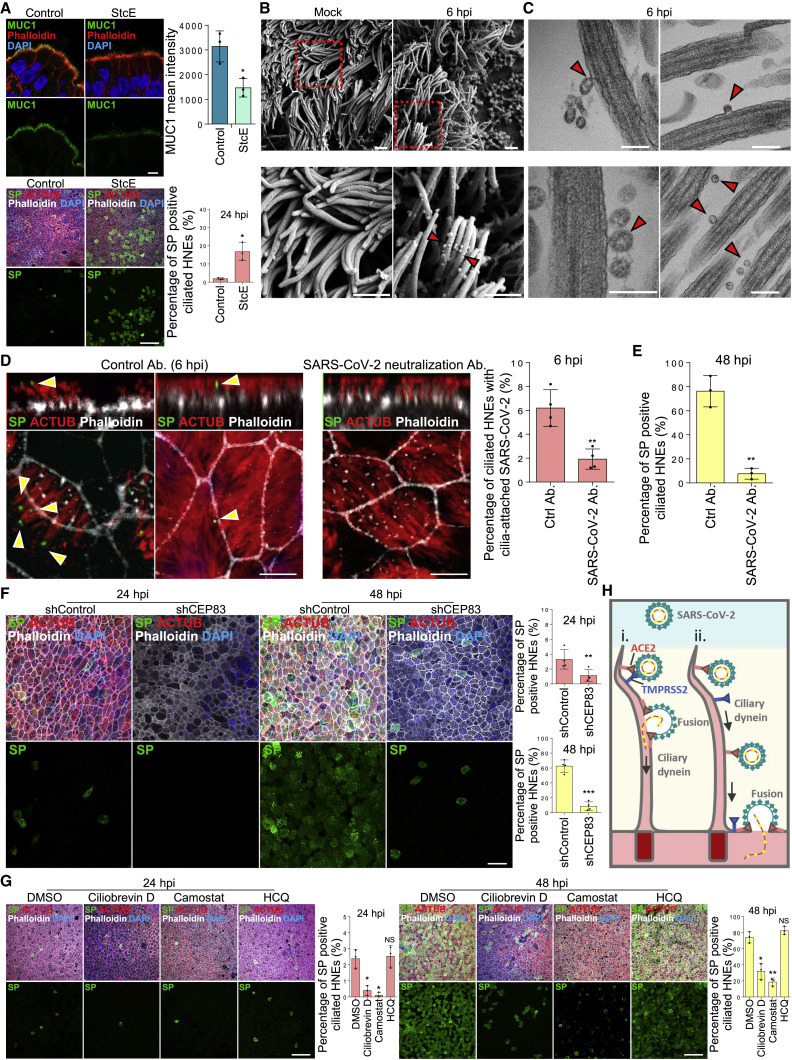
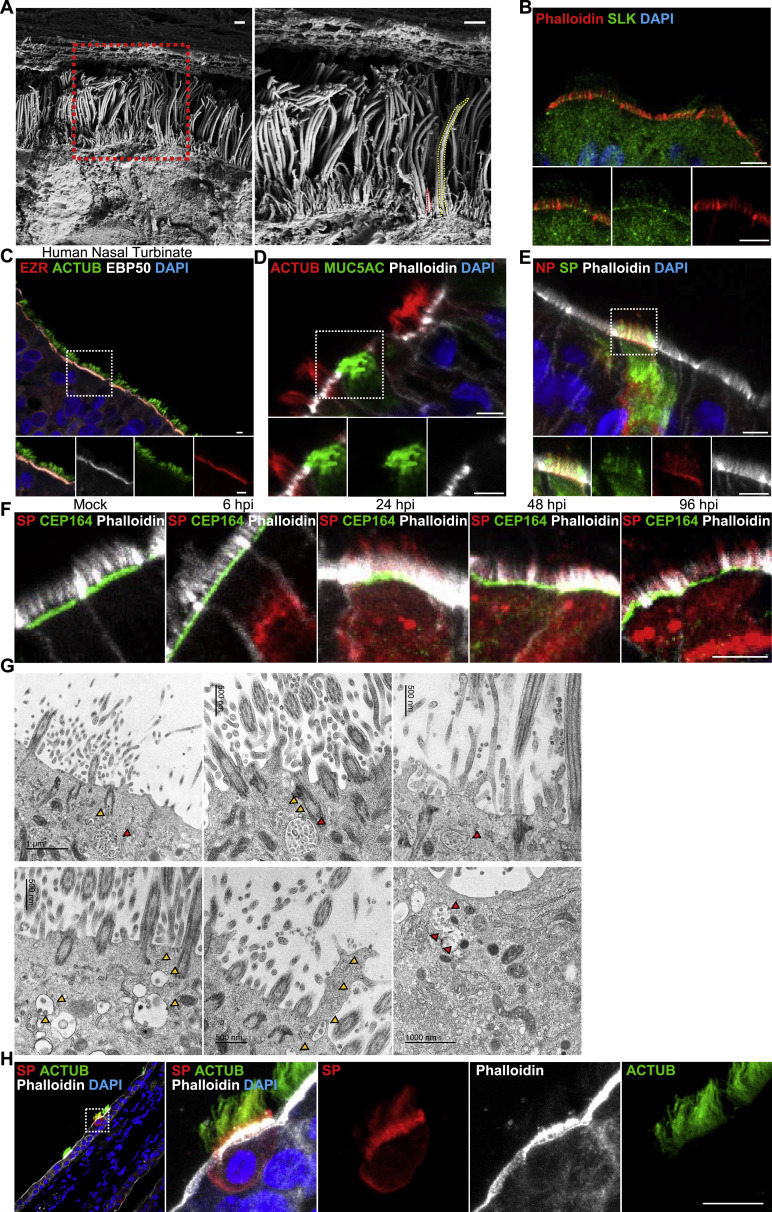
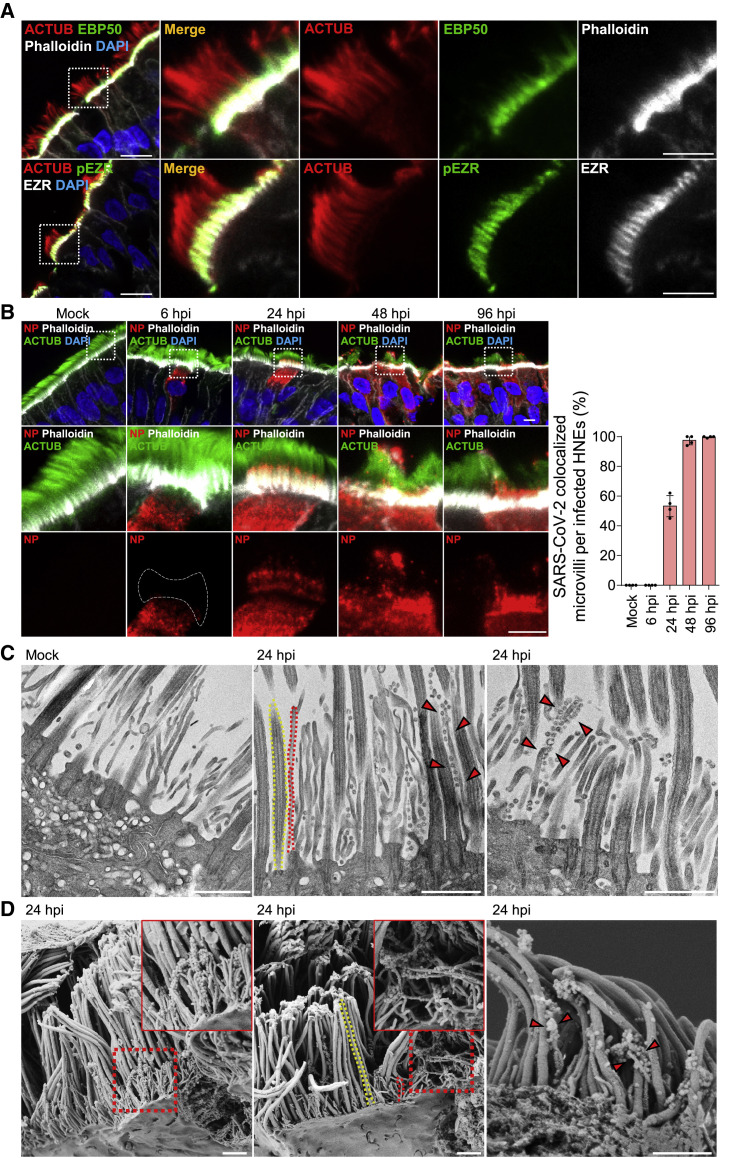
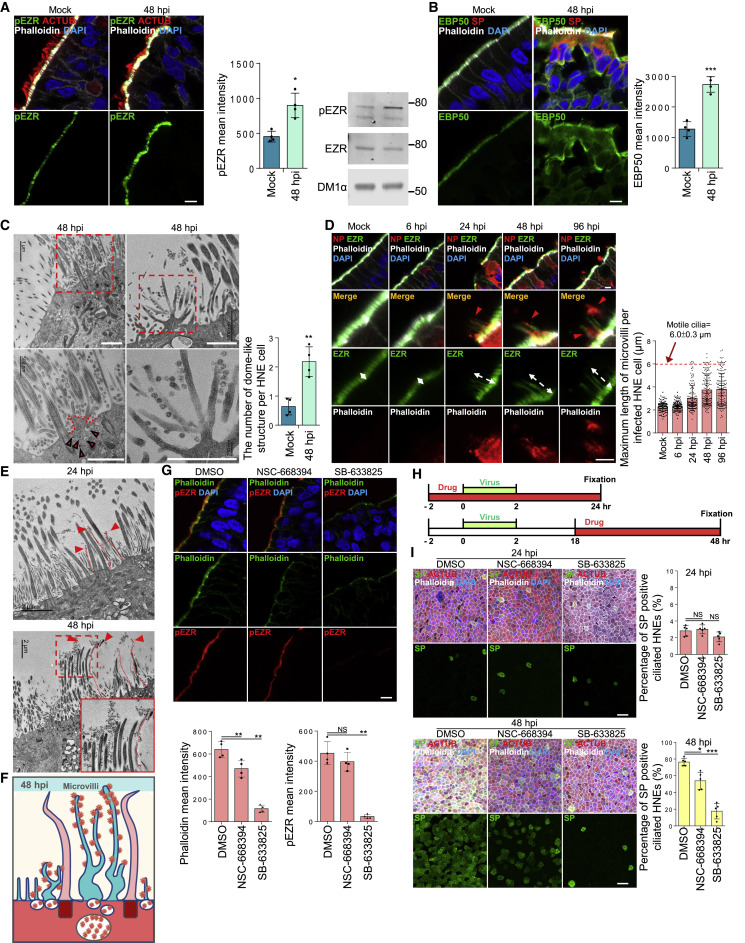
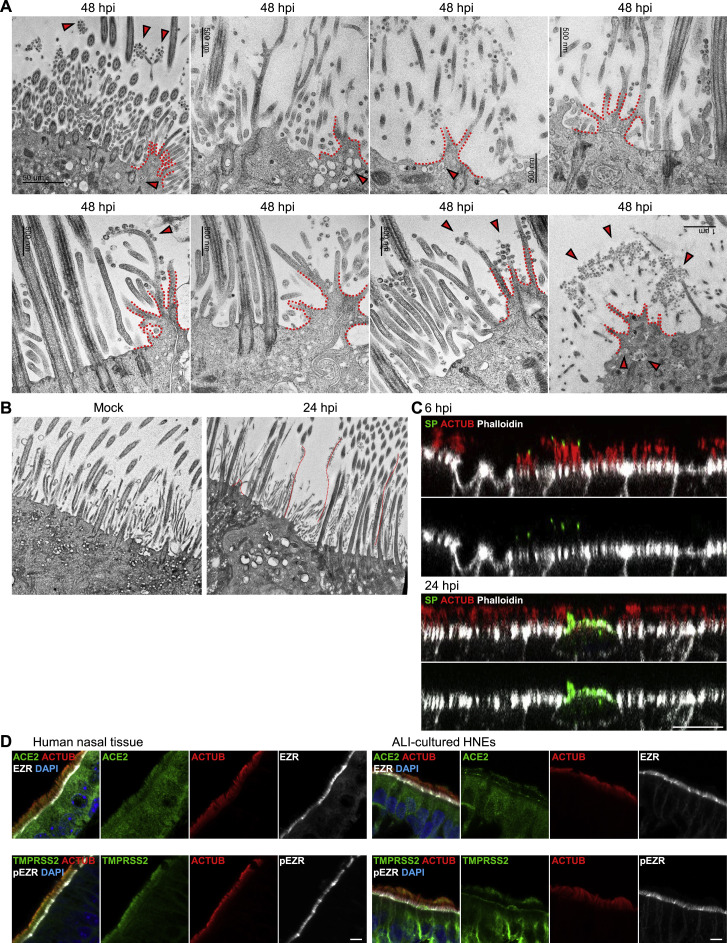
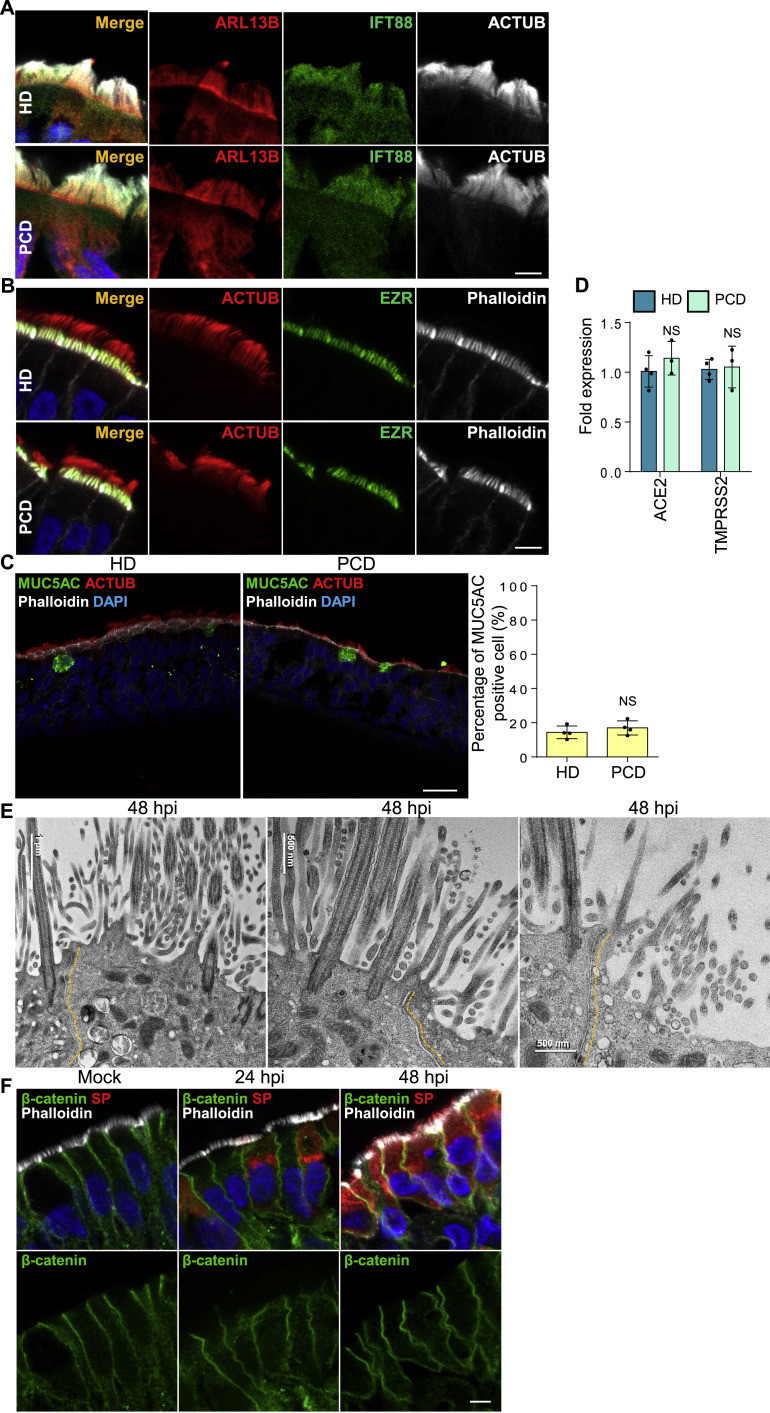
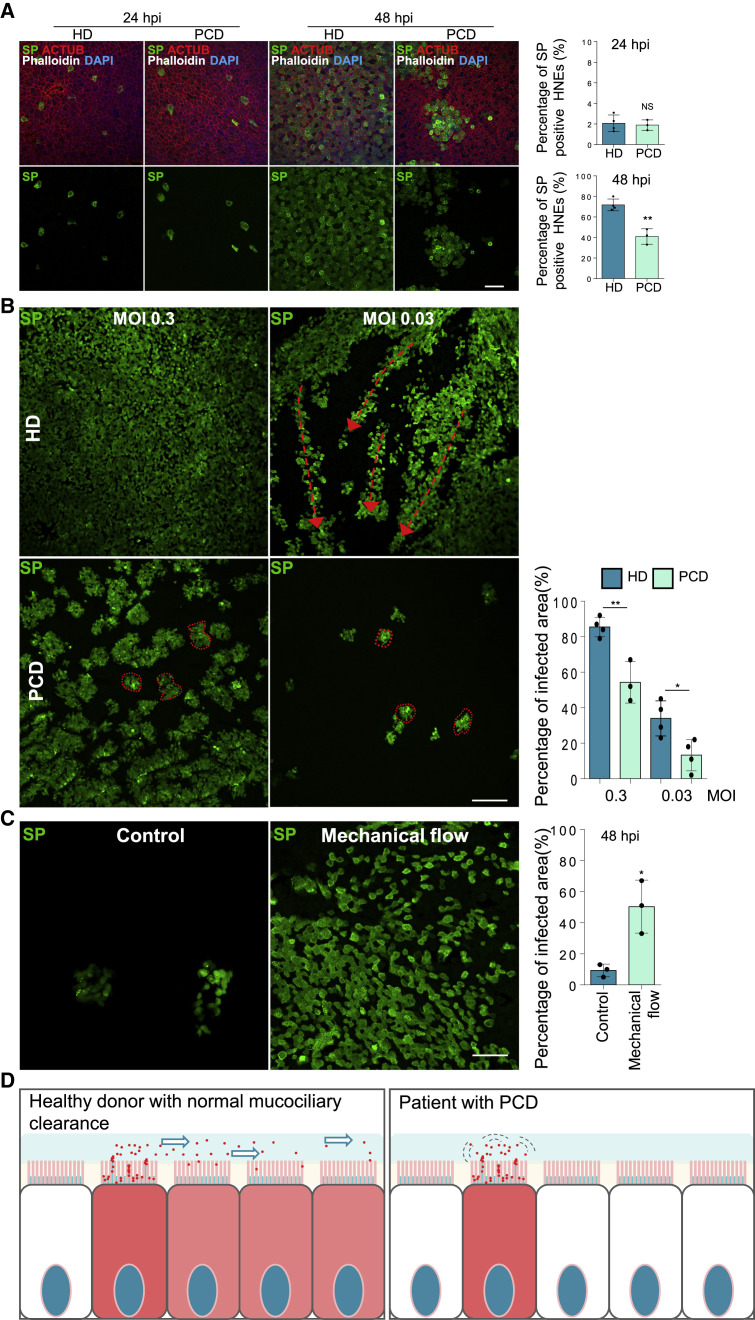
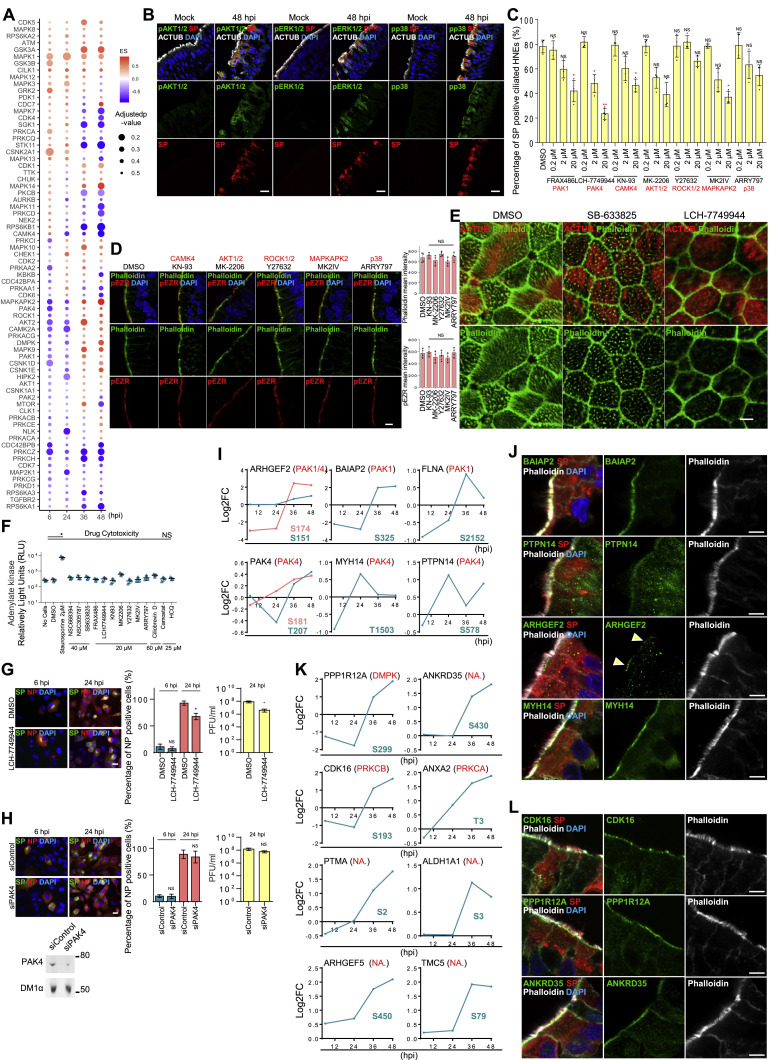
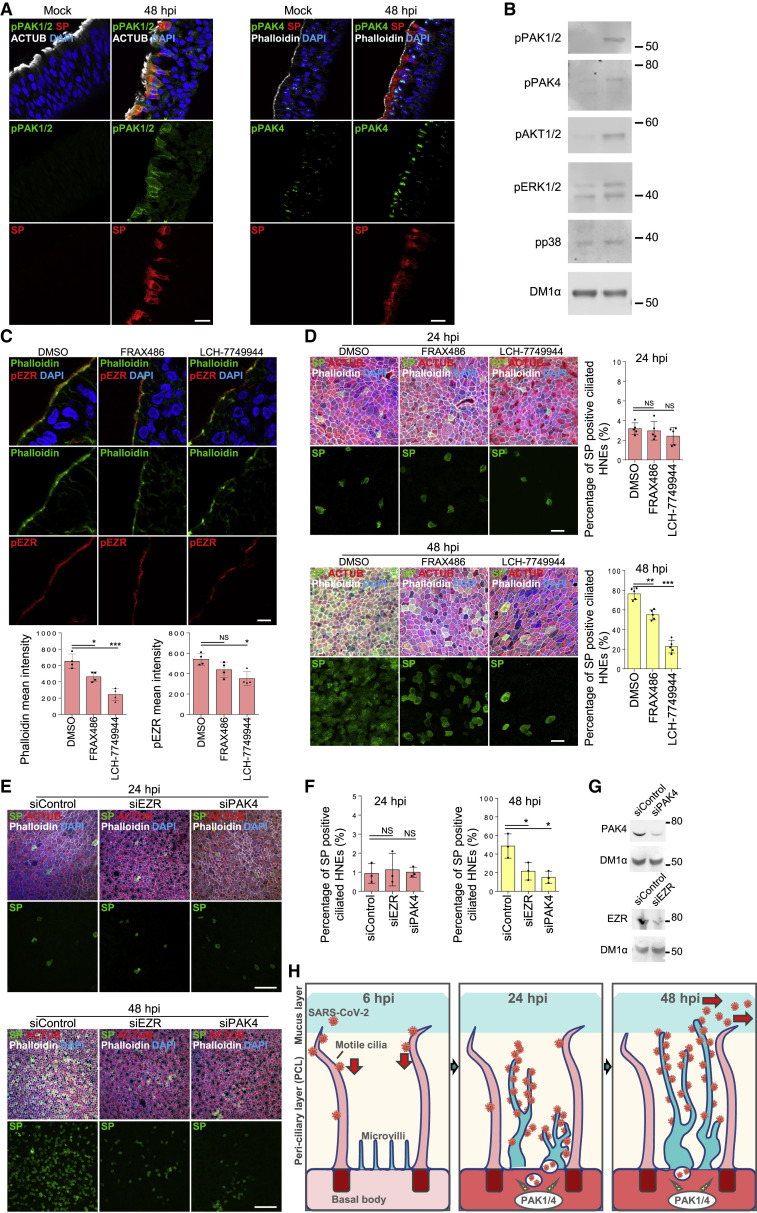
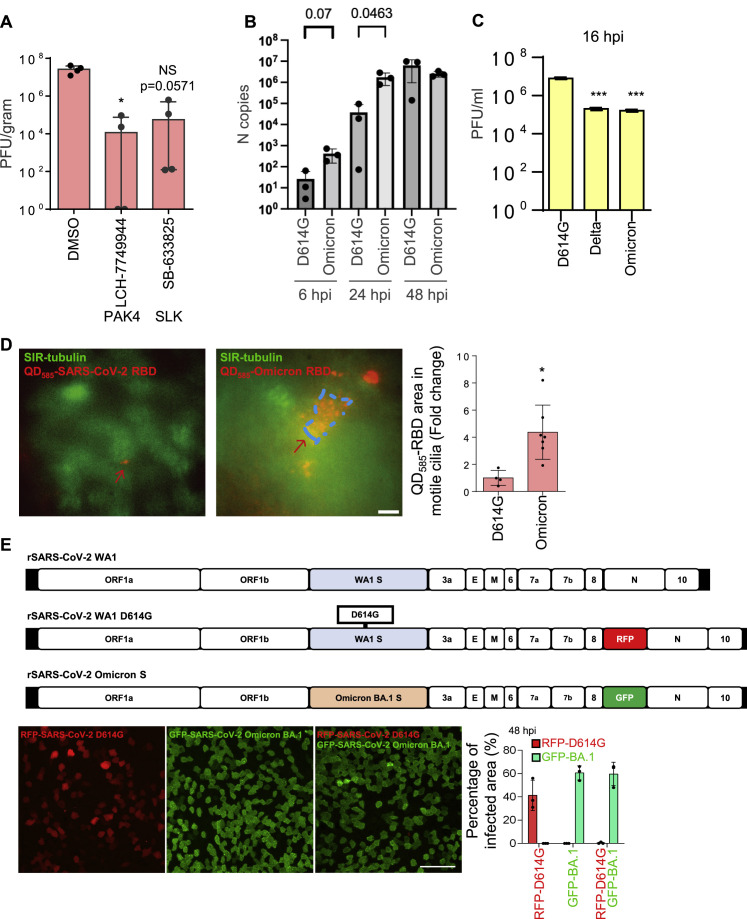
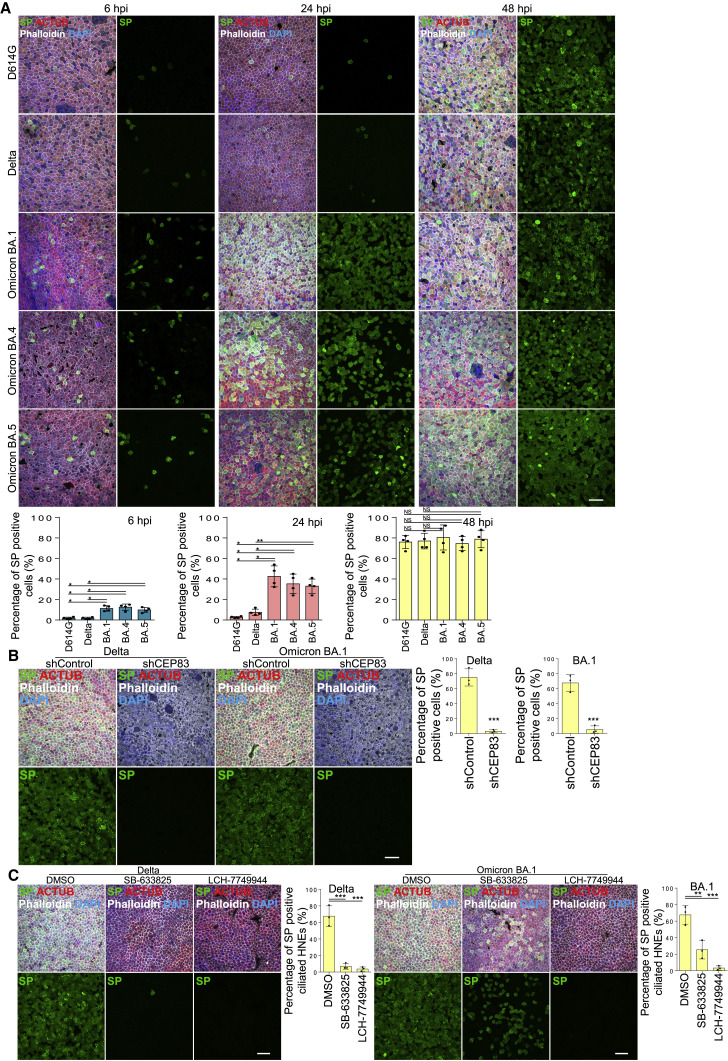
How SARS-CoV-2 penetrates the airway barrier of mucus and periciliary mucins to infect nasal epithelium remains unclear. Using primary nasal epithelial organoid cultures, we found that the virus attaches to motile cilia via the ACE2 receptor. SARS-CoV-2 traverses the mucus layer, using motile cilia as tracks to access the cell body. Depleting cilia blocks infection for SARS-CoV-2 and other respiratory viruses. SARS-CoV-2 progeny attach to airway microvilli 24 h post-infection and trigger formation of apically extended and highly branched microvilli that organize viral egress from the microvilli back into the mucus layer, supporting a model of virus dispersion throughout airway tissue via mucociliary transport. Phosphoproteomics and kinase inhibition reveal that microvillar remodeling is regulated by p21-activated kinases (PAK). Importantly, Omicron variants bind with higher affinity to motile cilia and show accelerated viral entry. Our work suggests that motile cilia, microvilli, and mucociliary-dependent mucus flow are critical for efficient virus replication in nasal epithelia.

Keywords: COVID-19; SARS-CoV-2; airway epithelial cells; cilia; microvilli; organoids; protein kinases; proteomics; respiratory synctital virus; respiratory virus.


Conflict of interest statement

Declaration of interests The authors declare no competing interests.

Figures

None
Graphical abstract
Figure 1
Figure 1
SARS-CoV-2 infection of nasal epithelium occurs in two steps (A and B) SARS-CoV-2 infects ciliated HNEs, not goblet cells. Mock-treated or infected HNEs (MOI 0.3) were stained (6, 24, 48, 96 hpi). Representative IF images of HNEs stained for SP, NP, and either cilia HNE marked by acetylated α-tubulin (ACTUB: A) or goblet cell marker (MUC5AC: B). Quantified percentages of NP- and SP-positive ciliated cells or goblet cells are shown (right panel). (C) Initial SARS-CoV-2 infections are restricted to few ciliated HNEs. Mock-treated or infected HNEs (MOIs 3, 0.3, 0.03) were stained at 24 and 48 hpi. Representative IF staining of SP and phalloidin (actin) in virus-infected HNEs. Quantified percentages of SP-positive HNEs (24 and 48 hpi: right panel). (D) Schematic of two-step infection model where SARS-CoV-2 first seeds (0–24 hpi) then spreads (24–48 hpi) during HNE infection. Error bars represent mean ± SD (3,000–4,000 cells quantified from HNEs from Donors 1–4). Each dot represents one donor. Scale bars represent 20 μm. See Figure S1, Table S1.
Figure S1
Figure S1
SARS-CoV-2 infection in nasal epithelium, related to Figure 1 (A and B) SARS-CoV-2 predominantly infects ciliated HNEs and not goblet cells. Mock-treated or SARS-CoV-2-infected HNEs with MOI of 0.3 were stained after 6-, 24-, 48, and 96 hpi. Representative IF staining of SARS-CoV-2 NP and SP in combination with either the ciliated nasal epithelial cell marker (acetylated α-tubulin [ACTUB]) or goblet cell marker (MUC5AC), and phalloidin in mock or SARS-CoV-2-infected HNEs from Donor 1. Similar results were observed from Donor 2–4, see Table S1. Scale bars represent20 μm.
Figure S2
Figure S2
SARS-CoV-2 attaches to the cilia during the initial stage of infection, related to Figure 2 (A) ACE2 and TMPRSS2 localize to the motile cilia in ciliated HEN cells. Representative double IF staining of ACE2 and TMPRSS2 in combination with ACTUB in HNEs (left panel) and human nasal tissue (right panel). (B) SARS-CoV-2 neutralization antibody inhibits attachment of SARS-CoV-2 to cilia. Representative SEM images of SARS-CoV-2 virions attaching to motile cilia after pre-treating HNEs with an unrelated control antibody (left image) or SP neutralizing antibodies (right image) for 2 h before SARS-CoV-2 inoculation with MOI of 0.3 from Donor 7. HNEs were fixed after 6 hpi and observed by SEM Quantification of the average number of virus particles on cilia in infected HNEs. Error bars represent mean ± SD (20–30 cilia were quantified from infected HNEs from Donors 7 and 8, see Table S1). (C) SARS-CoV-2 RBD binds to the cilia in a ciliary ACE2-dependent manner. ALI-cultured HNEs were labeled by SiR-tubulin, a fluorogenic, cell permeable, and highly specific probe for microtubules and treated with pseudovirion, quantum dot-conjugated SARS-CoV-2 receptor binding domain (QD585-RBD) for 6 h. Live-cell images were taken at the indicated time points (seconds) with control (upper image) or soluble ACE2 (down image) using Marianas spinning disk confocal (SDC) microscopy. Quantification of the percentage of HNEs with cilia-attached QD585-RBD with control or soluble ACE2 was performed on the right panel. Error bars represent mean ± SD (200–300 cells were quantified from HNEs from Donor 5–8, see Table S1). p < 0.05, paired, two-tailed Student’s t test. (D–F) Depletion of cilia doesn’t affect the epithelium development and the expression level of ACE2 and TMPRSS2. (D) Representative IF staining of FOXJ1 and ACTUB in scrambled control (shControl) and CEP83 knockdown (shCEP83) HNEs from Donor 1, see Table S1. (E) Representative IF staining for MUC5AC (goblet cells) and ACTUB (ciliated HNEs) with phalloidin in shControl and shCEP83 HNEs. Quantified percentages of MUC5AC-positive cells in the right panel. Error bars represent mean ± SD (2,000–3,000 cells were quantified from shCEP83 and shControl HNEs from Donor 1–4, see Table S1). (F) ACE2, TMPRSS2, and CX3CR1 mRNA expression in shControl and shCEP83 HNEs. Data were collected from Donors 1–4, see Table S1. (G) CX3CR1 localizes to the cilia in HNEs. Representative double IF staining of CX3CR1 and ACTUB in ALI-cultured HNEs (top panel) and normal human nasal tissue (down panel). (H and I) Depletion of cilia decreases the respiratory syncytial virus (RSV) and human parainfluenza virus (PIV) infection. RSV (H) and PIV (I) infected HNEs with MOI of 0.3 were stained after 24 (left image) and 48 (right image) hpi. Representative IF staining for either RSV fusion protein (H) or PIV fusion glycoprotein (I) in combination with ACTUB and phalloidin in shControl and shCEP83 HNEs. Quantified percentages of RSV fusion protein (H) and PIV fusion glycoprotein (I) positive HNEs are shown on the right panel. Error bars represent mean ± SD (3,000–4,000 cells were quantified from virus-infected shCEP83 and shControl HNEs from Donor 1–4, see Table S1. (B–I) p < 0.05, ∗∗p < 0.01, ∗∗∗p < 0.001, NS represents not significant, paired, two-tailed Student’s t test. Each dot represents one donor. Scale bars represent 500 nm (B), 10 μm (C), and 20 μm (A, C, G, H, and I).
Figure 2
Figure 2
SARS-CoV-2 attaches to the cilia during the initial stage of infection (A) StcE mucinase reduces MUC1 mucin levels and increases virus infection efficiency. (Upper panel) Representative IF staining of MUC1, phalloidin in control-, and StcE (10 mg/mL)-treated (6 h) HNEs (Donor 6). Quantification of MUC1 from control- or drug-treated HNEs from Donors 6–8 (lower panel). Error bars represent mean ± SD (Lower panel) SARS-CoV-2-treated HNEs were treated with StcE (10 mg/mL, 6 h) before SARS-CoV-2 infection. Representative IF staining of SARS-CoV-2 SP, ACTUB, and phalloidin staining in control versus StcE-treated infected HNEs (Donor 6). Quantified percentages of SP-positive ciliated HNEs. Error bars represent mean ± SD (3,000–4,000 cells quantified from control- or drug-treated SARS-CoV-2-infected HNEs, Donor 6–8). p < 0.05, paired, two-tailed Student’s t test. Each dot represents one donor. (B and C) SARS-CoV-2 binds to the motile cilia during early viral infection. Mock-treated or SARS-CoV-2-infected HNEs (Donor3) (MOI 0.3) were fixed after 6 hpi. Representative images of SARS-CoV-2 virions attaching to motile cilia as observed by scanning electron microscope (SEM; B) or transmission electron microscopy (TEM; C). Arrowhead: virus particles. Similar results from Donors 4 and 5. (D and E) SARS-CoV-2 neutralizing antibody inhibits SARS-CoV-2 attachment to cilia and decreases infected cells. (D) Representative IF images of SARS-CoV-2 SP with ACTUB after pre-treating HNEs (2 h) with control antibody (left) versus SP neutralizing antibodies (right) before SARS-CoV-2 inoculation (MOI 0.3). HNEs were fixed 6 hpi and stained for SARS-CoV-2 SP and ACTUB (left panel). Quantification is percentage of ciliated HNEs with cilia-attached SARS-CoV-2 (right panel). Error bars represent mean ± SD (2,000–3,000 cells quantified, HNEs from Donors 5–8). (E) Quantified percentages of SP-positive ciliated HNEs (48 hpi). Error bars represent mean ± SD (3,000–4,000 cells quantified, Donors 6–8). ∗∗p < 0.01, paired, two-tailed Student’s t test. Each dot represents one donor. (F) Depleting cilia decreases HNE infection. Infected HNEs (MOI 0.3) were stained after 24 (left) and 48 (right) hpi. Representative IF staining for SARS-CoV-2 SP and ACTUB with phalloidin in shControl versus shCEP83 HNEs. Quantified percentages of SP-positive HNEs (right panel). Error bars represent mean ± SD (3,000–4,000 cells quantified from infected shControl and shCEP83 HNEs Donors 1–4). (G) SARS-CoV-2 viral entry requires TMPRSS2 and ciliary dynein. SARS-CoV-2-infected HNEs were treated: DMSO, Ciliobrevin D (60 μM), camostat mesylate (25 μM), or HCQ (25 μM) 2 h before SARS-CoV-2 infection. Representative IF staining of SARS-CoV-2 SP, ACTUB, and phalloidin staining in DMSO- versus drug-treated infected HNEs at 24 hpi (left) and 48 hpi (right), Donor 6. Quantified percentages of SP-positive ciliated HNEs. Error bars represent mean ± SD (3,000–4,000 control- or drug-treated SARS-CoV-2-infected HNEs, Donor 6–8). (H) Model for motile cilia during SARS-CoV-2 entry. (A and F) p < 0.05, ∗∗p < 0.01, ∗∗∗p < 0.001, NS represents not significant, paired, two-tailed Student’s t test. (G) p < 0.05, ∗∗p < 0.01, NS represents not significant, paired, one-way ANOVA with Tukey’s post-test. Scale bars: 200 nm (C), 1 μm (B), 5 μm (A [top figure] and D), 20 μm (F), and 50 μm (A [down figure] and G). Each dot represents one donor. See Figure S2 and Table S1.
Figure S3
Figure S3
SARS-CoV-2 co-localizes with the microvilli during later stages of virus infection, related to Figure 3 (A) Two different classes of protrusions on the apical surface of HNEs were observed. Long and wide motile cilia (yellow dashed line) and stubby dome-like microvilli (red dashed line). HNEs (Donor 3, see Table S1) were observed by SEM Arrowhead: microvilli. (B) Representative double IF staining of SLK and phalloidin in ALI-cultured HNEs from Donor 1, see Table S1. (C) Representative IF staining of EZR and EBP50 in combination with ACTUB in human nasal tissue. (D) Representative IF staining of ACTUB and MUC5AC in combination with phalloidin in ALI-cultured HNEs from Donor 1, see Table S1. (E) SARS-CoV-2-infected HNEs with MOI of 0.3 were stained after 48 hpi. Representative IF staining of either SARS-CoV-2 SP or SARS-CoV-2 NP in combination with phalloidin in SARS-CoV-2-infected HNEs from Donor 1 (see Table S1). (F) Mock-treated or SARS-CoV-2-infected HNEs with MOI of 0.3 were stained after 6, 24, 48, and 96 hpi. Representative IF staining of SARS-CoV-2 SP, CEP164, and phalloidin in mock or SARS-CoV-2-infected HNEs from Donor 3 (see Table S1) is shown. (G) Small viral vesicles and large viral-containing vesicles could be observed in the infected cells. SARS-CoV-2-infected HNEs (Donor 4–6, see Table S1) with MOI of 0.3 were fixed after 48 hpi. The cells were observed by TEM. Red arrowhead: small viral vesicle. Yellow arrowhead: large viral-containing vesicle. (H) IHC staining for SARS-CoV-2 in nasal epithelium of infected K18-hACE2 mice. Nasal epithelium tissues were collected at days 3 post-infection, fixed in 4% PFA, embedded in paraffin wax, and cut into 5-μm sections. Representative IF staining of SARS-CoV-2 SP and ACTUB in combination with Phalloidin in mouse nasal tissue. Scale bars represent 1 μm (A), 5 μm (B-F), and 10 μm (H).
Figure 3
Figure 3
SARS-CoV-2 co-localizes with microvilli in later stages of infection (A) Representative IF staining of EBP50, phalloidin (microvilli marker), and ACTUB (top) and phosphorylated EZR (pEZR), EZR, and ACTUB (bottom) in ALI-cultured HNEs Donor 1. (B–D) SARS-CoV-2 attaches to microvilli at 24 hpi. (B) Mock-treated or infected HNEs (MOI 0.3) were stained 6, 24, 48, 96 hpi. Representative IF staining for SARS-CoV-2 NP and ACTUB plus phalloidin in mock or SARS-CoV-2-infected HNEs, Donor 1 (right panel). Quantified percentages of microvilli-attached SARS-CoV-2-positive ciliated HNEs Donors 1–4 are shown. (C and D) Mock-treated versus infected HNEs (Donor 3; MOI 0.3) were fixed after 24 hpi. The cells were observed by TEM (C) or SEM (D). Arrowhead: virus particles. Donors 4–6 showed similar results. Scale bars: 10 μm (A, left), 5 μm (A, right and B), 1 μm (C and D). See Figure S3 and Table S1.
Figure 4
Figure 4
SARS-CoV-2 regulates the dynamics of microvilli and promotes highly extended microvilli to facilitate viral shedding/secretion (A and B) SARS-CoV-2 infection increases phosphorylated ezrin (EZR) and EBP50 protein on microvilli. (A) Mock-treated or infected HNEs (MOI 0.3) were stained 48 hpi. Representative IF staining of pEZR and phalloidin with ACTUB in mock or infected HNEs Donor 3 (left panel). Quantification of pEZR from mock and infected HNEs Donors 3–6 (middle panel). pEZR expression increased in SARS-CoV-2-infected HNEs compared to mock controls. pEZR and EZR immunoblots of in mock or infected HNEs Donor 6 (right panel). Donors 4 and5 showed similar results. (B) Mock-treated or SARS-CoV-2-infected HNEs (MOI 0.3) were stained 48 hpi. Representative IF staining of EBP50, phalloidin and SARS-CoV-2 SP for mock versus infected HNEs (Donor 3). Quantification of EBP50 on microvilli from mock and infected HNEs Donor 3–6 (right panel). EBP50 expression increased in infected HNEs compared to mock controls. (C–E) SARS-CoV-2 infection affects microvillar structure. (C and E) Infected HNEs (Donor 3) with MOI of 0.3 were fixed at 24 and 48 hpi. Cells were observed by TEM. (C) Quantification of the number of dome-shaped structures per cell from Donors 3–6 (right panel). Error bars represent mean ± SD (200 ciliated HNEs were counted from 4 donors each). (A, B, and C) Error bars represent mean ± SD p < 0.05, ∗∗p < 0.01, ∗∗∗p < 0.001, NS represents not significant, paired, two-tailed Student’s t test. Red arrowhead: small viral vesicle. (D) Mock-treated or infected HNEs with MOI of 0.3 were stained at 6, 24, 48, and 96 hpi. Representative IF staining of SARS-CoV-2 NP, EZR, and phalloidin in mock or SARS-CoV-2-infected HNEs from Donor 3 (right panel). Quantification of the length of EZR from mock and SARS-CoV-2-infected HNEs from Donors 3–550 ciliated HNEs from 4 donors each). White dotted line: extended microvilli. Red arrowhead: virus particles (E) SARS-CoV-2 infection induce overly long microvilli attached with virus particles at 24 (upper image) and 48 (lower image) hpi. Red dotted line: extended microvilli. (F) Model of microvilli structures and viral vesicles affected by SARS-Co-V2 infection. (G) Microvillar inhibitors inhibit microvilli structure. Representative IF staining of pEZR and phalloidin in DMSO-, NSC-668394 (40 μM)-, and SB-633825 (40 μM)-treated HNEs from Donor 5 Quantification of pEZR and phalloidin from DMSO- or drug-treated HNEs (3 h treatment) Donors 5–8 (down panel). pEZR and phalloidin expression showed a decrease in drug-treated HNEs, compared to DMSO-treated cells. (H) SARS-CoV-2-treated HNEs were treated with NSC-668394 or SB-633825 (see schematic). (I) Microvilli inhibitors, NSC-668394 (40 μM) and SB-633825 (40 μM), significantly inhibit SARS-CoV-2 infection in HNEs. Representative IF staining of SARS-CoV-2 SP, ACTUB, and phalloidin in DMSO- or drug-treated SARS-CoV-2-infected HNEs at 24 hpi (upper image) and 48 hpi (down image) (Donor 5). Quantified percentages of SP-positive ciliated HNEs (right panel). Error bars represent mean ± SD (3,000–4,000 HNEs were quantified Donors 4–8). (G and I) Error bars represent mean ± SD p < 0.05, ∗∗∗p < 0.001, NS represents not significant, paired, one-way ANOVA with Tukey’s post-test. Each dot represents one donor. Scale bars: 5 μm (A, B, D, and G), 1 μm (C), 2 μm (E), 20 μm (I). See Figure S4 and Table S1.
Figure S4
Figure S4
SARS-CoV-2 promotes highly extended and branched microvilli, related to Figure 4 (A and B) SARS-CoV-2 infection induces dome-like structure and highly branched and overly long microvilli. (A) SARS-CoV-2-infected HNEs (Donor 3–6, see Table S1) with MOI of 0.3 were fixed after 48 hpi. The cells were observed by TEM. Arrowhead: virus particles. (B) mock-treated and SARS-CoV-2-infected HNEs (Donor 3–6, see Table S1) with MOI of 0.3 were fixed after 24 hpi. The cells were observed by TEM. Red dotted line represents extended microvilli and dome-like structure. (C) SARS-CoV-2 viral particles bind to the motile cilia at 6 hpi rather than microvilli. SARS-CoV-2-infected HNEs with MOI of 0.3 were stained after 6 (upper image) and 24 (down image) hpi. Representative IF images of SARS-CoV-2 SP in combination with ACTUB and phalloidin in SARS-CoV-2-infected HNEs from Donor 1. Similar results were observed from Donor 2–4, see Table S1. (D) ACE2 and TMPRSS2 mainly localize in cilia rather than microvilli. Representative IF images of ACE2 (top panel) and TMPRSS2 (lower panel) in combination with ACTUB and phalloidin in normal human nasal tissue (left panel) and ALI-cultured HNEs (right panel). Scale bars represent 5 μm (D) and 10 μm (C).
Figure S5
Figure S5
Mucociliary transport assists in the spread of SARS-CoV-2, related to Figure 5 (A–D) Cilia beating defect doesn’t affect the structure of cilia and microvilli, the epithelium development, and the expression level of ACE2 and TMPRSS2. (A) Representative IF staining of ACTUB, IFT88, and ARL13B in HNEs from control (upper panel, Donor 5) and PCD patients (down panel, PCD Donor 1, see Table S2). Similar results were observed from samples harvested from Donor 6–8 and PCD Donor 2 and 3. (B) Representative IF images of ACTUB and EZR with phalloidin in control (upper panel, Donor 5) and PCD (down panel, PCD Donor 1, see Table S2) HNEs. Similar results were observed from samples harvested from Donors 6–8 and PCD Donors 2 and 3. (C) Representative double IF staining of MUC5AC, ACTUB, and phalloidin in control (left image) and PCD (right image) HNEs. Quantified percentages of MUC5AC positive cells (right panel). Error bars represent mean ± SD (2,000–3,000 cells were quantified from control and PCD HNEs from Donor 5–8 and PCD Donor 1–3, see Tables S1 and S2). NS represents not significant, paired, two-tailed Student’s t test. Each dot represents one donor. (D) ACE2 and TMPRSS2 mRNA expression in control and PCD HNEs. Error bars represent mean ± SD (data was collected from Donors 5–8 and PCD Donors 1–3, see Tables S1 and S2). (E and F) SARS-CoV-2 infection doesn’t affect cell boundaries and cell-cell junctions. SARS-CoV-2-infected HNEs (Donor 3, see Table S1) with MOI of 0.3 were fixed at 24 and 48 hpi. Cells were observed by TEM (E) and IF (F). (F) Representative IF staining of SARS-CoV-2 SP and β-catenin in combination with phalloidin in ALI-cultured HNEs from Donor 1, see Table S1. Scale bars represent 5 μm (A, B, and F) and 20 μm (C).
Figure 5
Figure 5
Mucociliary transport assists the spread of SARS-CoV-2 (A and B) Cilia beating does not alter viral entry but affects virus spread. (A) Infected HNEs (MOI 0.3) were stained at 24 and 48 hpi. Representative IF staining of SP, ACTUB, and phalloidin in control versus PCD HNEs at 24 hpi (left image) and 48 hpi (right image). Quantified percentages of SP-positive ciliated HNEs (right panels). Error bars represent mean ± SD (3,000–4,000 HNEs were quantified from infected control (Donors 5–8) and PCD HNEs (Donors 1–3, Tables S1 and S2). (B) Infected HNEs (MOIs 0.3, 0.03) were stained at 48 hpi. Representative IF images of SP in control (Donor 6) and PCD (PCD Donor 2) HNEs. Quantified percentages of SP-positive area (right panel). Error bars represent mean ± SD (data from Donors 5–8 and PCD Donors 1–3). (C) The simulated mucus flow allows redistribution of virus particles. SARS-CoV-2-treated PCD HNEs were exposed or not treated to mechanical flow by pipetting 50 μL medium at24 hpi and were stained at 48 hpi. Representative IF images of SP in control (left image) and mechanical force (right image) PCD (PCD Donor 1) HNEs. Quantified percentages of SP-positive area (right panel). Error bars represent mean ± SD (PCD Donors 1–3). (D) Model illustrating mucociliary flow effects during SARS-CoV-2 spread. p < 0.05, ∗∗p < 0.05, NS represents not significant, two-tailed Student’s t test. Each dot represents one donor. Scale bars represent 20 μm (A), 50 μm (C), and 100 μm (B). See Figure S5 and Tables S1 and S2.
Figure S6
Figure S6
PAK1/4 regulate microvilli to facilitate the SARS-CoV-2 budding and spreading, related to Figure 6 (A) SARS-CoV-2 infection-affected kinases. ES values of various kinases from KSEA at 6, 24, 36, and 48 hpi after infection. p values were adjusted using Benjamini-Hochberg procedure. 4 biological replicates of phosphopeptide enriched shotgun proteomic samples (Donors 1–4, see Table S1). (B) SARS-CoV-2 hijack host signaling pathways. SARS-CoV-2-infected HNEs with MOI of 0.3 were stained after 48 hpi. Representative staining of phospho AKT1/2 (pAKT1/2), phospho ERK1/2 (pERK1/2), and phospho p38 (pp38) in combination with ACTUB and SARS-CoV-2 SP in mock-treated and SARS-CoV-2-infected HNEs from Donor 1 is shown. Similar results were observed from Donor 2–4, see Table S1. (C–E) Identifying kinases involved in both viral infection and microvilli structure. (C) HNEs were treated with either the PAK1 inhibitor FRAX486, the PAK4 inhibitor LCH-7749944, the CAMK4 inhibitor KN-93, the AKT1/2 inhibitor MK-2206, the ROCK1/2 inhibitor Y27632, the MAPKAPK2 inhibitor MK2IV, or the p38 inhibitor ARRY797 prior to SARS-CoV-2 infection and were fixed after 48 hpi. Quantified percentages of SARS-CoV-2 SP positive ciliated HNEs are shown. Error bars represent mean ± SD (3,000–4,000 cells were quantified from DMSO- or drug-treated SARS-CoV-2-infected HNEs from Donor 3–6, see Table S1). (D) Representative IF staining of pEZR and phalloidin in DMSO-, KN-93 (20 uM)-, MK-2206 (20 μM)-, Y27632 (20 uM)-, MK2IV (20 uM)-, and ARRY797 (20 uM)-treated HNEs from Donor 3, see Table S1. Quantification of pEZR and phalloidin from DMSO- or drug-treated HNEs from Donors 5–8 (lower panel; see Table S1) is shown. Error bars represent mean ± SD Drugs were added for 3 h. (E) Representative IF staining of ACTUB and phalloidin in DMSO-, FRAX486- (20 uM)-, and LCH-7749944 (20 uM)-treated HNEs from Donor 6, see Table S1. (C and D) p < 0.05, ∗∗p < 0.01, ∗∗∗p < 0.001, NS represents not significant, paired, One-way ANOVA with Tukey’s post-test. Each dot represents one donor. (F) Cytotoxicity measured in companion uninfected cultures. HNEs were exposed to a dose-response of kinase inhibitors, DMSO, or positive control 2 μM staurosporine in triplicate (Donor 4–6). After 48 h, cytotoxicity was measured using Toxilight Assay, which measures adenylate kinase released into the culture medium from dying cells. Staurosporine was significantly different from vehicle and all kinase inhibitors. (G and H) PAK4 kinases inhibitor as well as siRNA have partial or no significant viral inhibitory effect on ACE2-expressing A549 cells. (G) ACE2-expressing A549 cells were treated with LCH-7749944 (20 uM) for 2 h before SARS-CoV-2 infection with MOI of 0.5 for 24 h. Representative IF staining of SARS-CoV-2 SP and NP staining in DMSO- or drug-treated cells (left panel). Quantified percentages of NP-positive cells (middle panel). Quantitative analysis of viral titer by plaque assay (right panel). (H) siControl- or siPAK4-treated ACE2-expressing A549 cells were infected with SARS-CoV-2 MOI of 0.5 for 24 h. Representative IF staining of SARS-CoV-2 SP and NP staining in siControl- or siPAK4-treated cells (left panel). Quantified percentages of NP-positive cells (middle panel). Quantitative analysis of viral titer by plaque assay (right panel). Immunoblot showing depletion of PAK4 in ACE2-expressing A549 cells (down panel). (G and H) Error bars represent mean ± SD (2,000–3,000 cells were quantified from drug- or siRNA treated SARS-CoV-2-infected cells. p < 0.05, NS represents not significant, paired, two-tailed Student’s t test. (I) Log2 fold change profiles of indicated PAK1 and PAK4 potential substrates during infection in HNEs at 48 hpi. (J) Infected HNEs with MOI of 0.3 were stained at 48 hpi. Representative IF staining of BAIAP2, PTPN14, ARHGEF2, or MYH14 with ACTUB and SP in infected HNEs from Donor 1. Similar results were observed from Donors 2–4, see Table S1. (K) Log2 fold change profiles of filopodia- and cytoskeleton-related proteins during SARS-CoV-2 infection in HNEs after 48hpi. (L) SARS-CoV-2-infected HNEs with MOI of 0.3 were stained after 48 hpi. Shown here are representative IF images of CDK16, PPP1R12A, and ANKRD35 in combination with ACTUB and SARS-CoV-2 SP in SARS-CoV-2-infected HNEs from Donor 1. Similar results were observed from Donor 2–4, see Table S1. Scale bars represent 5 μm (A, D, E, G, H, J, and L) and 20 μm (B).
Figure 6
Figure 6
PAK1/4 regulate microvilli to facilitate SARS-CoV-2 budding and spreading (A and B) SARS-CoV-2 infection hijacks host signaling pathways. (A) Infected HNEs (MOI 0.3) were stained after 48 hpi. Representative images of phospho-PAK1/2 (pPAK1/2, left image), phospho-PAK4 (pPAK4, right image), and ACTUB in virus-infected cells (SP) of mock-treated versus infected HNEs from Donor 1. Donors 2–4 showed similar results. (B) Immunoblots for pPAK1/2, pPAK4, pAKT1/2, pERK1/2, and pp38 protein expression in mock versus infected HNEs (48 hpi, Donor 6). Donors 7–8 showed similar results. (C and D) PAK1 and PAK4 kinases reorganize microvilli structure and inhibit viral egress. (C) Representative IF staining of pEZR and phalloidin in DMSO-, FRAX486 (20 uM)-, and LCH-7749944 (20 μM)-treated HNEs from Donor 3. Quantification of pEZR and phalloidin from DMSO- or drug-treated HNEs from Donors 5–8 (lower panel) is shown. pEZR and phalloidin staining was lower in drug-treated (3 h) HNEs than DMSO. Error bars represent mean ± SD. (D) SARS-CoV-2-treated HNEs were treated with FRAX486 (20 uM) and LCH-7749944 (20 uM) as in Figure 5H. Representative IF staining of SARS-CoV-2 SP, ACTUB, and phalloidin staining in DMSO- versus drug-treated infected HNEs at 24 hpi (upper image) and 48 hpi (down image), Donor 5. Quantified percentages of SP-positive ciliated HNEs (right panel). Error bars represent mean ± SD (3,000–4,000 HNEs Donors 4–8). (E–G) Loss of EZR and PAK4 siRNA knockdown doesn’t affect viral entry at 24 hpi but significantly inhibits viral egress at 48 hpi. (E) Representative IF staining of SARS-CoV-2 SP, ACTUB, and phalloidin staining in siControl versus siEZR- or siPAK4-treated HNEs at 24 hpi (upper image) and 48 hpi (down image), Donor 6. (F) Quantified percentages of SP-positive ciliated HNEs (right panel). Error bars represent mean ± SD (3,000–4,000 HNEs Donors 6–8). (G) Immunoblot showing depletion of EZR or PAK4 in HNEs. (C, D, and F) p < 0.05, ∗∗p < 0.01, ∗∗∗p < 0.001, NS represents not significant, paired, one-way ANOVA with Tukey’s post-test. Each dot represents one donor. (H) Model for SARS-CoV-2 entry, egress, and spread in nasal airway. (1) SARS-CoV-2 binds to cilia to cross the barrier and allow HNEs entry during early stages of infection. (2) SARS-CoV-2 hijacks PAK1 and PAK4 signaling to elongate microvilli and facilitate viral egress. (3) Virus attached to microvilli is carried along extended microvilli from the base to the mucus layer, allowing virus spreads throughout the tissue mucus layer. Scale bars represent 5 μm (C), 20 μm (A and D), and 50 μm (E). See Figure S6 and Table S1.
Figure S7
Figure S7
Higher viral entry and replication of Omicron in human nasal epithelium, related to Figure 7 (A) The effect of microvilli inhibitors in the mouse models. K18-hACE2 mice were infected with SARS-CoV-2 (1000 PFU) intranasally with the inhibitors or vehicle control (solvent) at day 0. Then the inhibitors were delivered intranasally once per day at day 0 and 1. At day 3 (i.e., 3 dpi), the lung were harvested for analysis. Virus titer measurement using plaque assay for the lung. The number of mice is 4 (n = 4) per group. SB-633825 and LCH-7749944 were used as 10 mg/mouse by intranasal inoculation. Data are shown as mean ± SD Kolmogorov-Smirnov test, P < 0.05. The same experiment was repeated 3 times and similar results were obtained. (B) SARS-CoV-2 D614G and Omicron variants replication kinetics in HNEs. qPCR data were collected with the use of the infected cells derived from Donor 6–8, see Table S1. (C) Quantitative analysis of viral titer from plaque assays on different strains of SARS-Co-V2-infected Vero E6 cells. ∗∗∗p < 0.001, paired, two-tailed Student’s t test. (D) Omicron’s RBD has a stronger cilia adhesion ability. ALI-cultured HNEs were labeled by SiR-tubulin and treated with pseudovirion, quantum dot-conjugated SARS-CoV-2 D614G (left image, QD585-SARS-CoV-2 RBD), or Omicron receptor binding domain (right image, QD585-Omicron RBD) for 6 h. Quantification of the intensity of pseudovirion of ciliated HNEs was performed on the right panel. Error bars represent mean ± SD (5–10 cells were quantified from HNEs from Donor 6–8, see Table S1). (E) Compared to D614G, Omicron has a stronger infectivity. D614G-RFP (MOI 2) or D614G -SpikeOmicron-BA.1-GFP (MOI 0.1) or double-infected (same MOIs) infected HNEs were stained at 48 hpi. Representative IF images of RFP or GFP in HNEs from Donor 6. Quantified percentages of RFP- or GFP-positive area (right panel). Error bars represent mean ± SD (data were collected from Donors 6–8, see Table S1). Scale bars represent 10 μm (D) and 50 μm (E).
Figure 7
Figure 7
Higher viral entry and replication of Omicron in human nasal epithelium (A) Omicron variants show notable increase of infected cells at early timepoints. Mock-treated or SARS-CoV-2 D614G, Delta, and Omicron (BA.1, BA.4, BA.5) strain-infected HNEs (MOI 0.3) were stained at 6 (left), 24 (middle), and 48 hpi (right). Representative IF images of HNEs stained for SP, NP, and CED marker ACTUB. Quantified percentages of NP- and SP-positive ciliated nasal epithelial cells or goblet cells (right panel). (B and C) Cilia and microvilli remain critical in Delta and Omicron infections. (B) SARS-CoV-2 variants infected HNEs (MOI 0.3) were stained 48 hpi. Representative IF staining for SP and ACTUB with phalloidin in shControl and shCEP83 Delta (left)- or Omicron BA.1 (right)-infected HNEs. Quantified percentages of SP-positive HNEs (right panel). Error bars represent mean ± SD (3,000–4,000 HNEs Donors 6–8). (C) SARS-CoV-2 variant-treated HNEs were treated with SB-633825 (40 μM) and LCH-7749944 (20 μM) as in Figure 5H. Representative IF staining of SARS-CoV-2 SP, ACTUB, and phalloidin staining in DMSO- versus drug-treated Delta (left)- or Omicron BA.1 (right)-infected HNEs. Quantified percentages of SP-positive ciliated HNEs (right). Error bars represent mean ± SD (3,000–4,000 NHEs Donors 6–8). (A–C) ∗∗p < 0.01, ∗∗∗p < 0.001, One-way ANOVA with Tukey’s post-test (A and C) or paired, two-tailed Student’s t test (B). Each dot = one donor. Scale bars represent 20 μm.

Comment in

References

    1. Hoffmann M., Kleine-Weber H., Schroeder S., Krüger N., Herrler T., Erichsen S., Schiergens T.S., Herrler G., Wu N.H., Nitsche A., et al. SARS-CoV-2 cell entry depends on ACE2 and TMPRSS2 and is blocked by a clinically proven protease inhibitor. Cell. 2020;181:271–280.e8. doi: 10.1016/j.cell.2020.02.052. - DOI - PMC - PubMed
    1. Hou Y.J., Okuda K., Edwards C.E., Martinez D.R., Asakura T., Dinnon K.H., 3rd, Kato T., Lee R.E., Yount B.L., Mascenik T.M., et al. SARS-CoV-2 reverse genetics reveals a variable infection gradient in the respiratory tract. Cell. 2020;182:429–446.e14. doi: 10.1016/j.cell.2020.05.042. - DOI - PMC - PubMed
    1. Gallo O., Locatello L.G., Mazzoni A., Novelli L., Annunziato F. The central role of the nasal microenvironment in the transmission, modulation, and clinical progression of SARS-CoV-2 infection. Mucosal Immunol. 2021;14:305–316. doi: 10.1038/s41385-020-00359-2. - DOI - PMC - PubMed
    1. Kuek L.E., Lee R.J. First contact: the role of respiratory cilia in host-pathogen interactions in the airways. Am. J. Physiol. Lung Cell Mol. Physiol. 2020;319:L603–L619. doi: 10.1152/ajplung.00283.2020. - DOI - PMC - PubMed
    1. Knowles M.R., Boucher R.C. Mucus clearance as a primary innate defense mechanism for mammalian airways. J. Clin. Invest. 2002;109:571–577. doi: 10.1172/JCI15217. - DOI - PMC - PubMed

Publication types

Supplementary concepts