. 2023 Jan 5;186(1):194-208.e18.
doi: 10.1016/j.cell.2022.12.010. Epub 2022 Dec 28.

Molecular and spatial signatures of mouse brain aging at single-cell resolution

Affiliations

Molecular and spatial signatures of mouse brain aging at single-cell resolution

William E Allen et al. Cell. .

Abstract

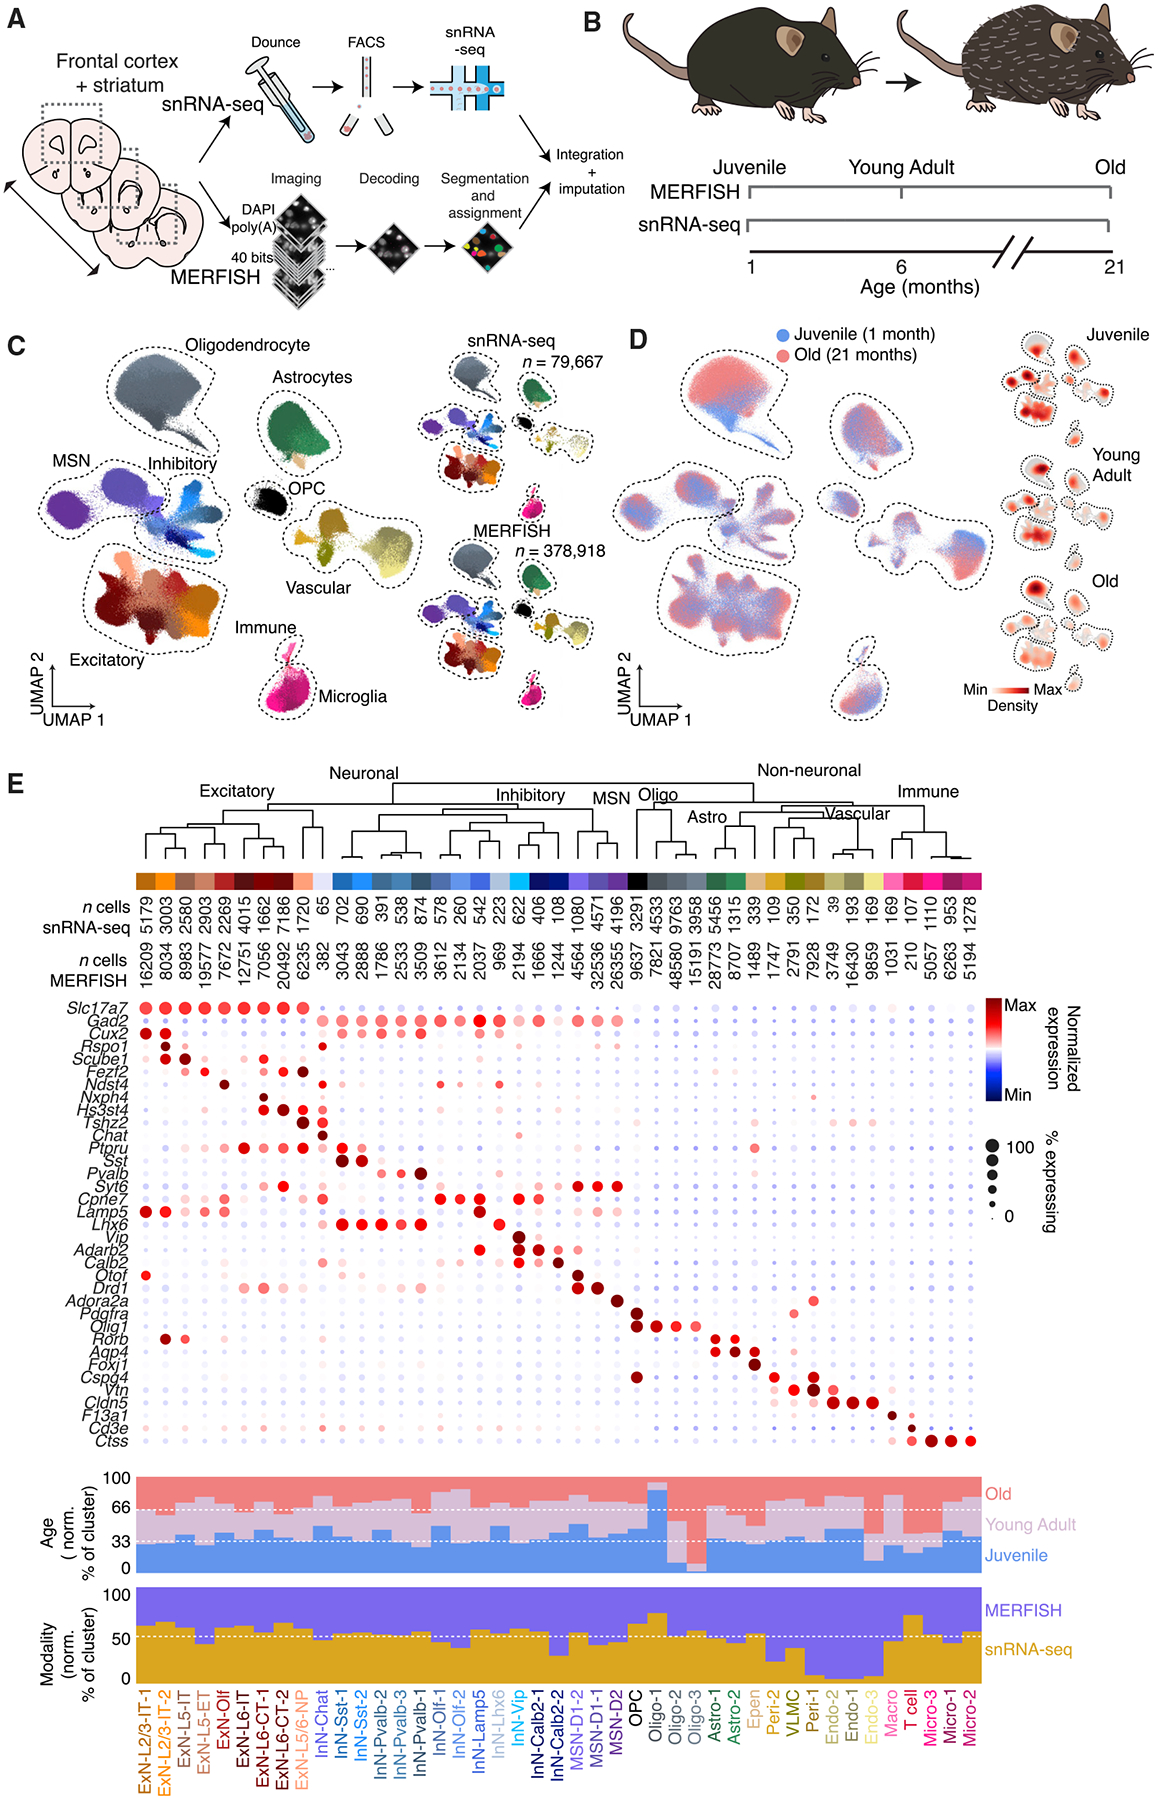
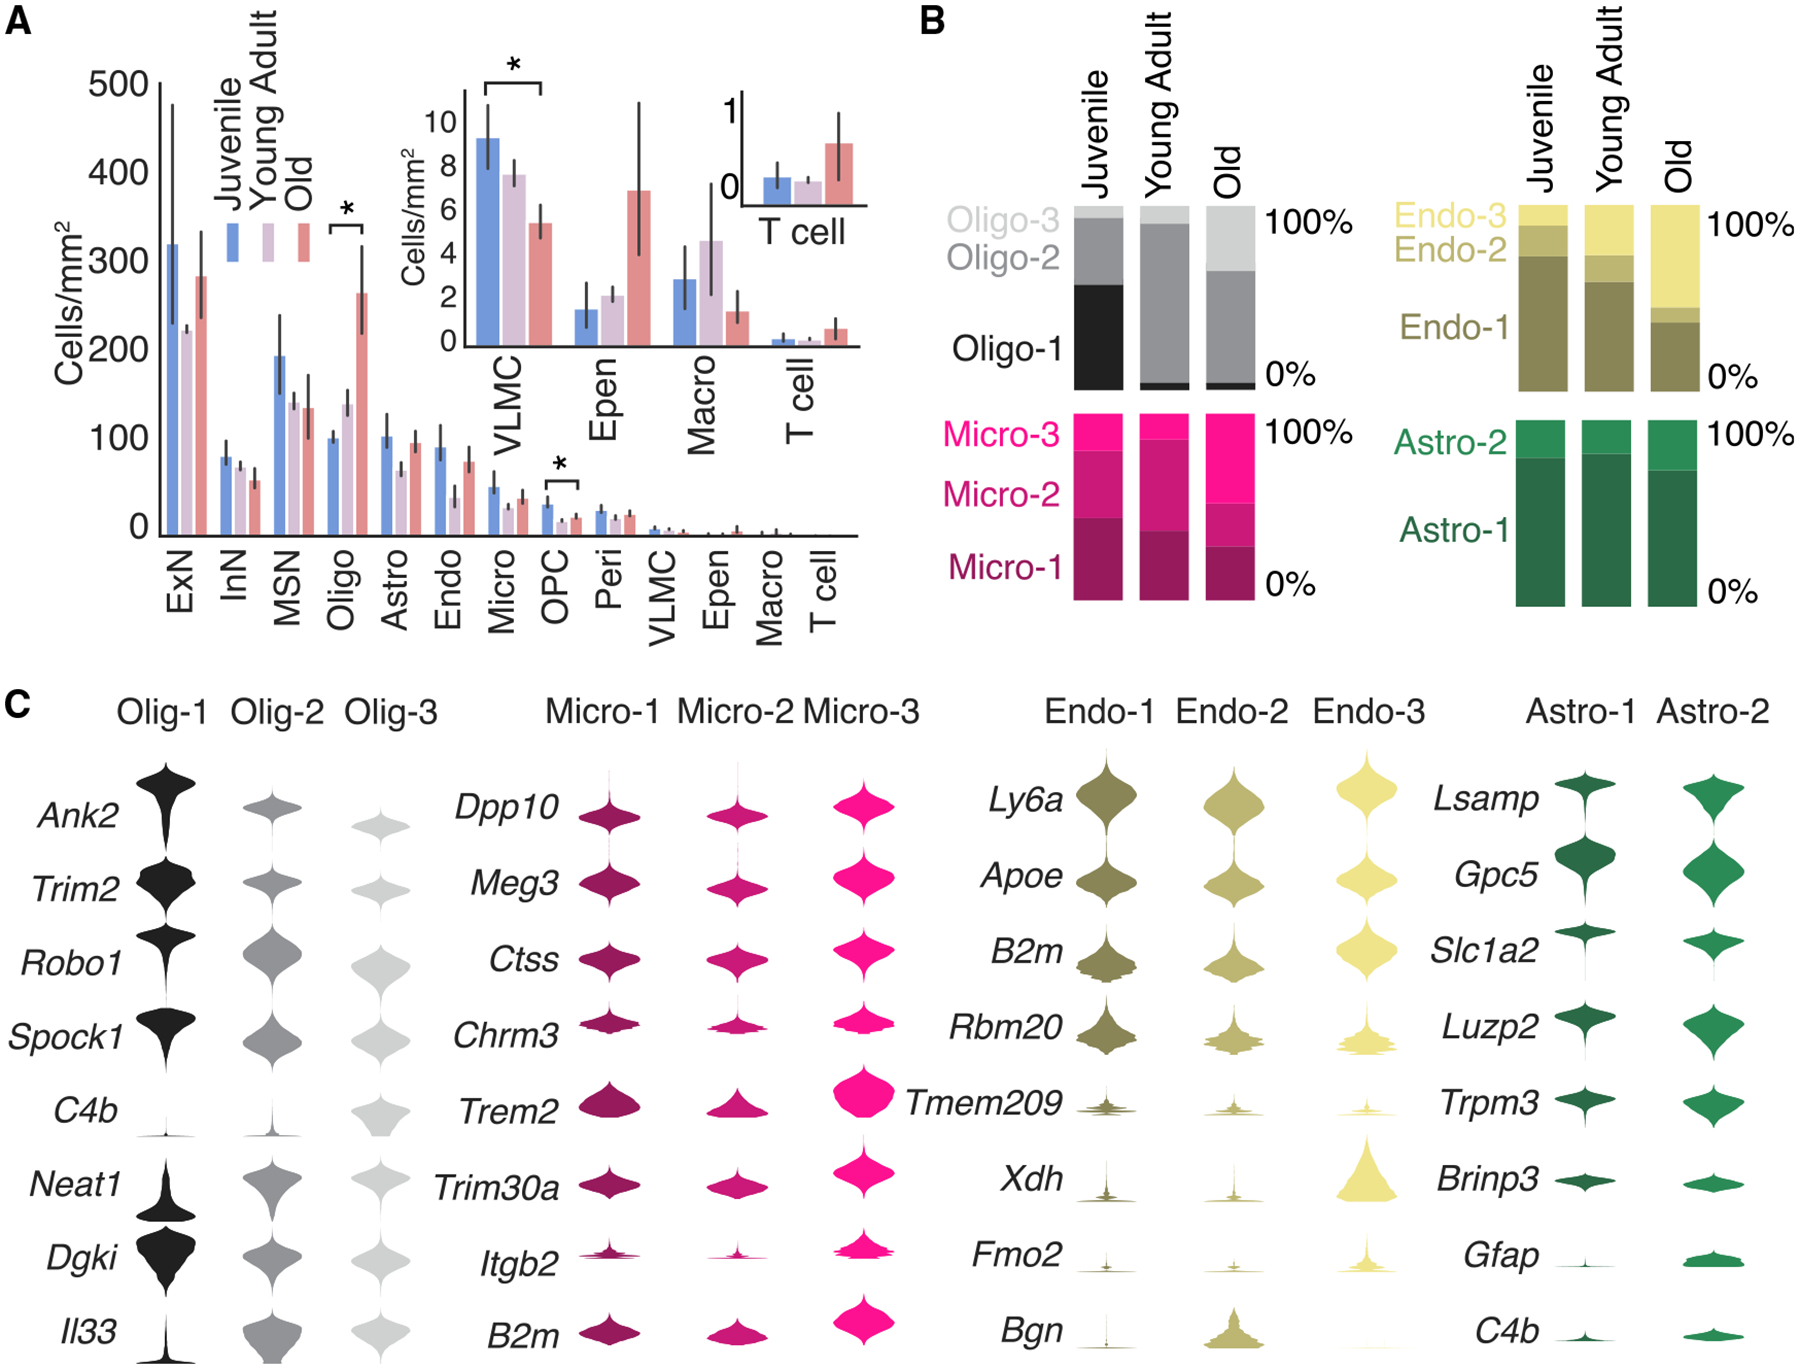
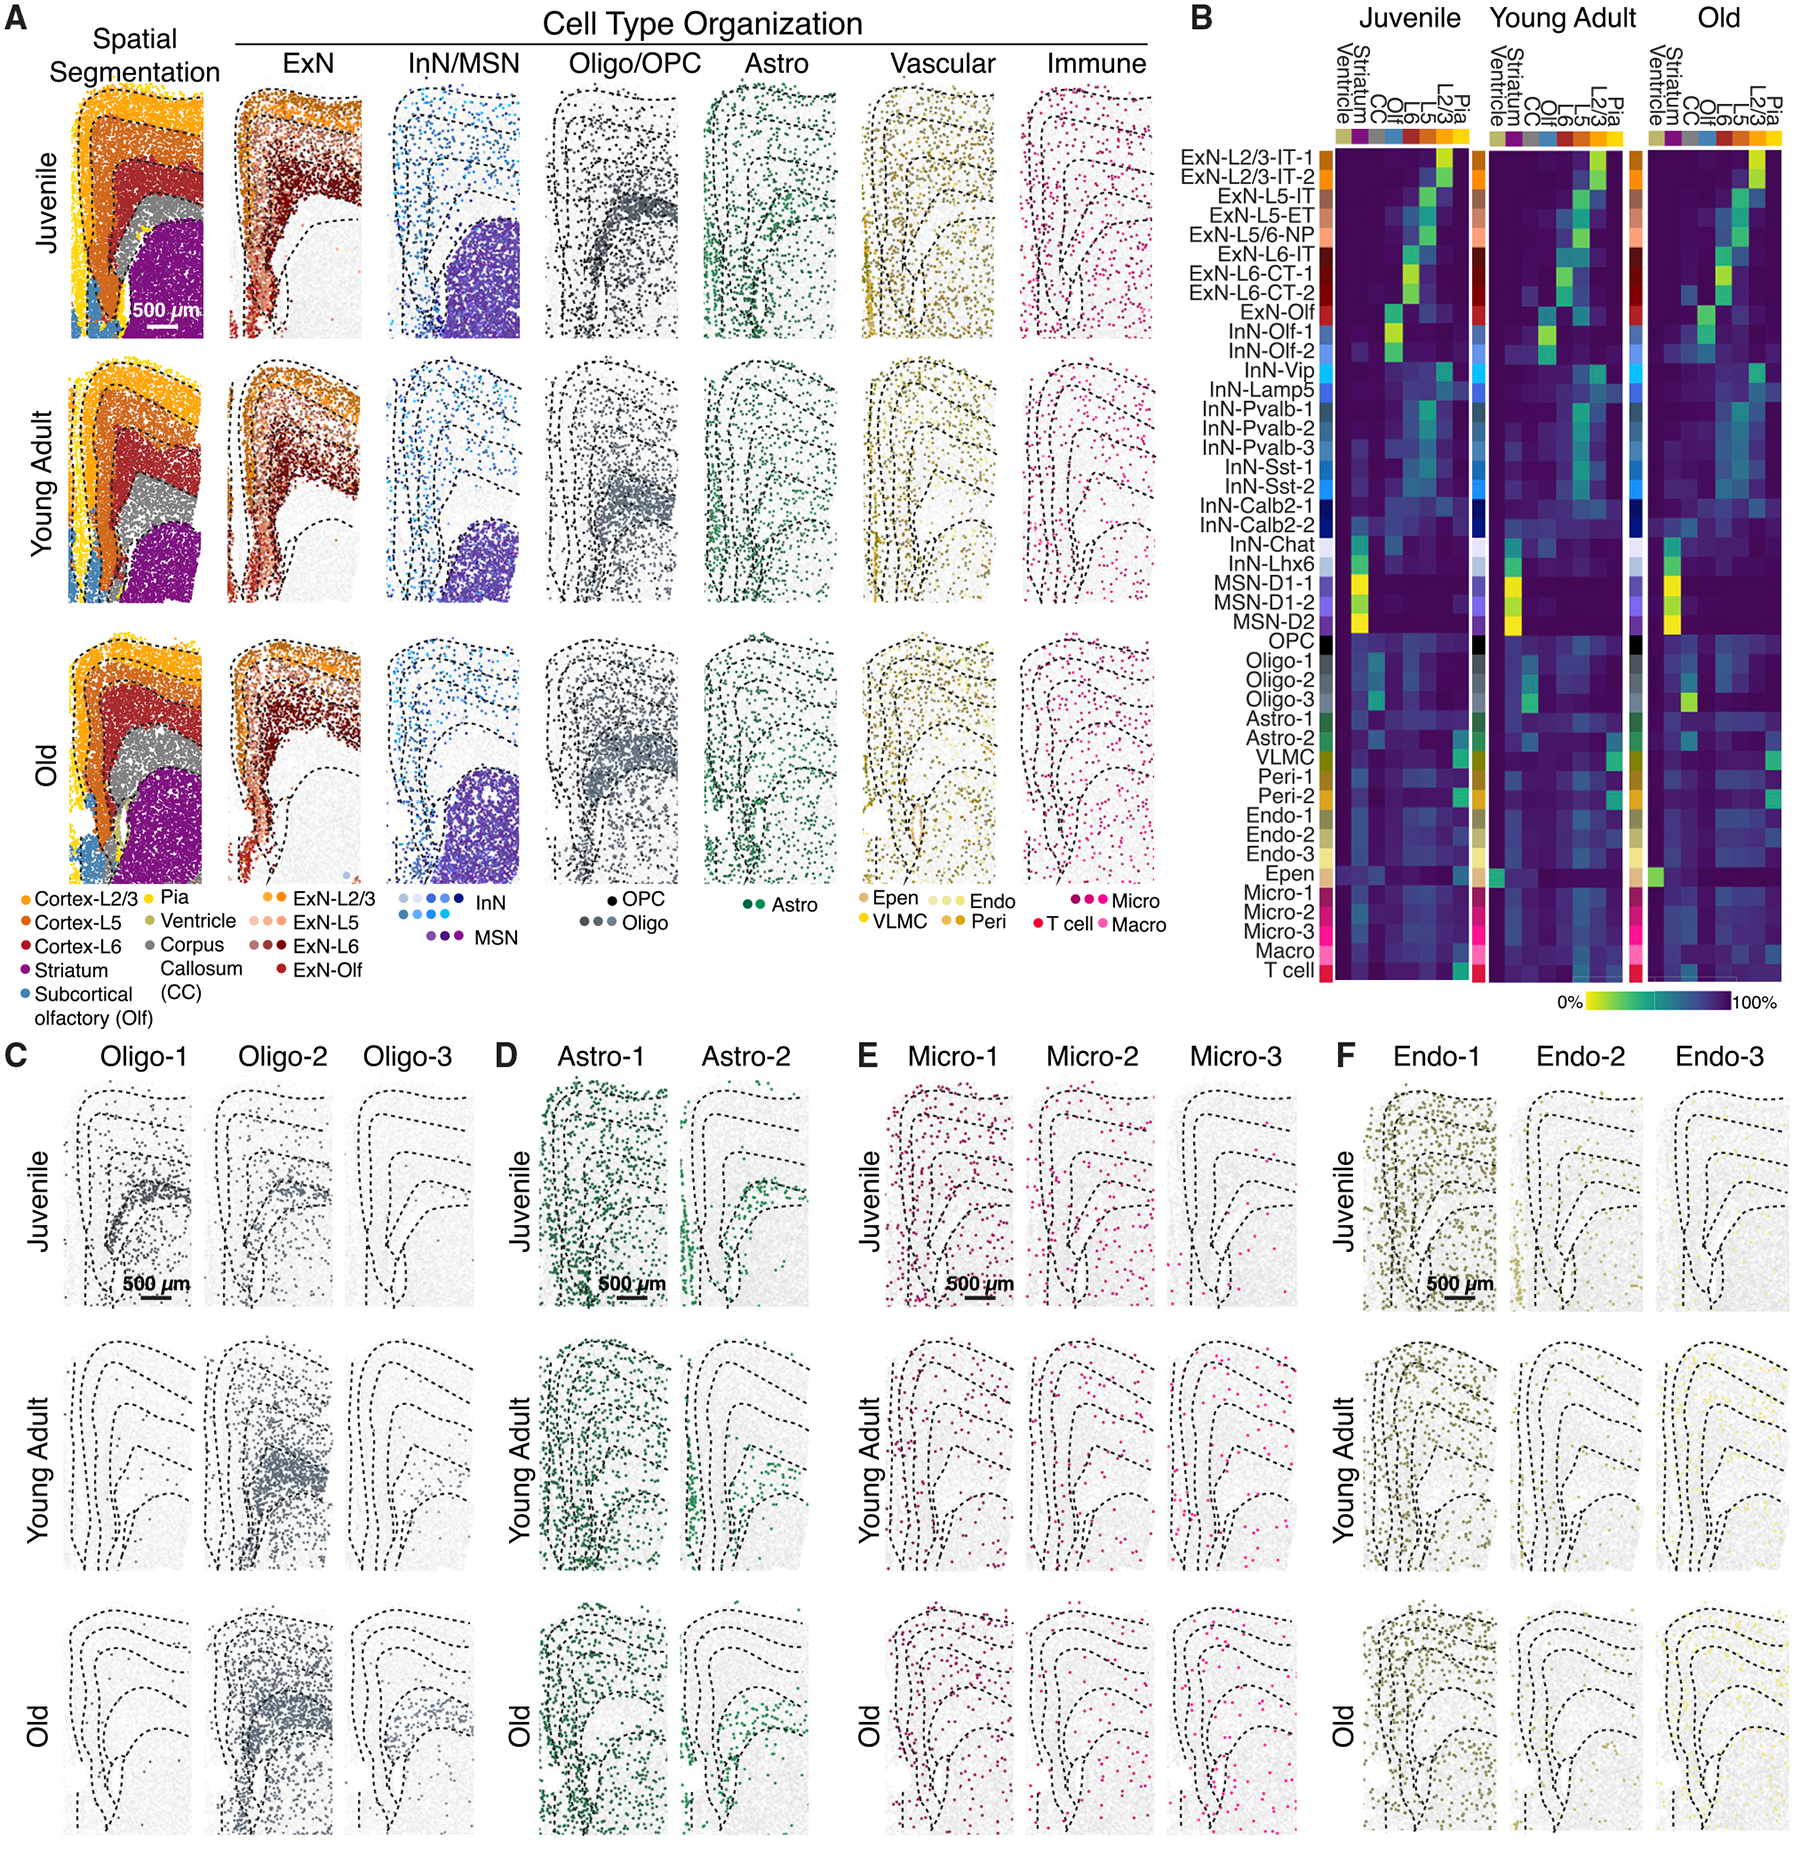
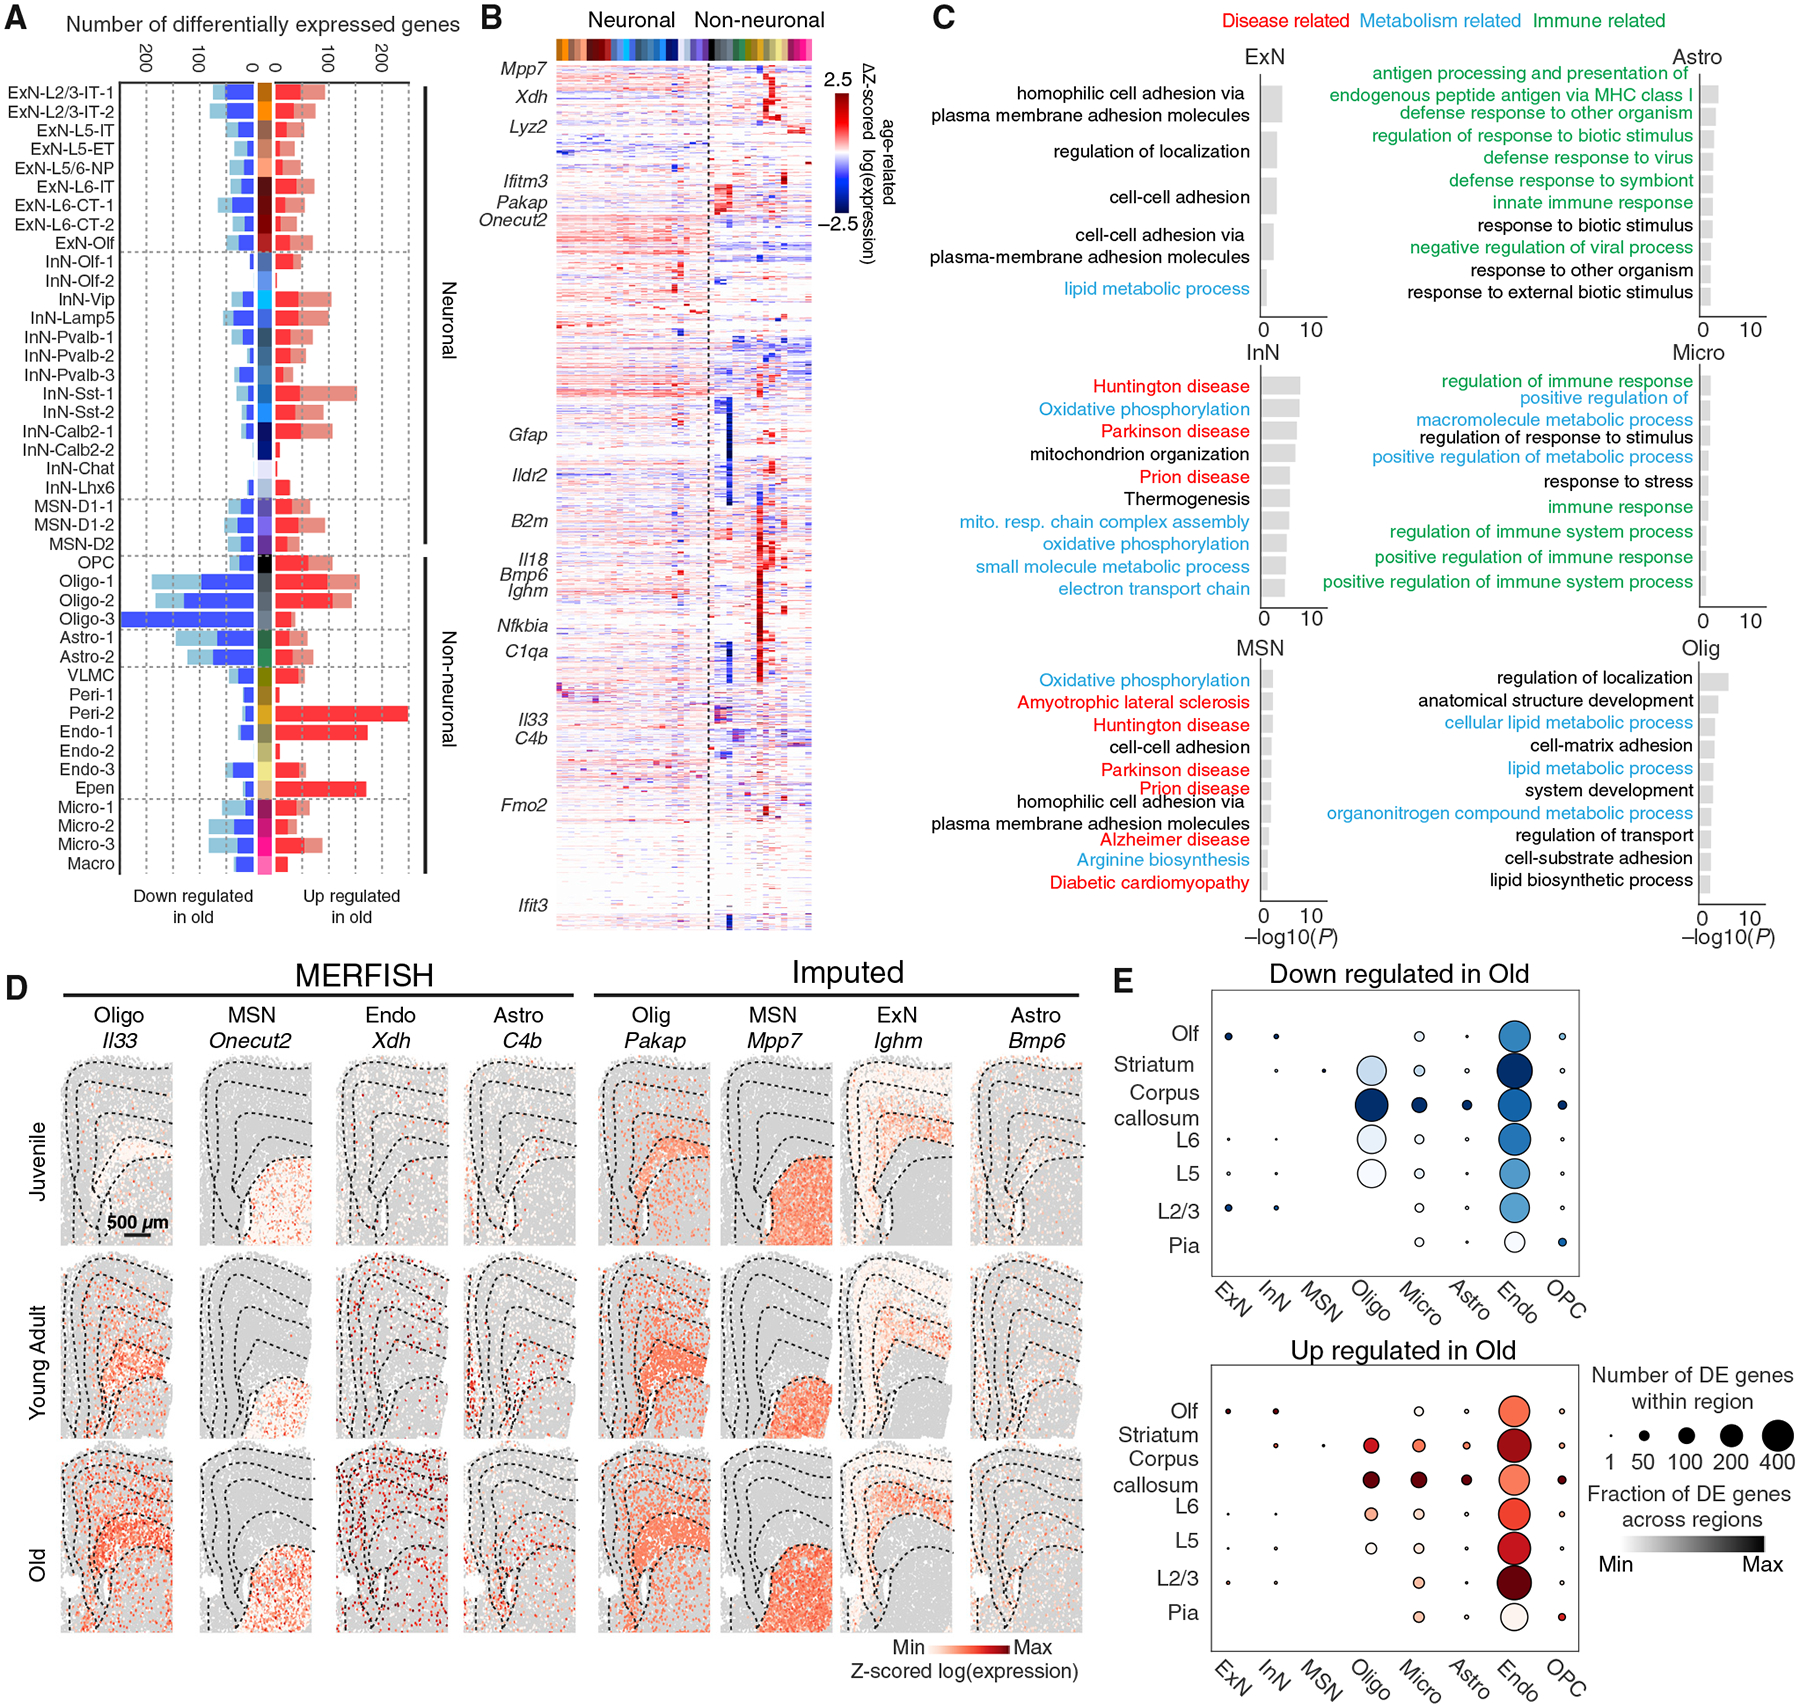
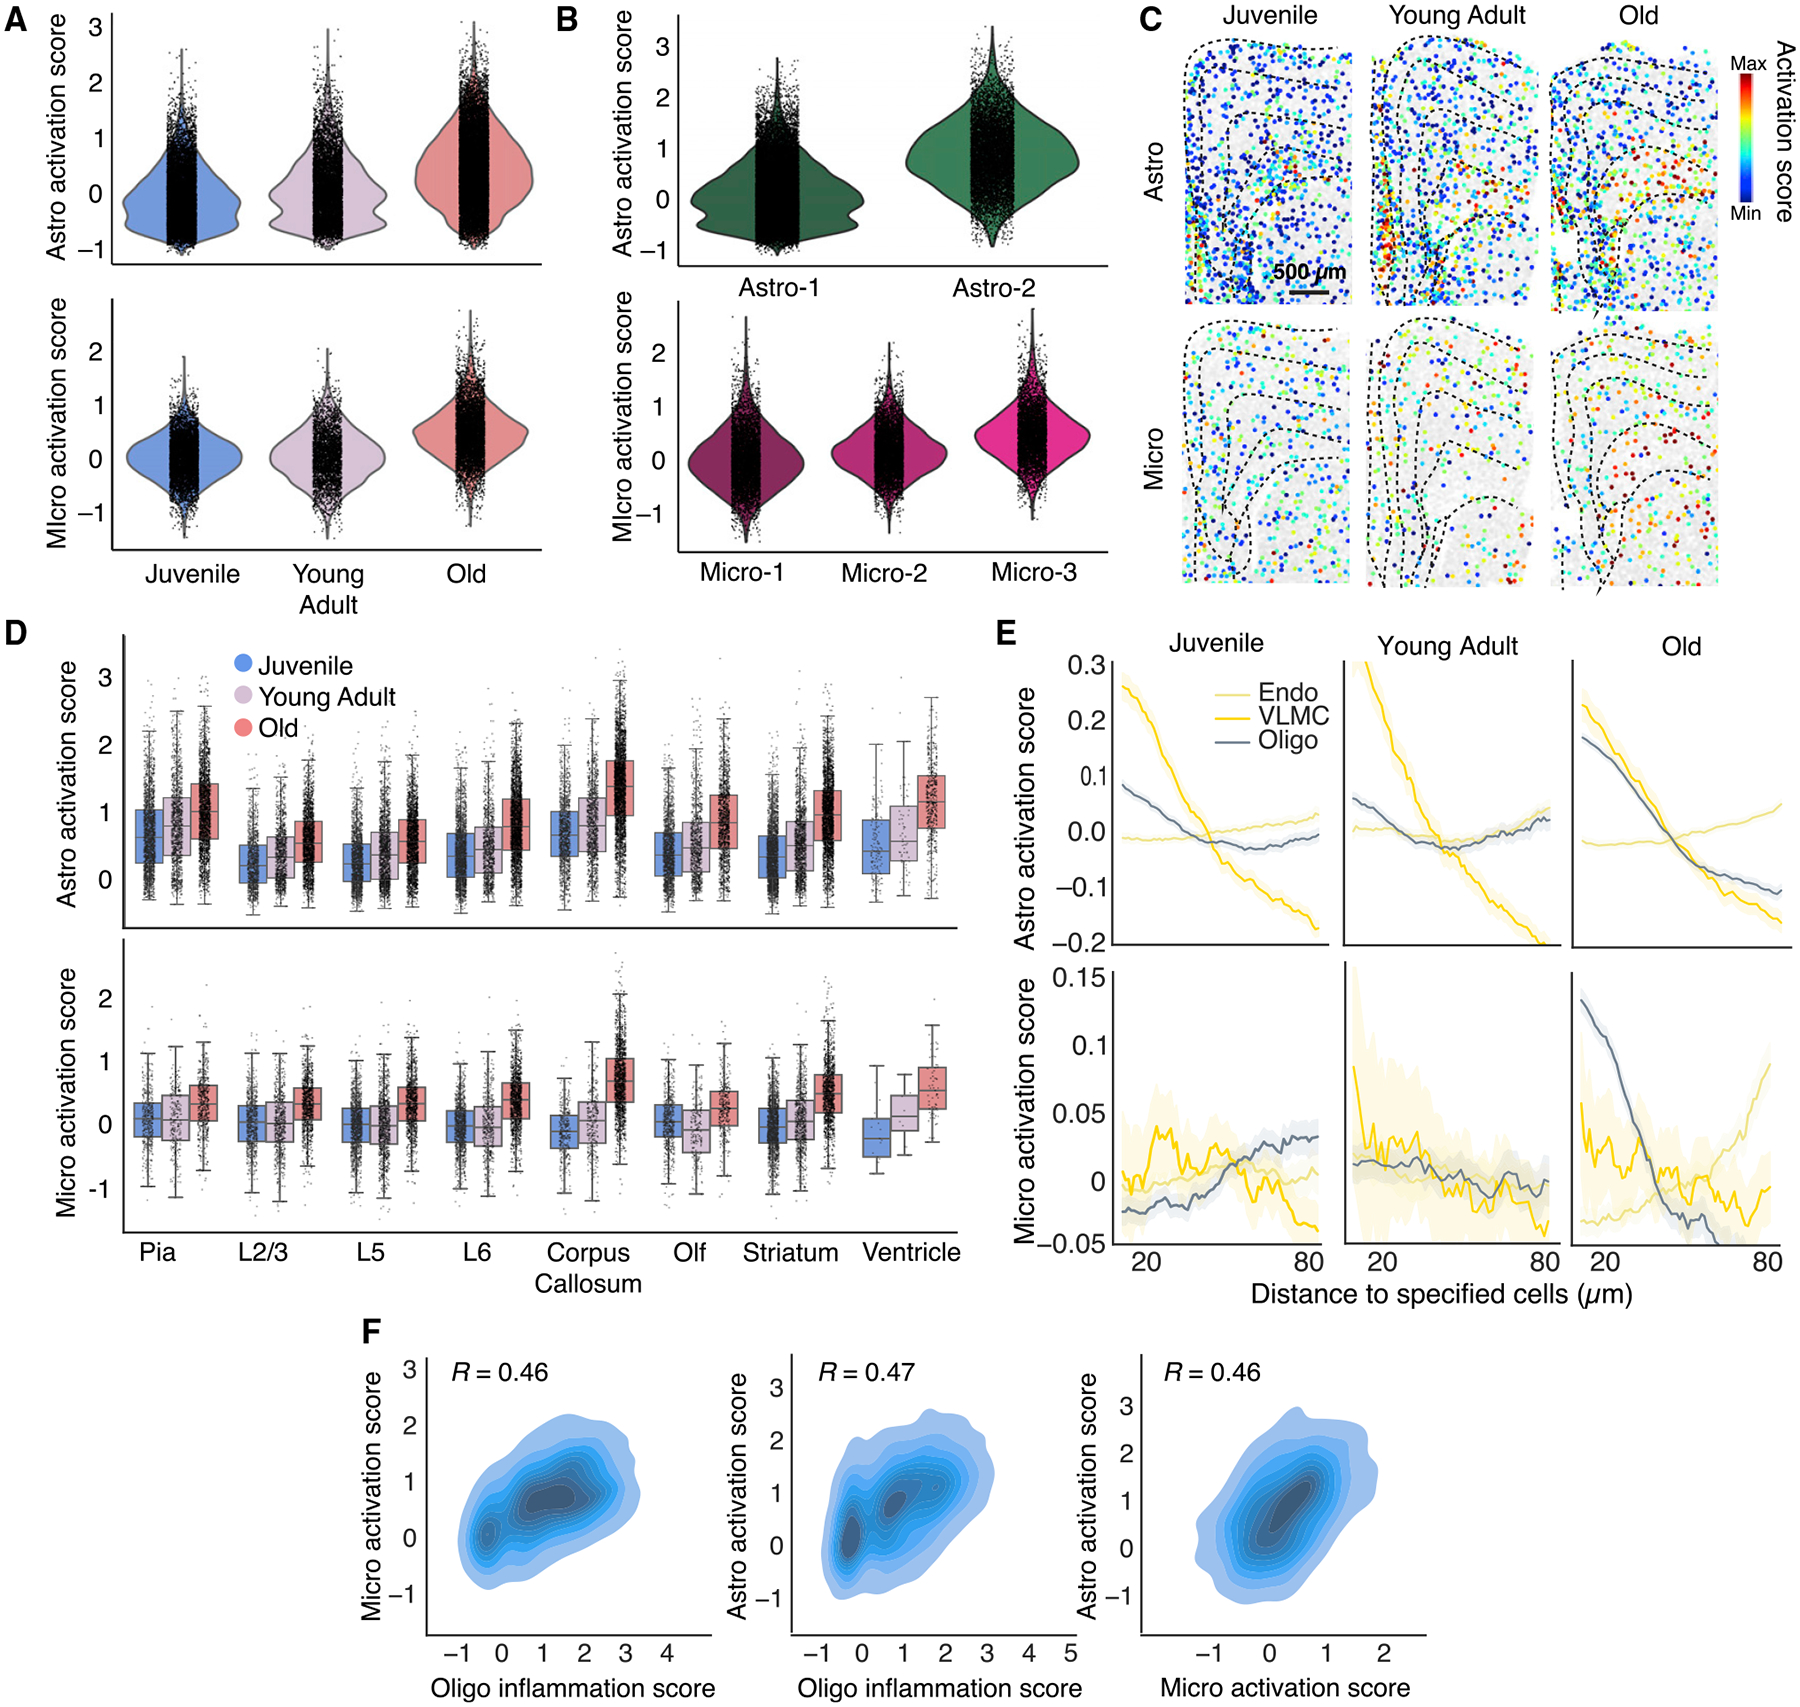
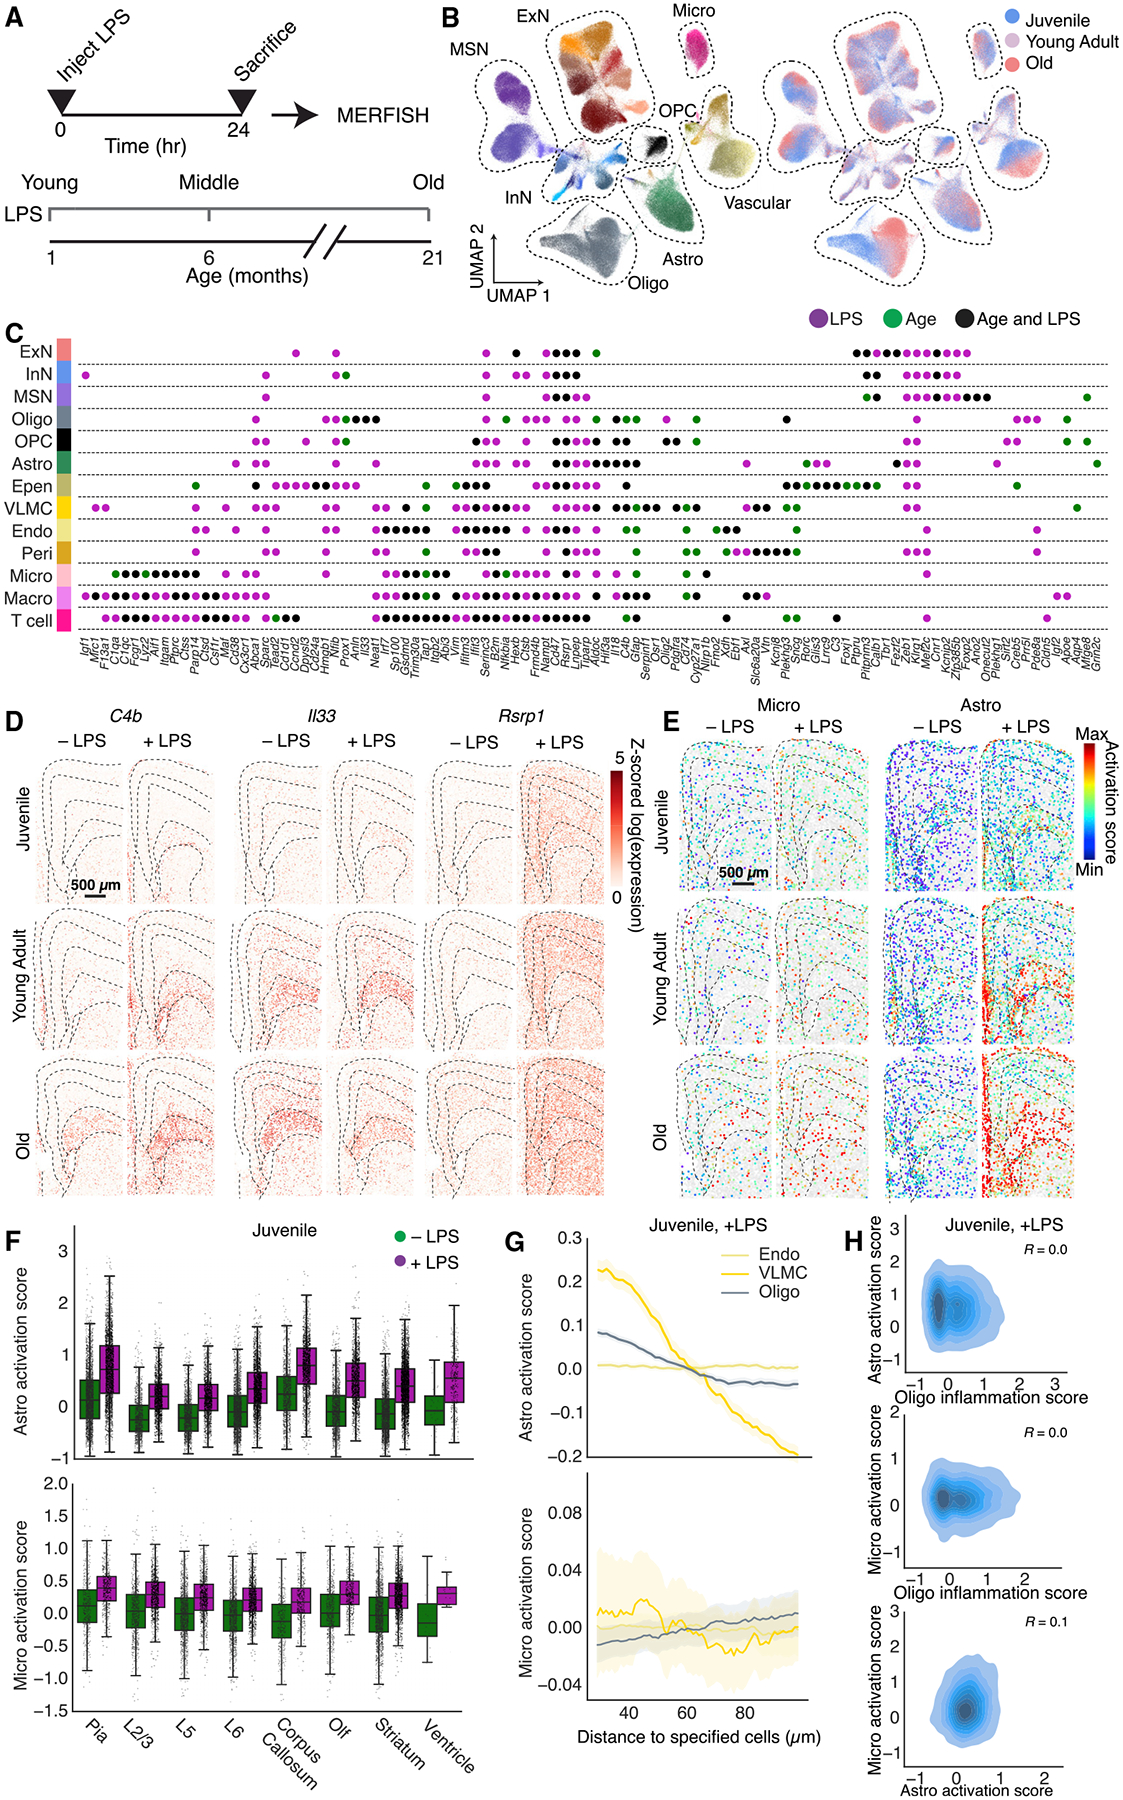
The diversity and complex organization of cells in the brain have hindered systematic characterization of age-related changes in its cellular and molecular architecture, limiting our ability to understand the mechanisms underlying its functional decline during aging. Here, we generated a high-resolution cell atlas of brain aging within the frontal cortex and striatum using spatially resolved single-cell transcriptomics and quantified changes in gene expression and spatial organization of major cell types in these regions over the mouse lifespan. We observed substantially more pronounced changes in cell state, gene expression, and spatial organization of non-neuronal cells over neurons. Our data revealed molecular and spatial signatures of glial and immune cell activation during aging, particularly enriched in the subcortical white matter, and identified both similarities and notable differences in cell-activation patterns induced by aging and systemic inflammatory challenge. These results provide critical insights into age-related decline and inflammation in the brain.

Keywords: LPS; MERFISH; astrocyte; brain aging; inflammation; microglia; oligodendrocyte; single-cell RNA sequencing; single-cell transcriptomics; spatial transcriptomics.


Conflict of interest statement

Declaration of interests X.Z. is an inventor of patents applied for by Harvard University related MERFISH, a co-founder and consultant of Vizgen, Inc., and a member of the Cell advisory board.

Figures

Figure 1.
Figure 1.. Spatially resolved single-cell transcriptomic profiling of the mouse frontal cortex and striatum across ages
(A) Profiling of the mouse frontal cortex and striatum via integrated snRNA-seq and MERFISH analyses. (B) Sampling time points for snRNA-seq and MERFISH measurements across the lifespan of mice. (C) (Left) uniform manifold approximation (UMAP) visualization of cells from all timepoints, from both snRNA-seq and MERFISH measurements. (Right) separate UMAP of cells measured by snRNA-seq (top) and MERFISH (bottom). Cells are colored by cell-type assignment. (D) (Left) as in (C) but with cells colored by age. Only the juvenile and old time points are shown. (Right) Individual UMAP plots, shown as the density of cells at each time point overlaid on total cell population across all three ages (gray). (E) Molecularly defined cell types determined from integrated snRNA-seq and MERFISH clustering analysis. (Top) dendrogram of the hierarchical relationship among clusters and number of measured cells per cluster in snRNA-seq and MERFISH. (Middle) expression of example marker genes for different cell types. (Bottom) fraction of cells per cluster by age and by modality, normalized to sampling depth such that equal representation in each condition will have the same fraction. See also Figures S1 and S2 and Tables S1–S3.
Figure 2.
Figure 2.. Changes in cell-type and cell-state composition of the mouse frontal cortex and striatum across ages
(A) Density of different major cell types (in cells/mm2) across the three ages. Inset shows magnified view of lower abundance cell types. * indicates FDR-adjusted p-value < 0.05 (independent sample t-test) in the difference between juvenile and old animals. Data are presented as mean ±95% confidence interval. (B) Fraction of cells that belong to different states of oligodendrocytes, microglia, endothelial cells, and astrocytes across different ages. (C) Violin plot of expression of example genes across different states of oligodendrocytes, microglia, endothelial cells, and astrocytes. See also Tables S1–S3.
Figure 3.
Figure 3.. Spatial organization of cells in the mouse frontal cortex and striatum across ages
(A) (Left) spatial segmentation of anatomical regions. (Right) spatial organization of major cell types at the three different ages, colored by cluster identity. Dashed lines outlining anatomical regions were manually traced from spatial segmentation. Scale bar: 500 μm. (B) Fraction of cells resided in individual anatomical regions for each cell cluster at the three different ages. CC: corpus callosum. Olf: subcortical olfactory areas. The lower abundance of ependymal cells in younger animals may be due to classification as molecularly similar astrocytes or loss of ventricle surface during tissue sectioning. (C–F) Spatial organizations of oligodendrocyte (C), astrocyte (D), microglial (E), and endothelial (F) clusters at different ages. Scale bar: 500 μm. See also Figure S3 and Tables S1–S3.
Figure 4.
Figure 4.. Cell-type-specific changes in molecular signatures across ages
(A) Number of differentially expressed (DE) genes between juvenile and old animals in individual cell clusters, with genes up- and downregulated with age shown in red and blue bars, respectively. DE genes were defined as genes with age-related change in log(gene expression) > 2 (light colored bars) or >2.5 (dark colored bars) and FDR-adjusted p-value < 0.05 between the two ages. (B) Age-related change in Z-scored log(gene expression) between juvenile and old animals for DE genes in different cell clusters. (C) −log10(p-value) of enrichment for gene ontology (GO) biological process terms and Kyoto Encyclopedia of Genes and Genomes (KEGG) terms enriched among DE genes with an age-related change in log(gene expression) > 2 and FDR-adjusted p-value < 0.05 between the two ages (juvenile and old). Only top 10 (or fewer) GO or KEGG terms with p-value < 0.05 are listed for each major cell class. (D) Spatial maps of examples of DE genes across the three different ages, showing the expression of each gene within the indicated cell type. Gray spots indicate all other cells of other types.. Scale bar: 500 μm. (E) Quantification of the number of DE genes for each major cell type as a function of spatial location using imputed gene expression data derived from Harmony integration. DE genes with an age-related change in log(gene expression) > 2 and FDR-adjusted p-values < 0.05 are considered. Size of dot indicates total number of DE genes for a particular cell type within a region, and color shade of dot indicates the fraction within a particular region of the total number of DE genes that are differentially expressed across all regions, plotted on a relative scale of minimum fraction to maximum fraction across all regions. See also Figures S2 and S4 and Tables S1–S3.
Figure 5.
Figure 5.. Spatially heterogeneous and cell-type-specific inflammatory activation signatures of brain aging
(A) Activation scores of all astrocytes and microglia across the three different ages. Activation score is defined as the summed expression of a cell-type-specific subset of gene related to inflammatory activation, relative to background of randomly selected genes (STAR Methods). (B) Activation scores of specific astrocyte and microglia clusters. (C) Spatial maps of activation scores of astrocytes and microglia across the three different ages. Cells are colored by activation scores. Scale bar: 500 μm. (D) Per-cell activation scores of astrocytes and microglia in different anatomical regions across three ages. Data are presented as boxplots, with the box showing median and interquartile range and the whiskers showing minimum and maximum. (E) Average activation scores of astrocytes and microglia as a function of distance from neighboring oligodendrocytes, VLMCs, and endothelial cells across three ages. A constant that equals to the mean activation score across all distances is subtracted from each curve, and these constants for different curves are shown in STAR Methods. Data are presented as mean (solid line) ± SEM (shade). (F) (Left) correlation of activation scores of each microglial cell in corpus callosum with the average inflammation scores of oligodendrocytes within 30 μm of that microglial cell. (Middle) same as (left) but for astrocytes and oligodendrocytes. (Right) same as (left) but for astrocytes and microglia. Pearson correlation coefficients R are given. See also Figure S5 and Tables S1–S3.
Figure 6.
Figure 6.. Gene expression changes and activations of cells in response to systemic inflammatory challenge by LPS treatment
(A) Experimental scheme. (B) UMAP of cells colored by cell types (left) or ages (right) measured by MERFISH. (C) Genes substantially upregulated in response to LPS (magenta), age (green), or both LPS and age (black) for different cell types measured by MERFISH. Genes are considered substantially upregulated only if the change in Z-scored log(gene expression) is >2 with an FDR-adjusted p value <10–4. Only genes substantially upregulated in at least one condition for at least one cell type are shown. (D) Spatial maps of example genes that are upregulated with age and upon LPS treatment, showing the expression of the indicated gene across all cells within a section. Scale bar: 500 μm. (E) Spatial maps of activated microglia and astrocytes across the three different ages, with and without LPS treatment. Cells are colored by activation scores. Scale bar: 500 μm. (F) Per-cell activation scores for microglia and astrocytes in different anatomical regions in juvenile mice with LPS treatment. Boxplots are as defined in Figure 5D. (G) Activation scores of astrocytes and microglia as a function of distance from neighboring oligodendrocytes, VMLCs, and endothelial cells in juvenile mice after LPS treatment, as in Figure 5E. Data are presented as mean (solid line) ± SEM (shade). (H) Correlation of activation scores of microglia and astrocytes and inflammation score of oligodendrocytes, as in Figure 5F, in juvenile animals treated with LPS. See also Figures S6 and S7 and Tables S1–S3.

References

    1. Yankner BA, Lu T, and Loerch P (2008). The aging brain. Annu. Rev.Pathol 3, 41–66. 10.1146/annurev.pathmechdis.2.010506.092044. - DOI - PubMed
    1. Bishop NA, Lu T, and Yankner BA (2010). Neural mechanisms of ageing and cognitive decline. Nature 464, 529–535. 10.1038/nature08983. - DOI - PMC - PubMed
    1. Lindenberger U (2014). Human cognitive aging: corriger la fortune? Science 346, 572–578. 10.1126/science.1254403. - DOI - PubMed
    1. Mosher KI, and Wyss-Coray T (2014). Microglial dysfunction in brain aging and alzheimer’s disease. Biochem. Pharmacol 88, 594–604. 10.1016/j.bcp.2014.01.008. - DOI - PMC - PubMed
    1. Ransohoff RM (2016). How neuroinflammation contributes to neurodegeneration. Science 353, 777–783. 10.1126/science.aag2590. - DOI - PubMed

Publication types