. 2023 Jan 10;56(1):207-223.e8.
doi: 10.1016/j.immuni.2022.12.007. Epub 2022 Dec 28.

Small intestine and colon tissue-resident memory CD8+ T cells exhibit molecular heterogeneity and differential dependence on Eomes

Affiliations

Small intestine and colon tissue-resident memory CD8+ T cells exhibit molecular heterogeneity and differential dependence on Eomes

Yun Hsuan Lin et al. Immunity. .

Abstract

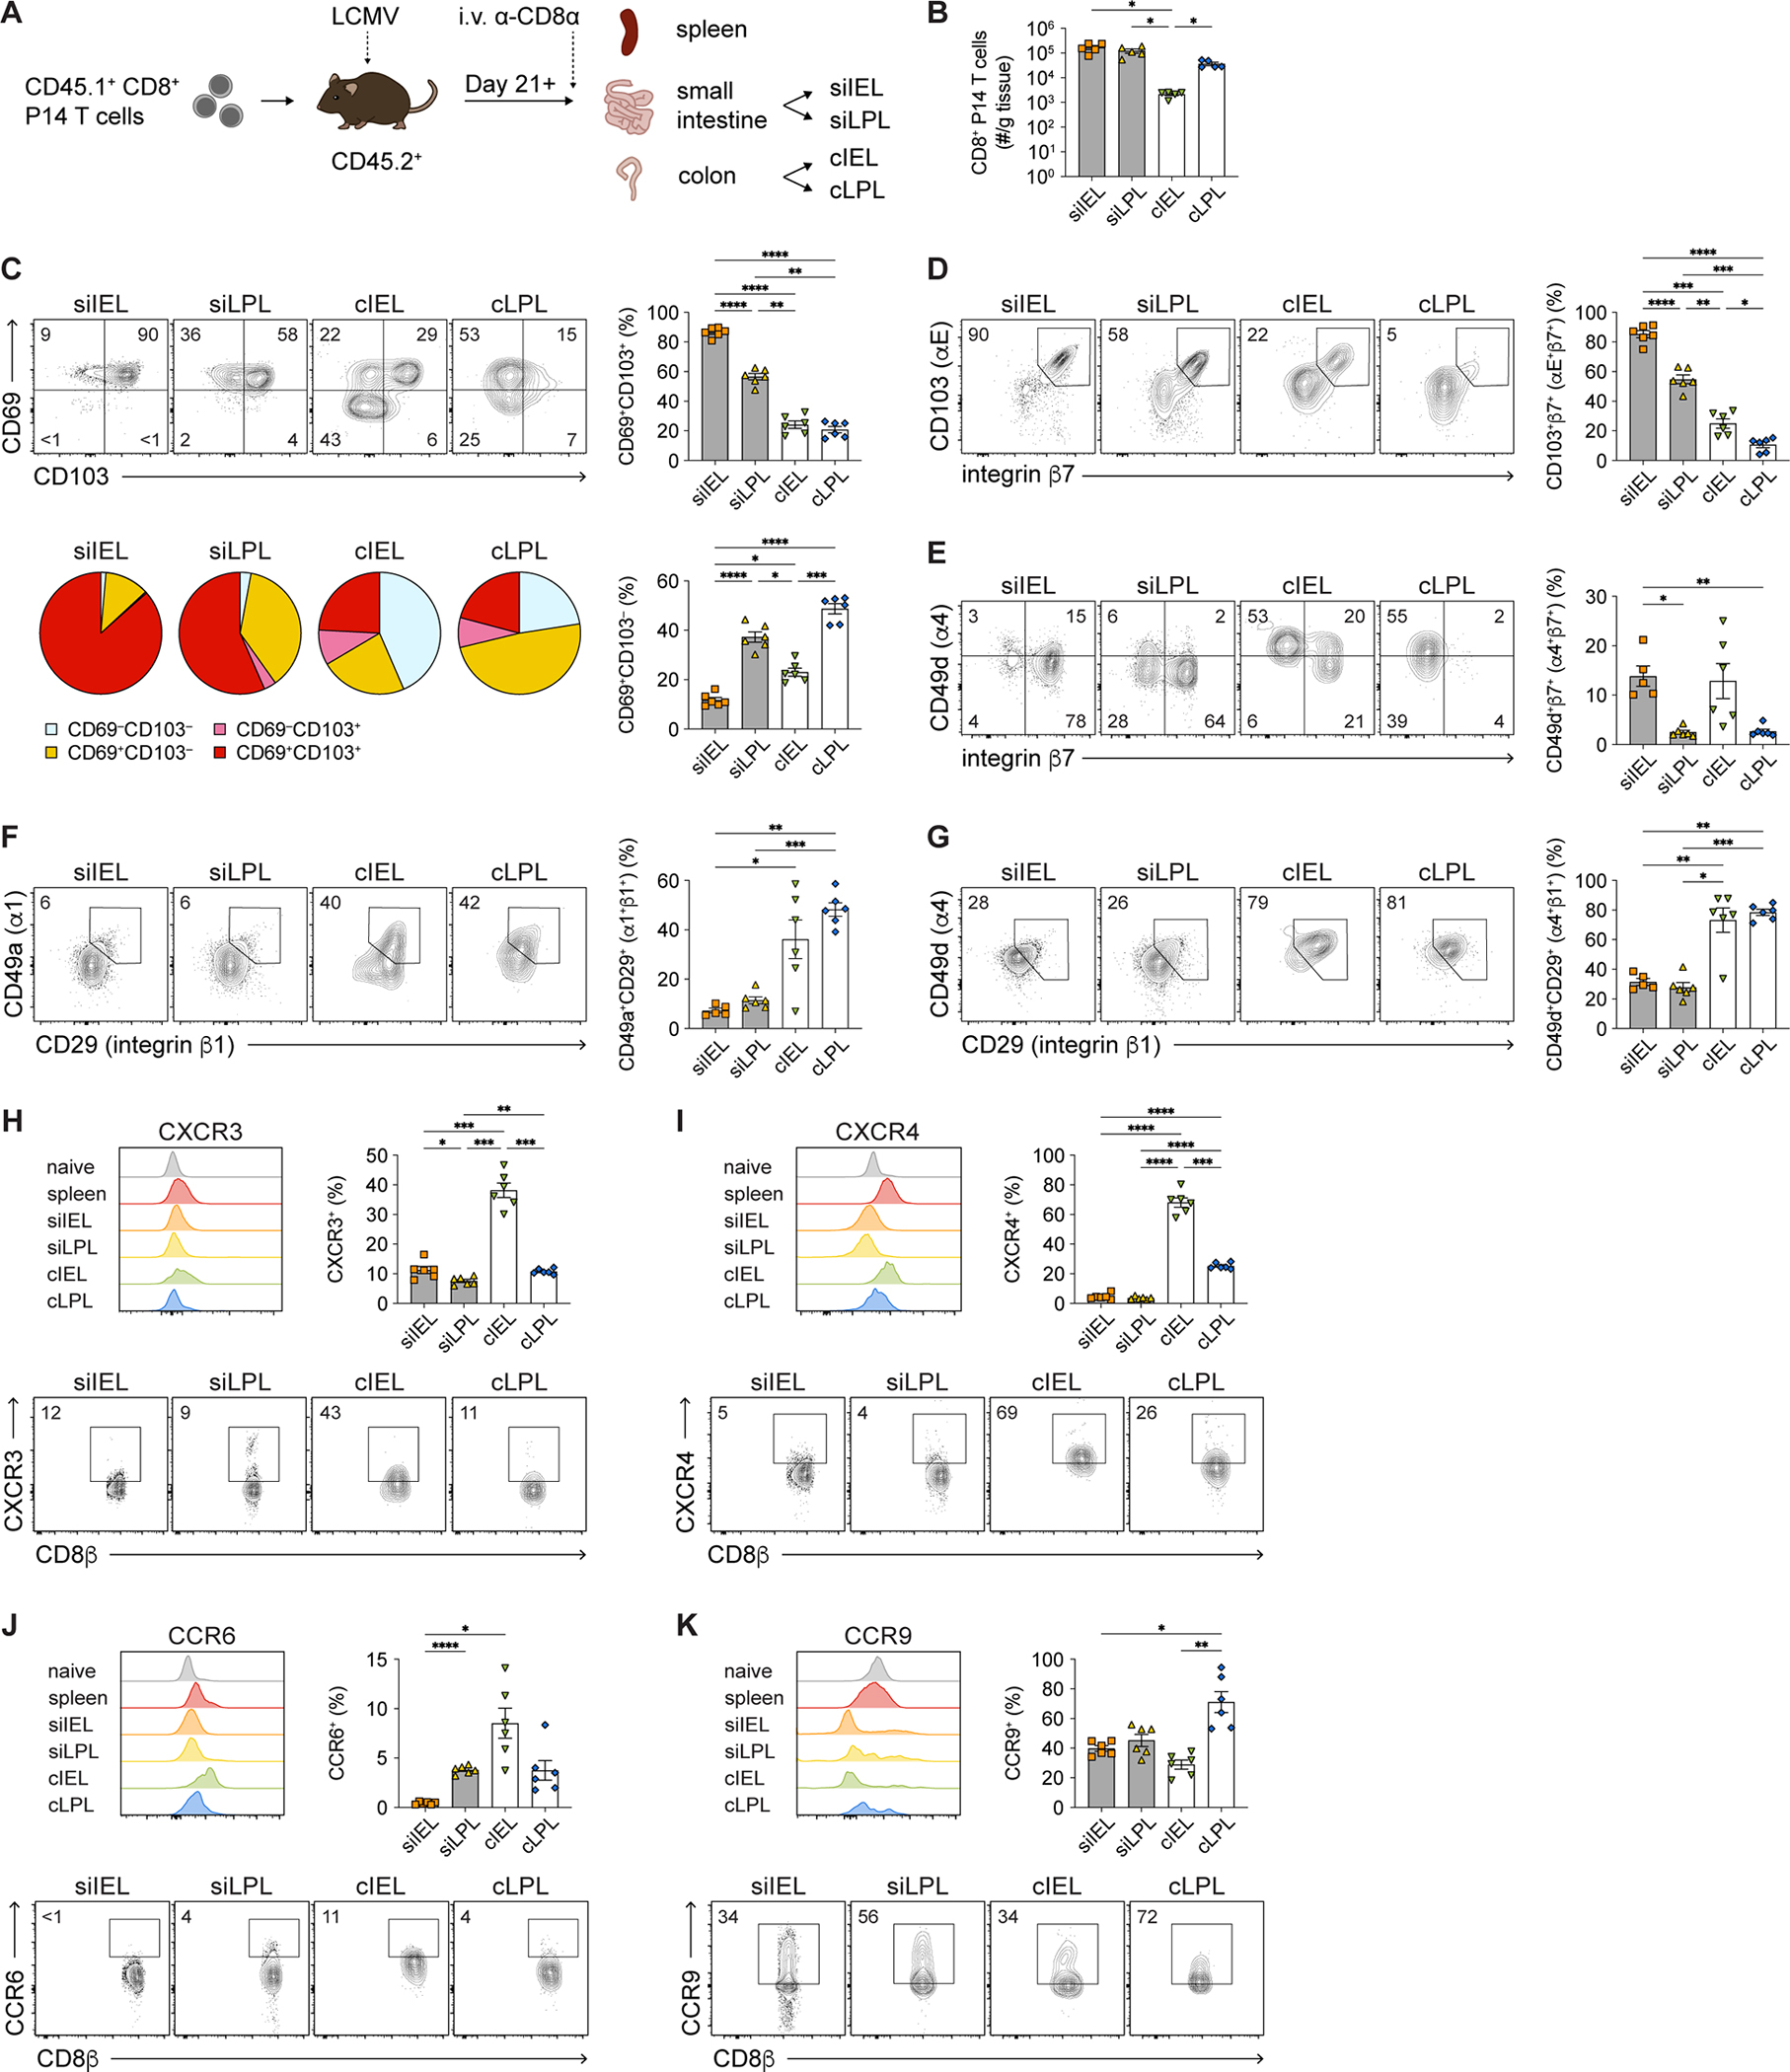
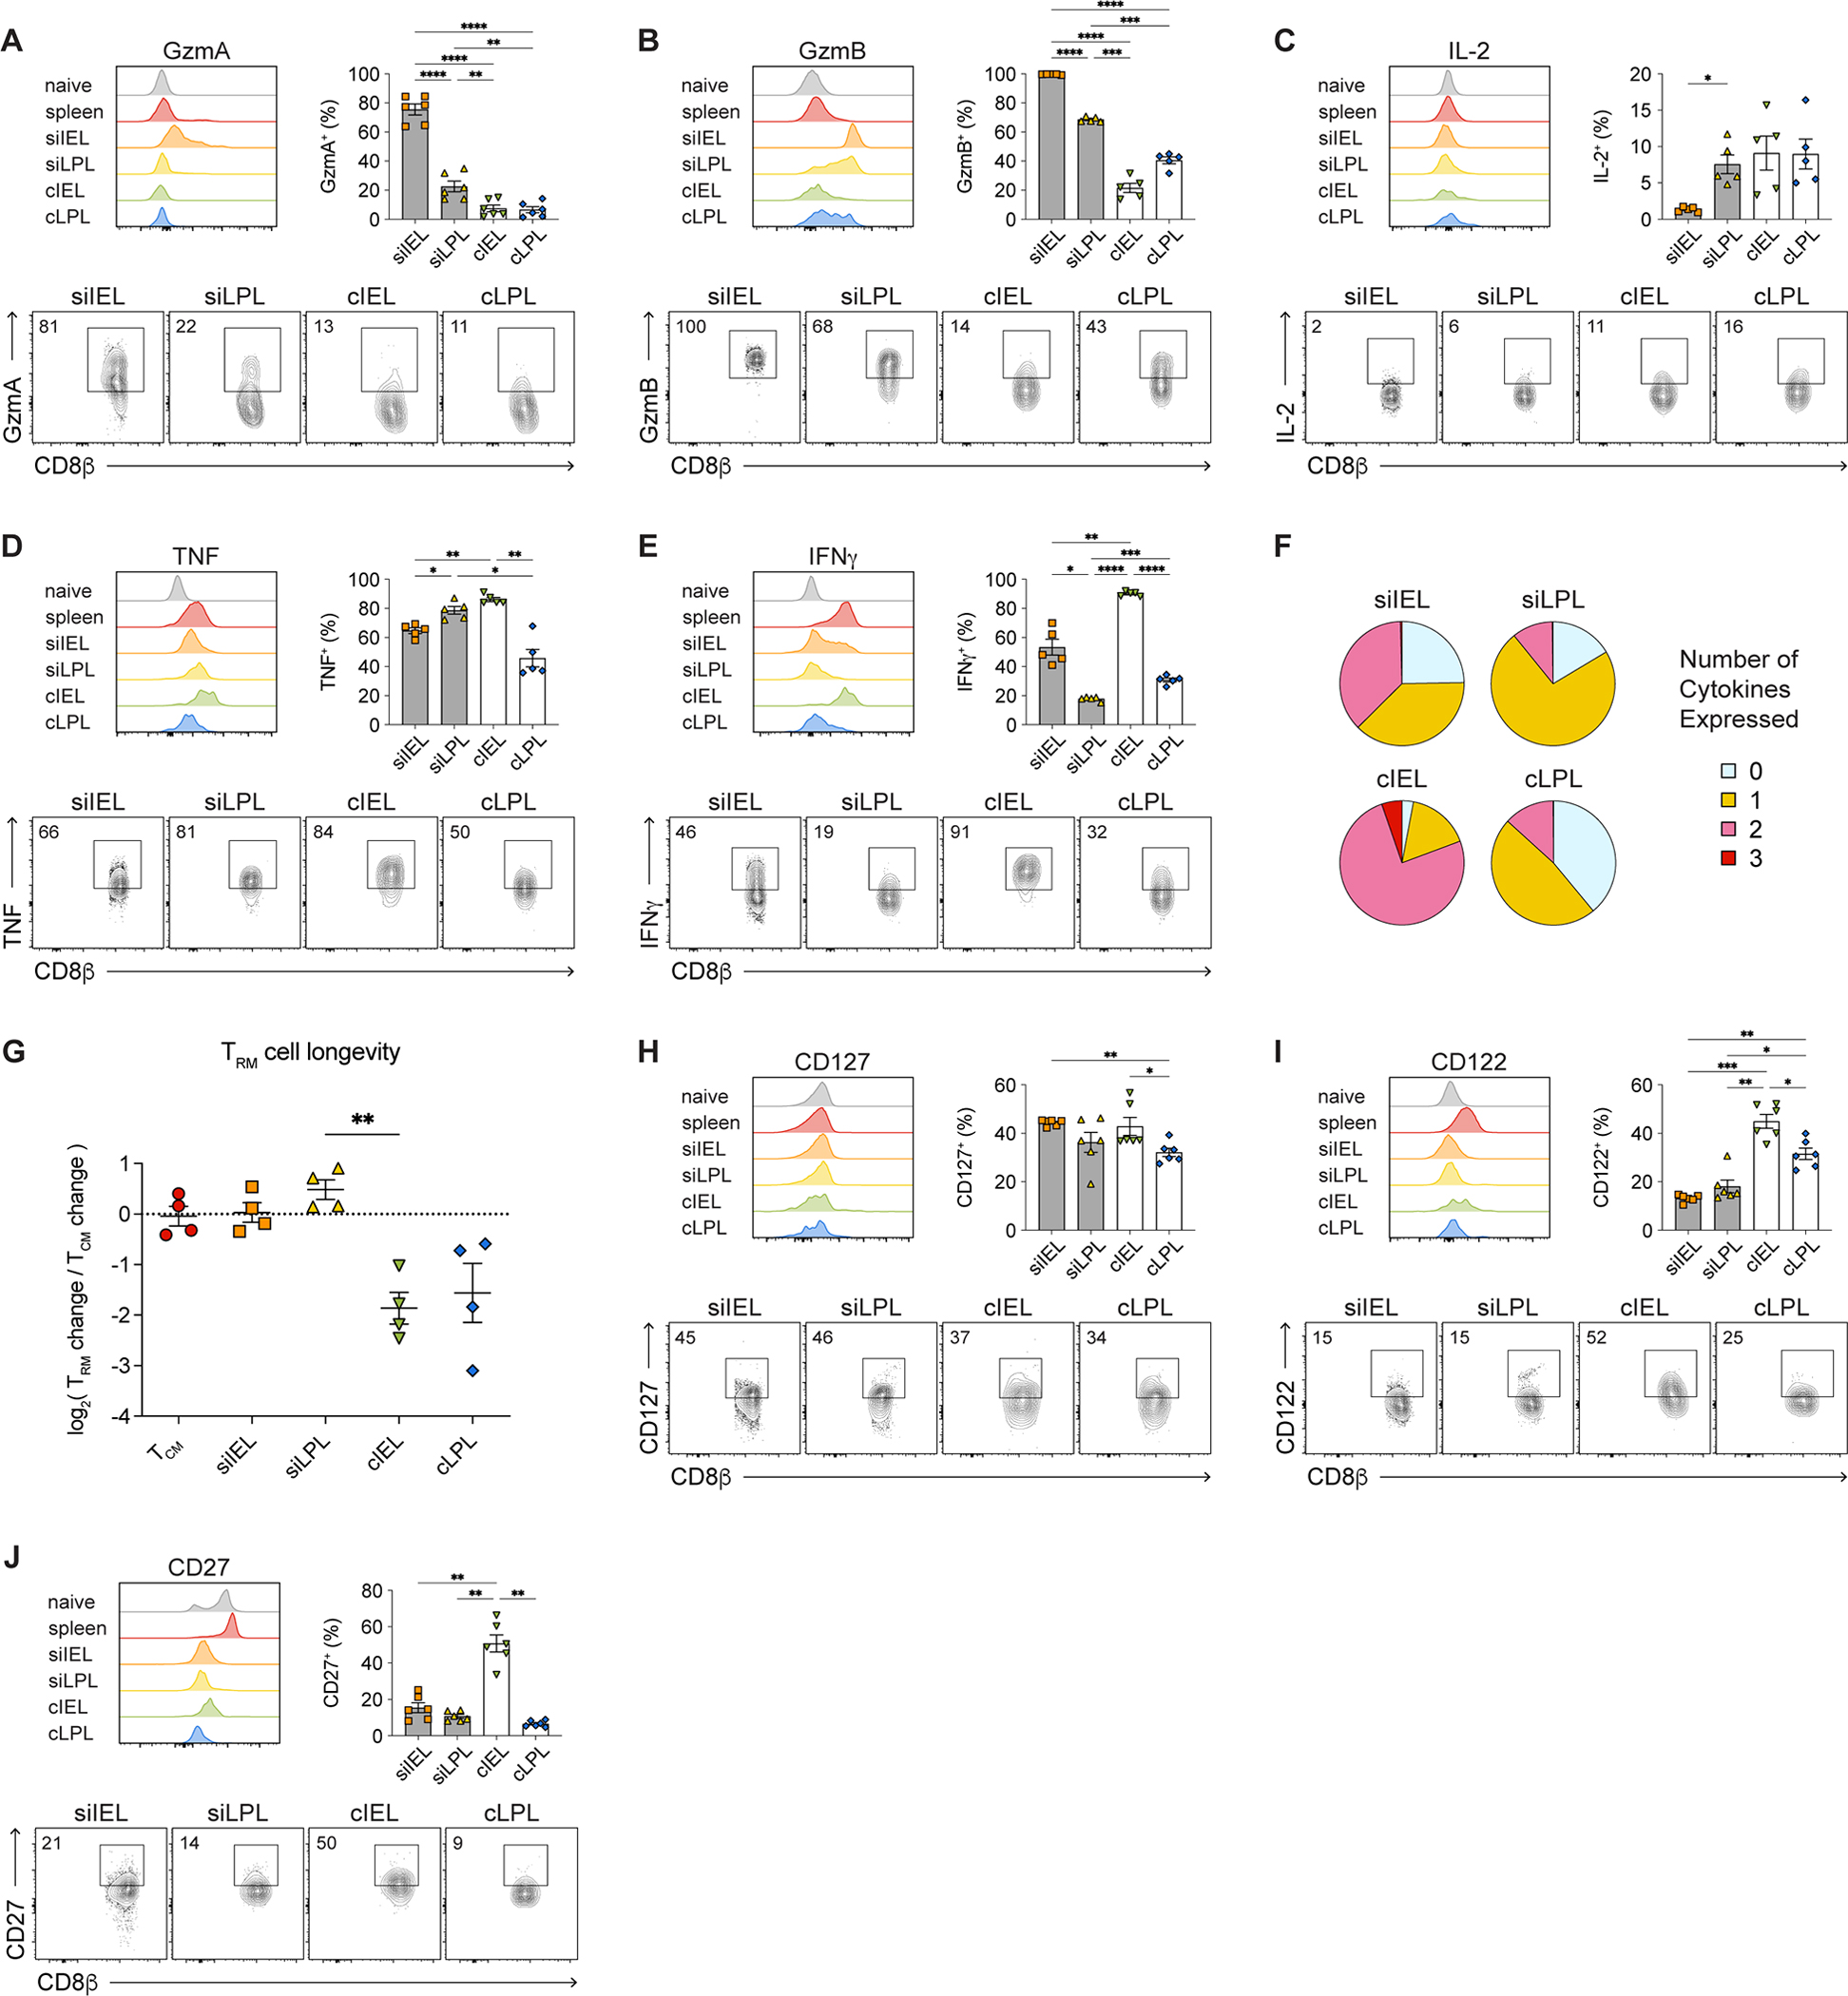
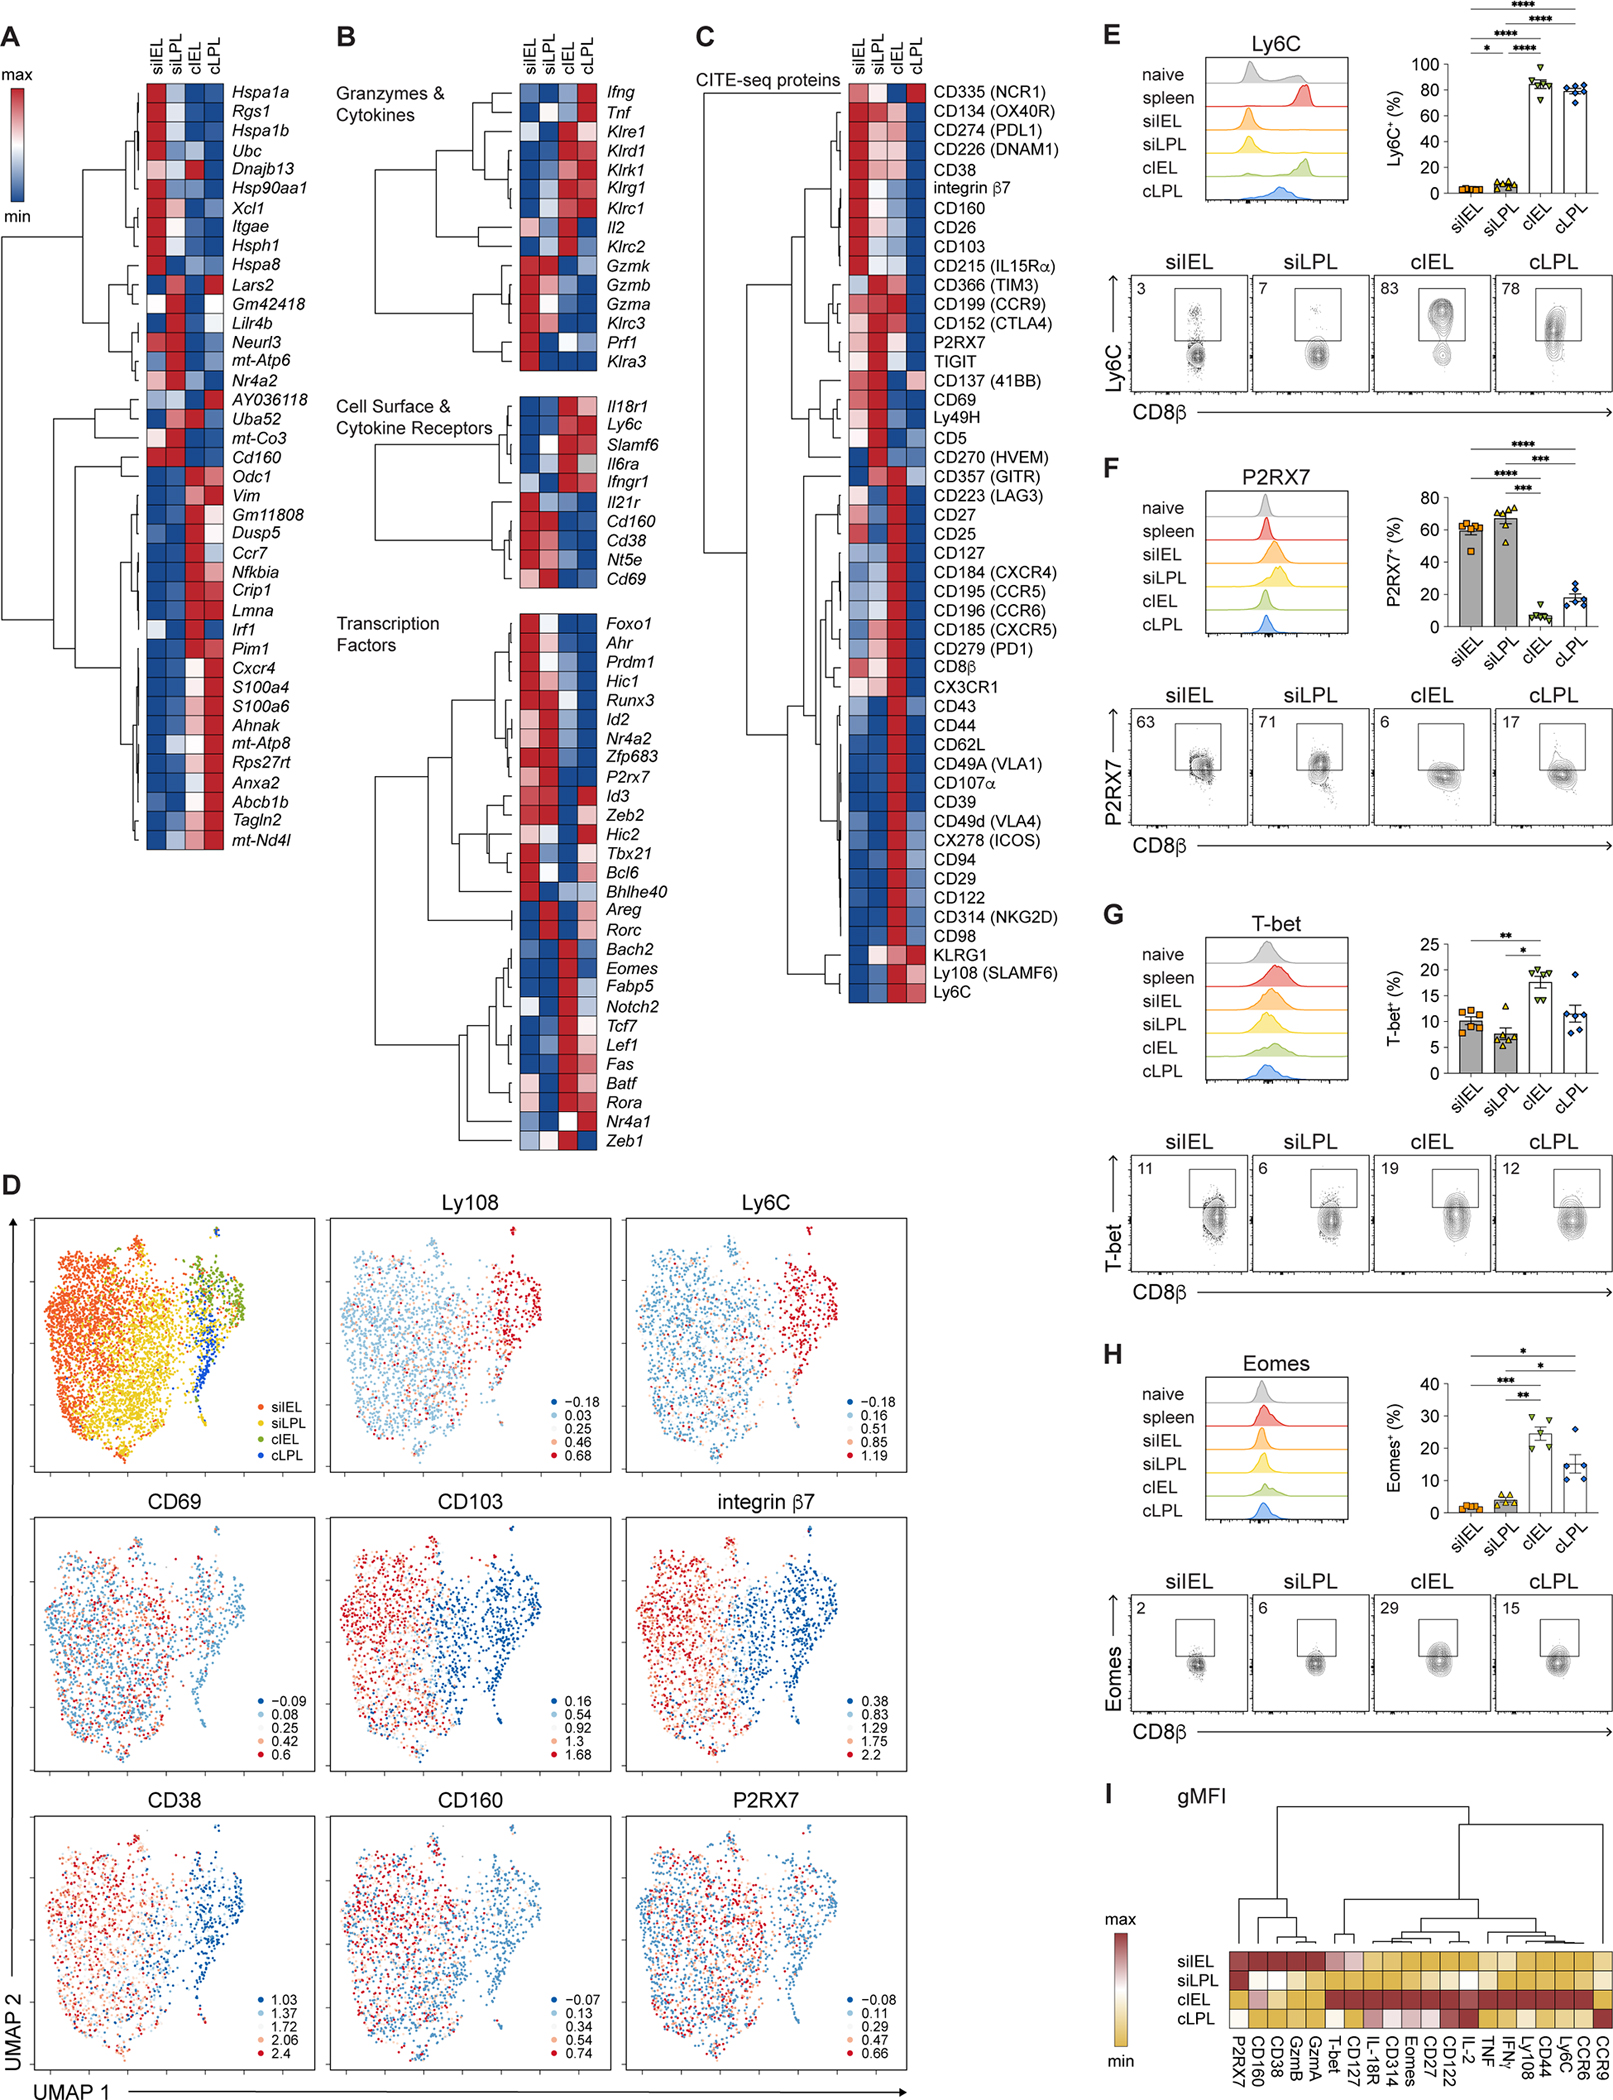
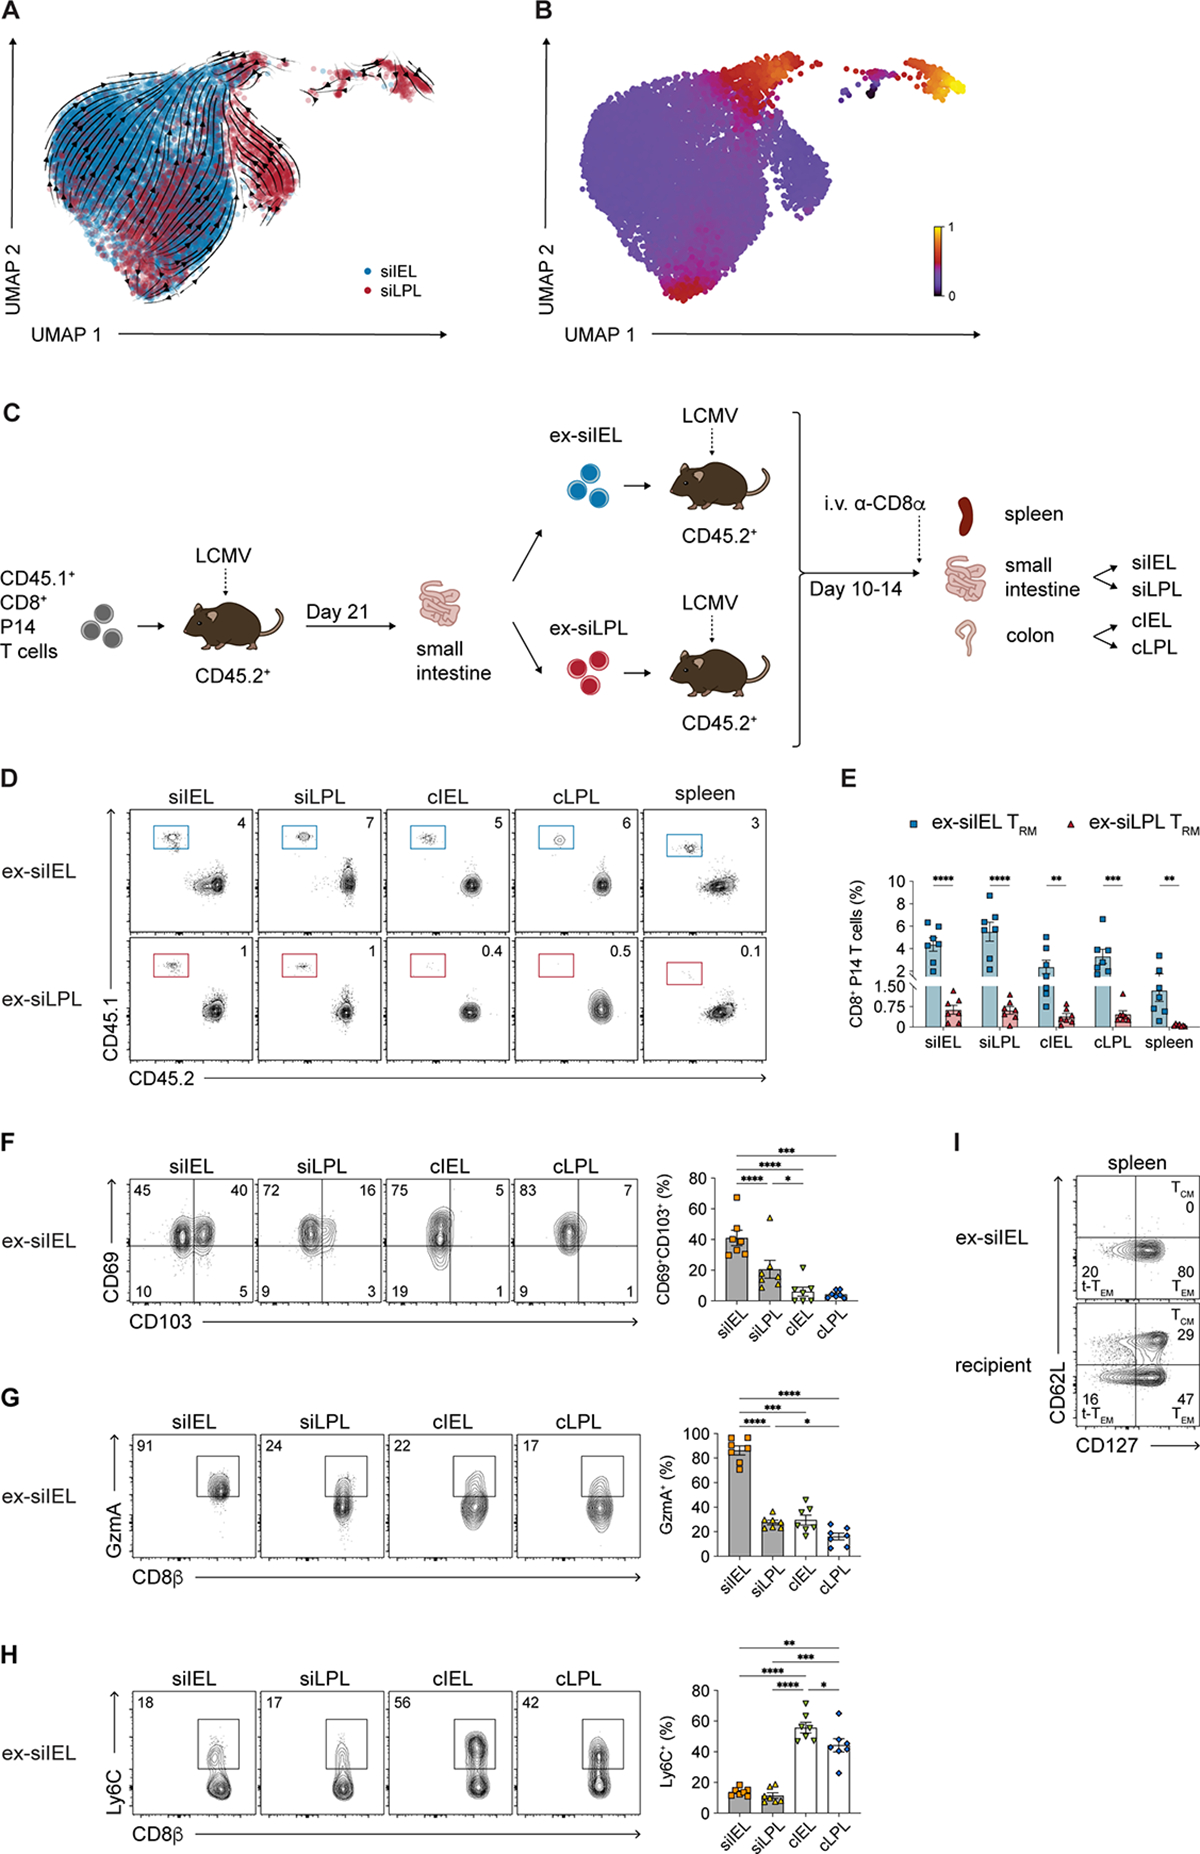
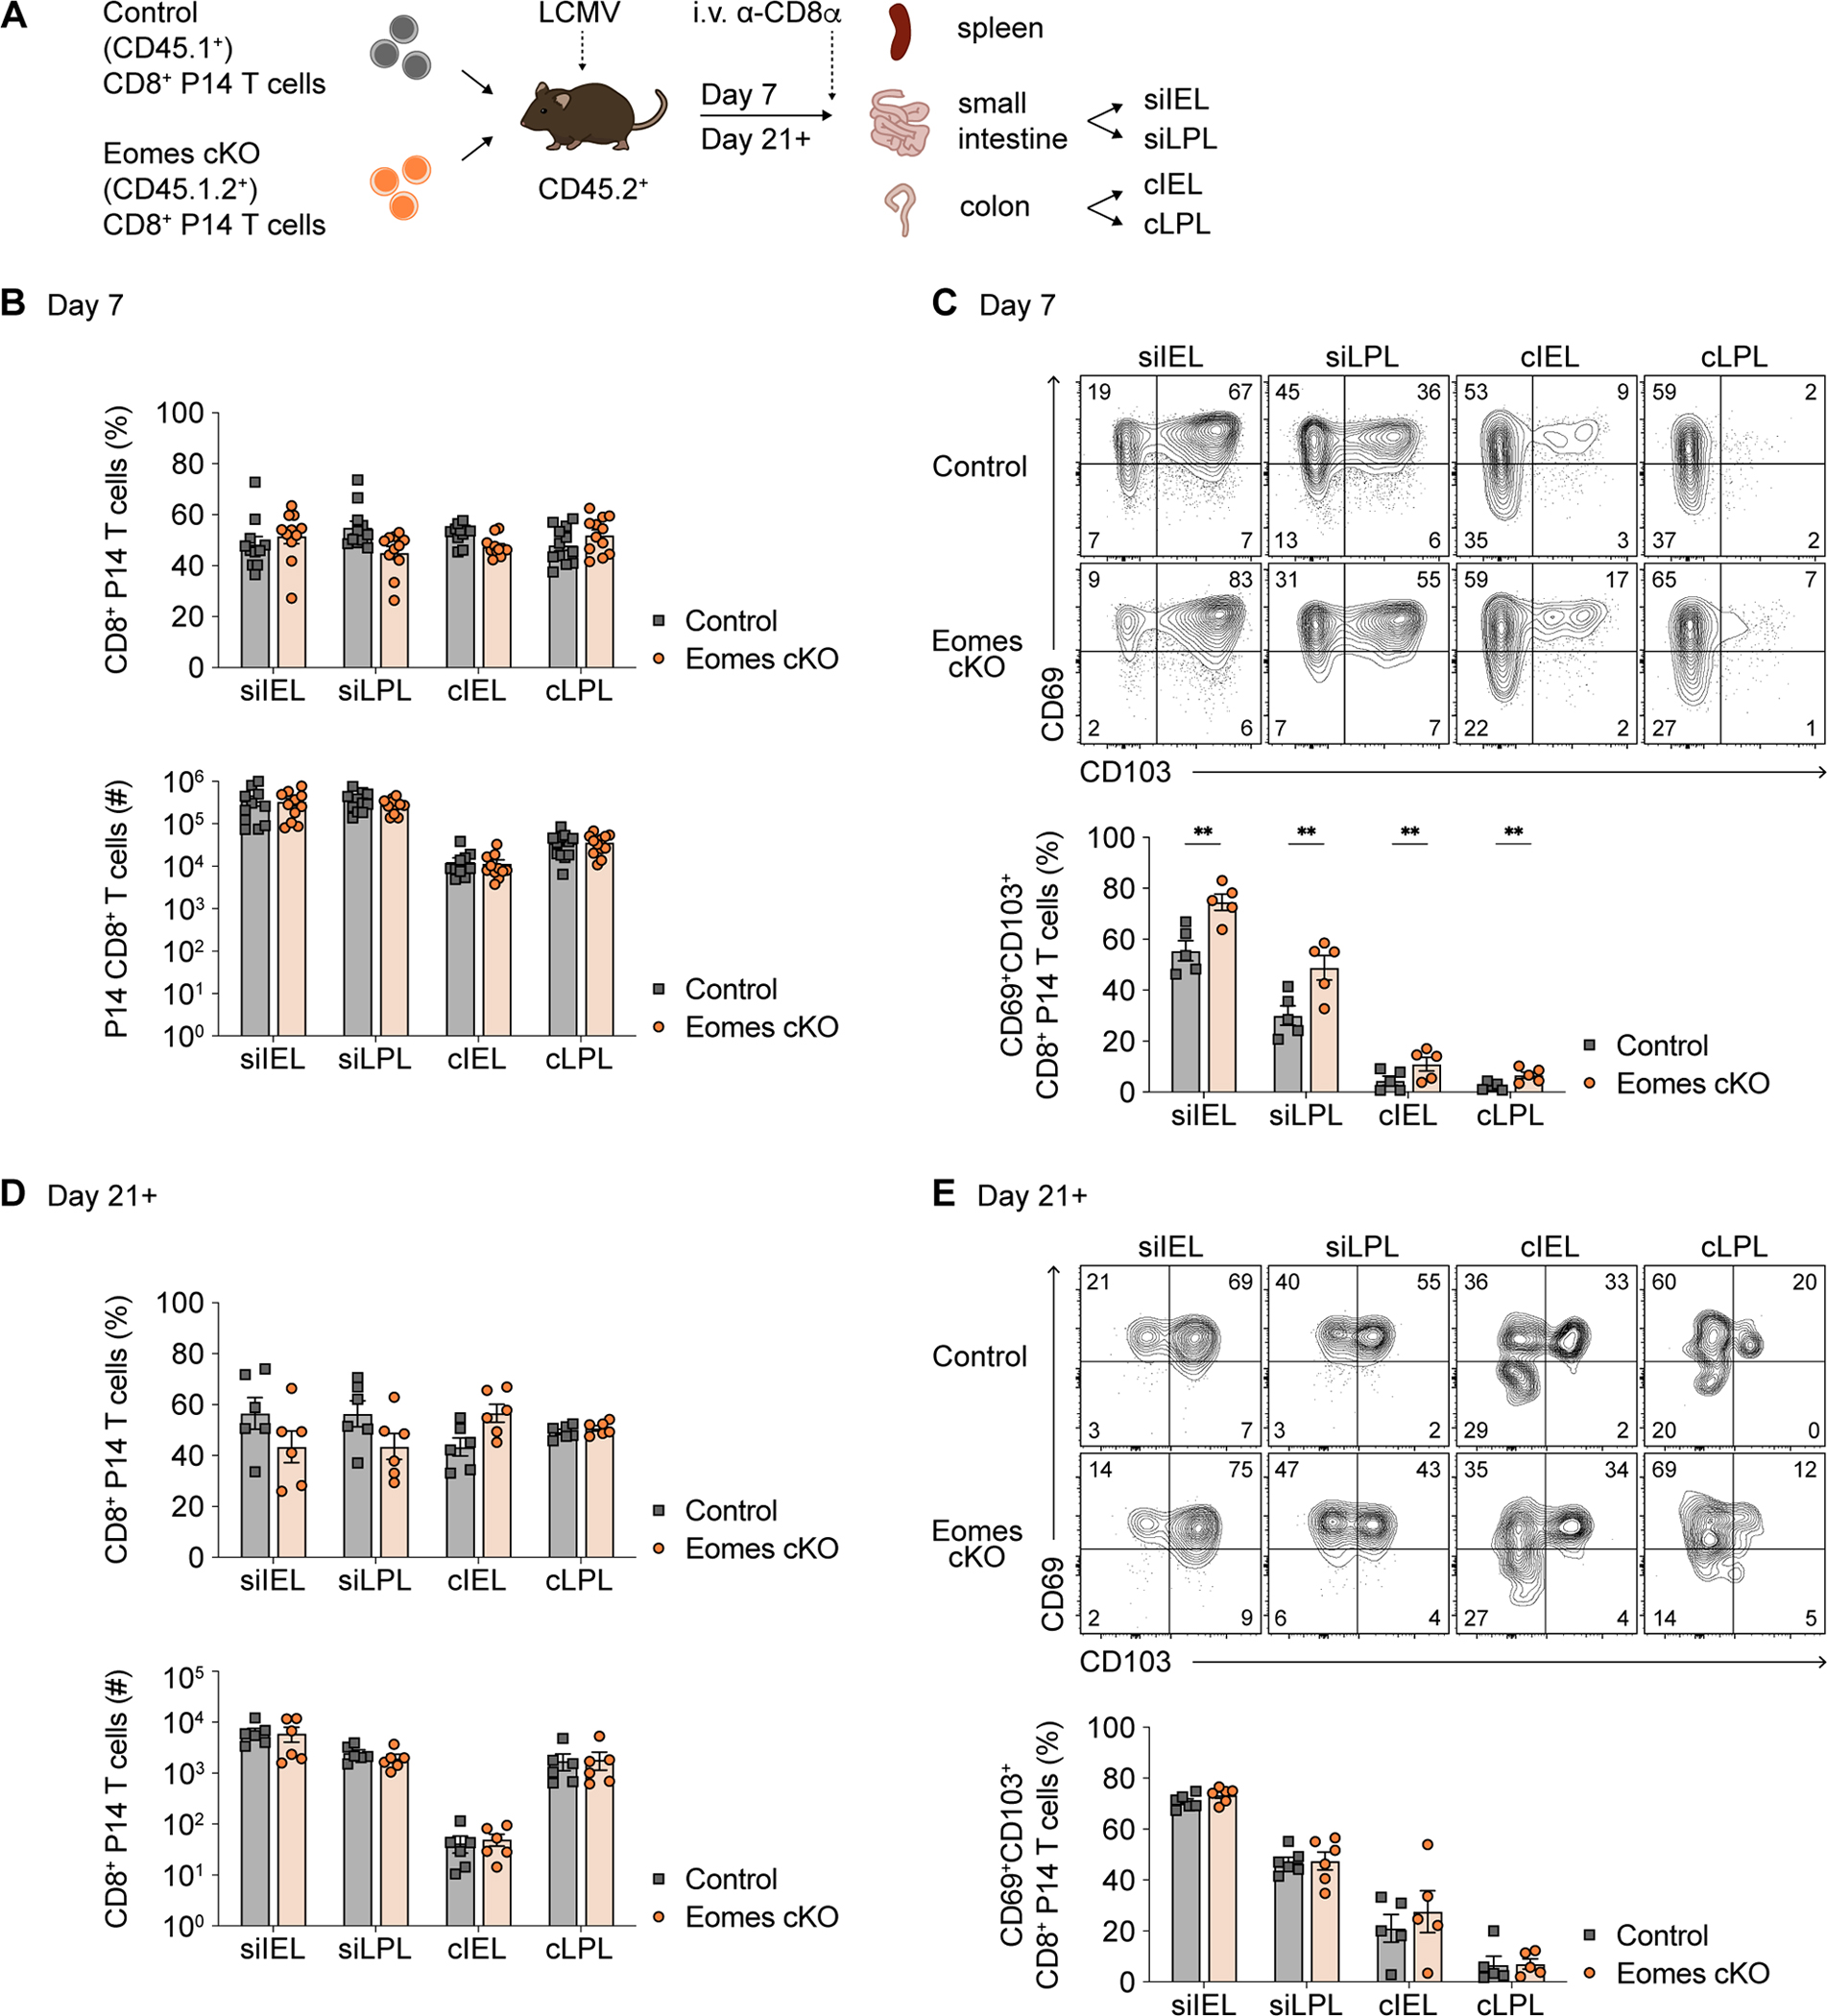
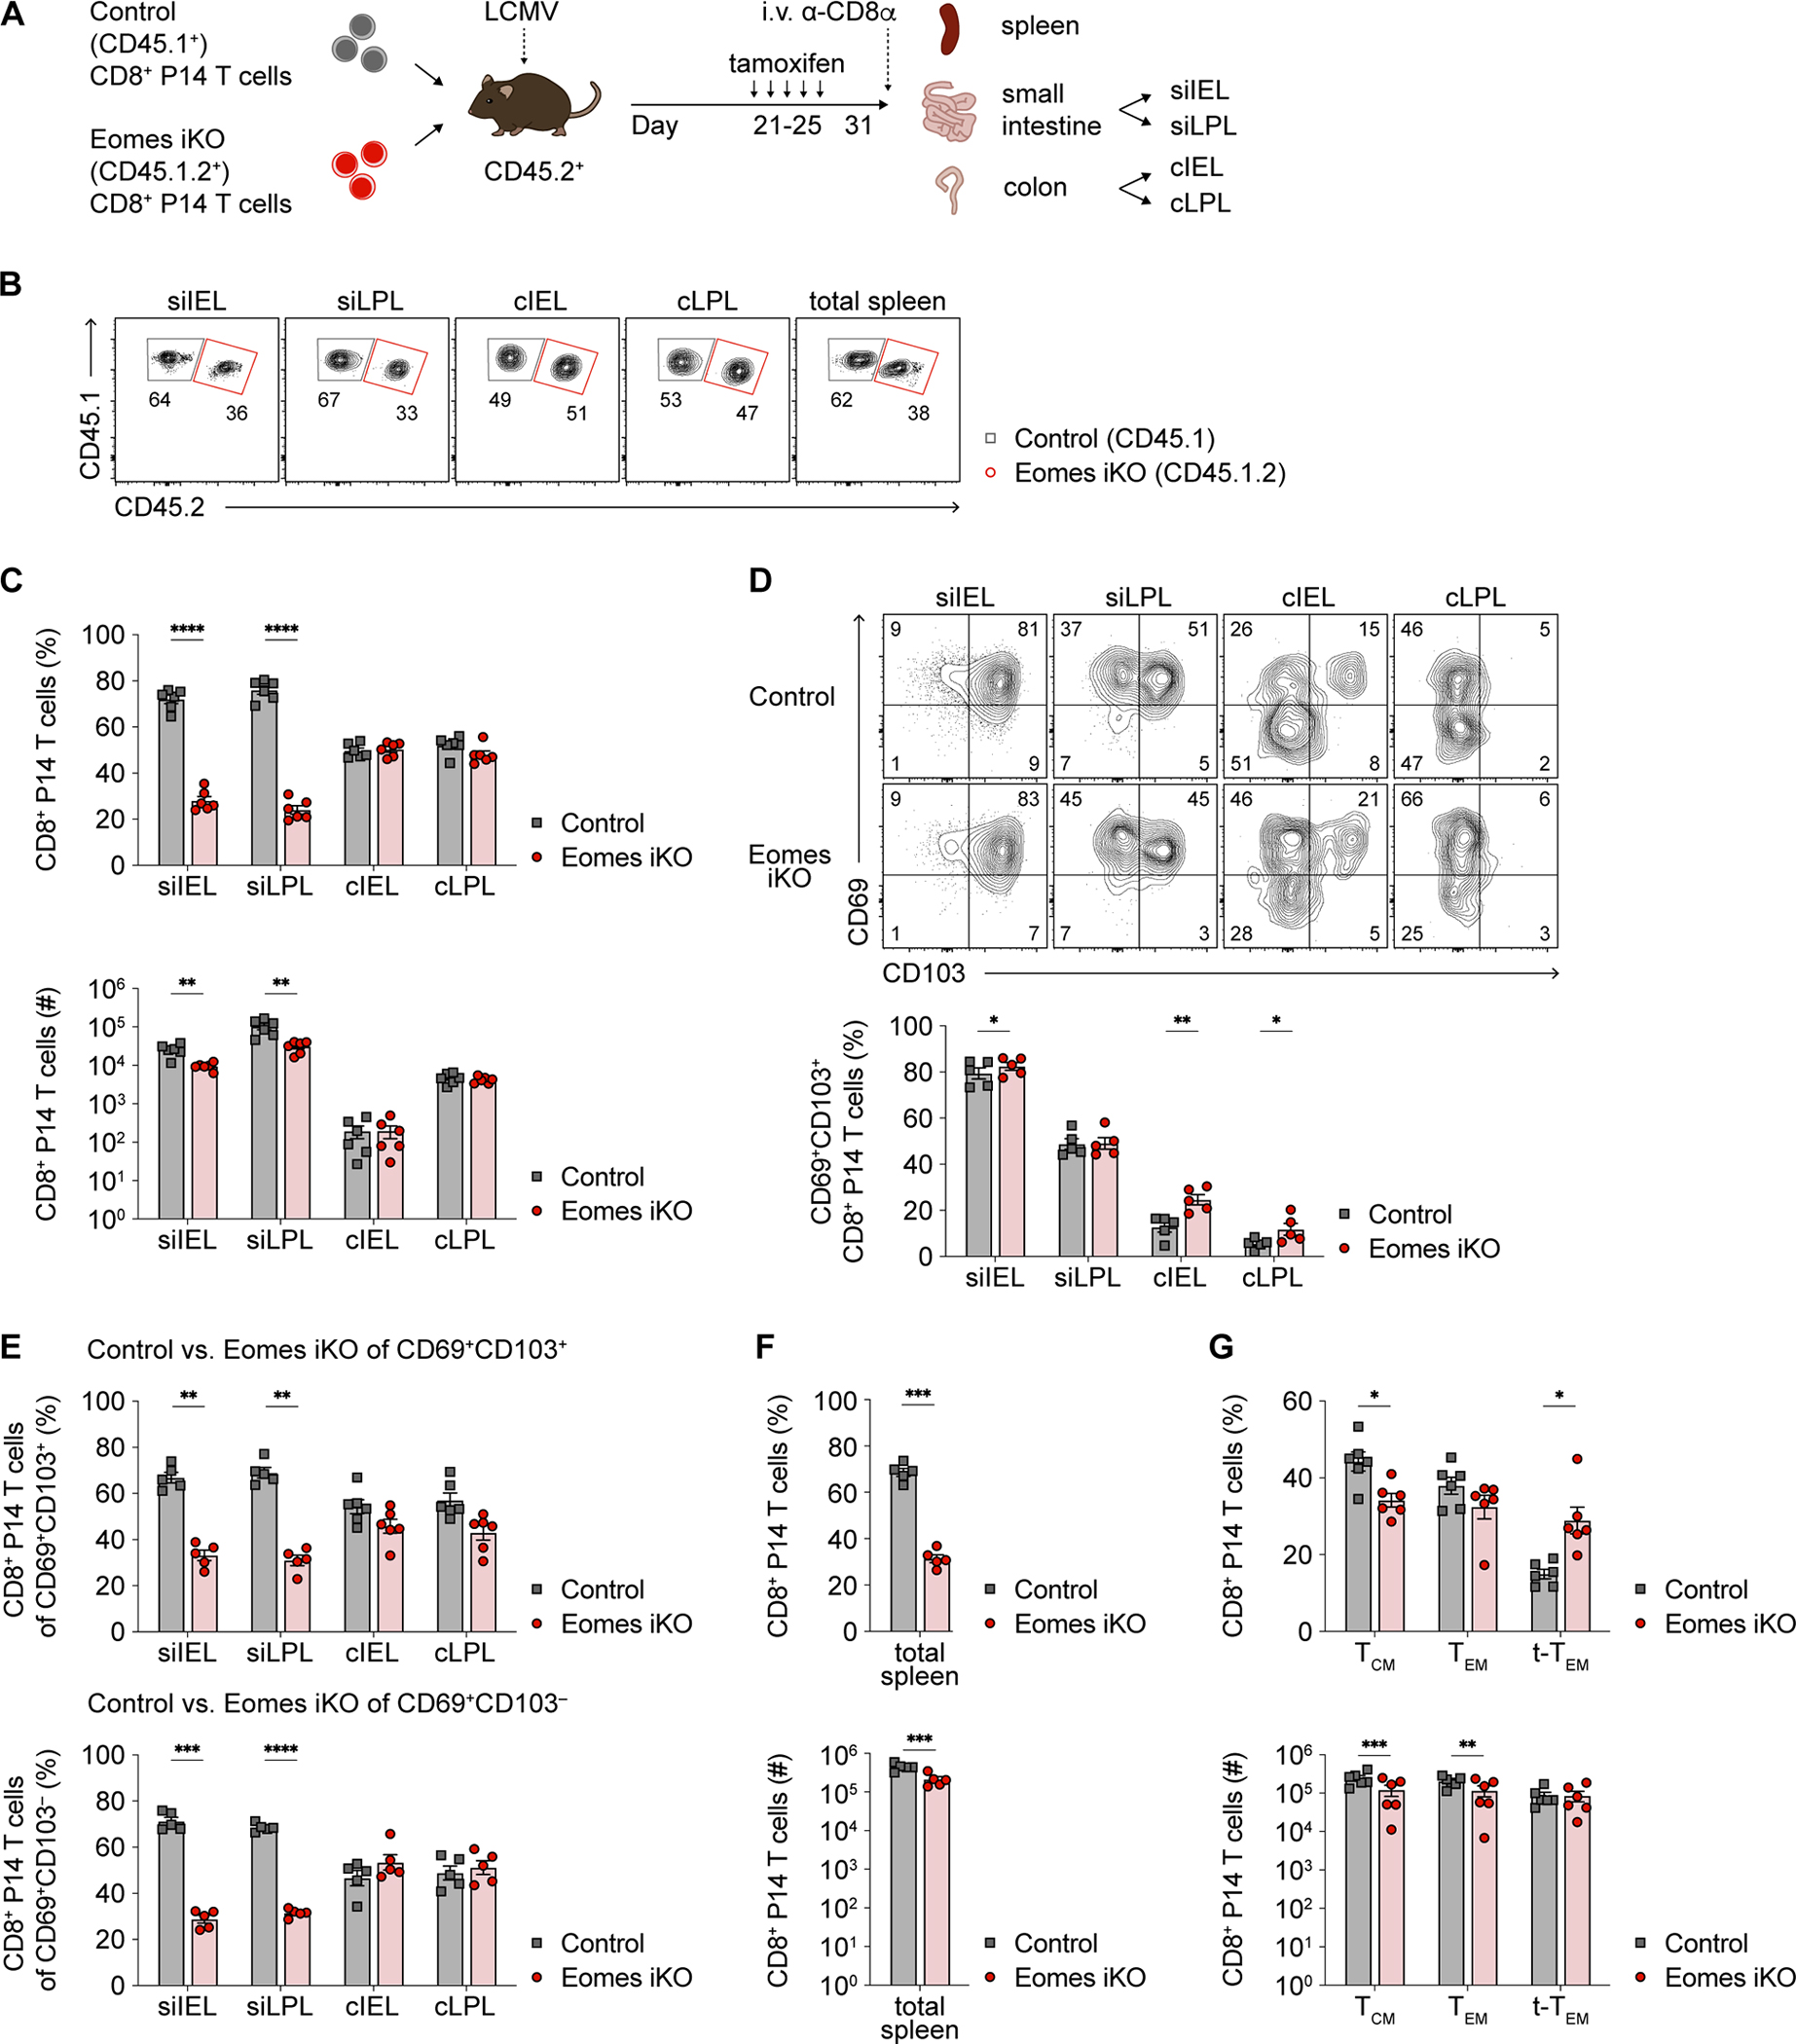
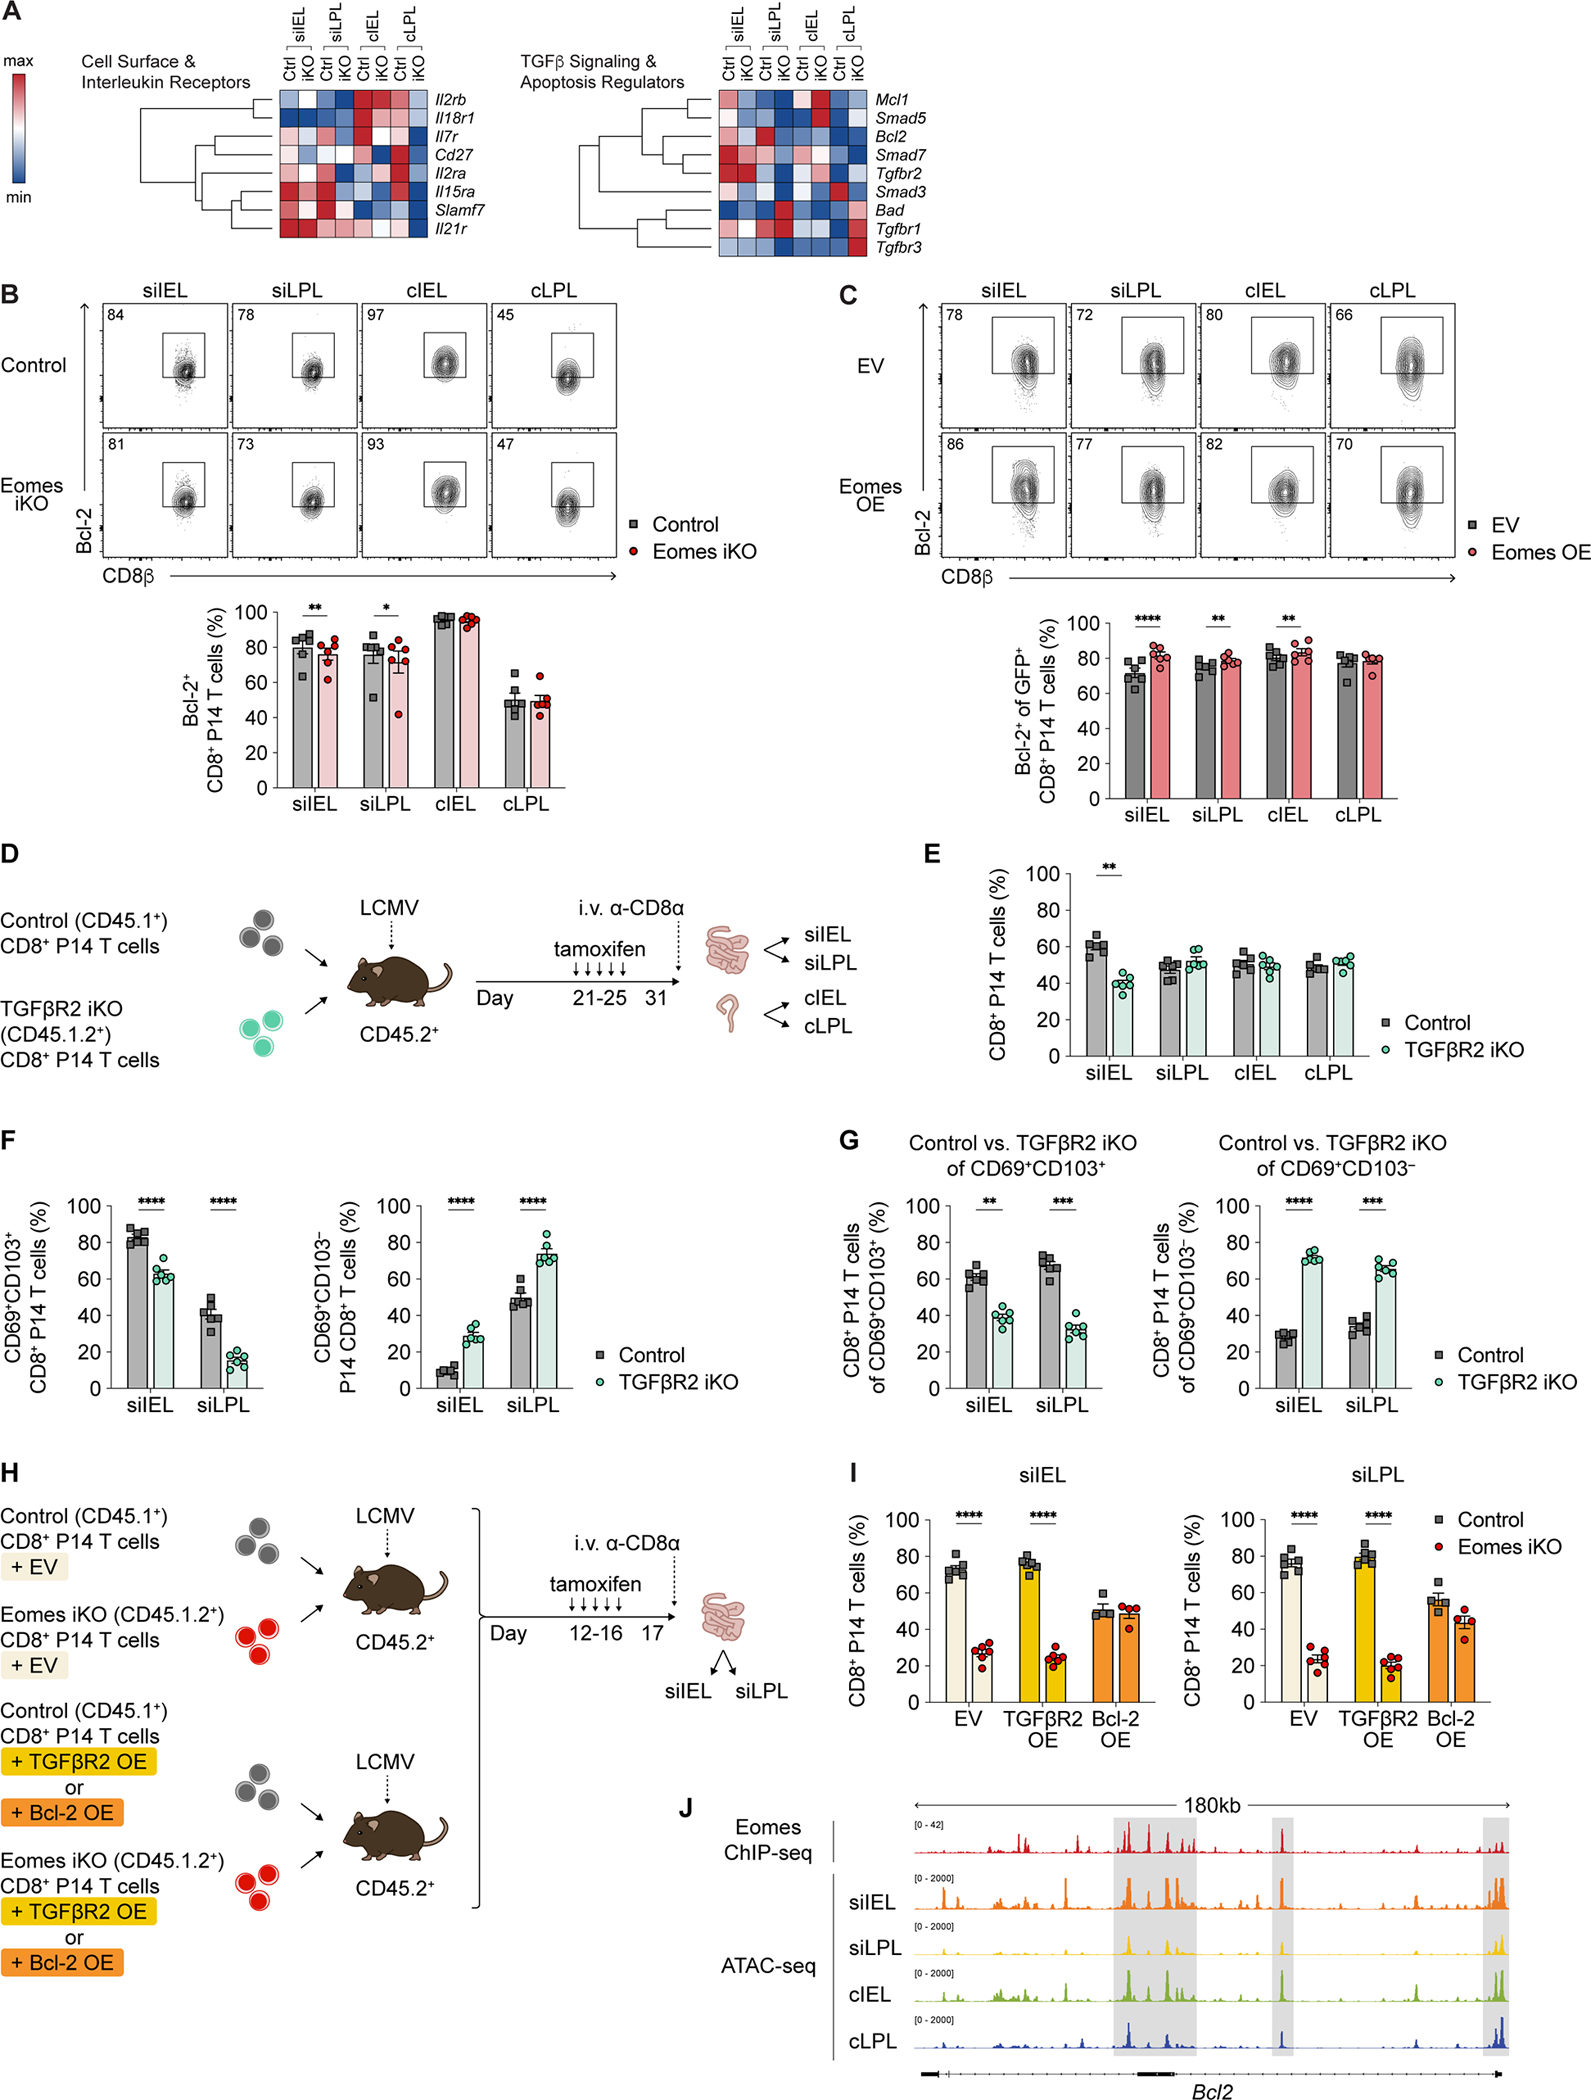
Tissue-resident memory CD8+ T (TRM) cells are a subset of memory T cells that play a critical role in limiting early pathogen spread and controlling infection. TRM cells exhibit differences across tissues, but their potential heterogeneity among distinct anatomic compartments within the small intestine and colon has not been well recognized. Here, by analyzing TRM cells from the lamina propria and epithelial compartments of the small intestine and colon, we showed that intestinal TRM cells exhibited distinctive patterns of cytokine and granzyme expression along with substantial transcriptional, epigenetic, and functional heterogeneity. The T-box transcription factor Eomes, which represses TRM cell formation in some tissues, exhibited unexpected context-specific regulatory roles in supporting the maintenance of established TRM cells in the small intestine, but not in the colon. Taken together, these data provide previously unappreciated insights into the heterogeneity and differential requirements for the formation vs. maintenance of intestinal TRM cells.

Keywords: Eomes; colon; single-cell ATAC-sequencing; single-cell RNA-sequencing; small intestine; tissue-resident memory CD8(+) T cells.


Conflict of interest statement

Declaration of interests G.W.Y. is a co-founder, member of the Board of Directors, on the SAB, equity holder, and paid consultant for Locanabio and Eclipse BioInnovations. In addition, G.W.Y. is a visiting professor at the National University of Singapore. G.W.Y.’s interest(s) have been reviewed and approved by the University of California, San Diego in accordance with its conflict-of-interest policies. A.W.G. is a member of the ArsenalBio scientific advisory board. J.T.C. reported grants from Takeda and Eli Lilly outside the submitted work.

Figures

Figure 1.
Figure 1.. CD8+ TRM cells in SI and colon express distinct levels of CD69 and CD103.
(A) Experimental design. Spleen and intestinal tissue compartments were isolated from CD45.2+ recipient mice ≥ 21 days after LCMV infection following adoptive transfer of donor CD8+CD45.1+ P14 T cells. (B) Numbers of i.v. intestinal P14 T cells, normalized to organ weights. (C) Representative flow cytometry plots showing CD69 and CD103 expression (top left) by i.v. intestinal P14 T cells. Frequencies (right) of intestinal CD69+CD103+ and CD69+CD103 P14 T cells. Distribution of intestinal P14 T cells expressing CD69 and/or CD103 (bottom left). (D–G) Representative flow cytometry plots showing expression of CD103/integrin β7 (D), CD49d/integrin β7 (E), CD49a/CD29 (F), CD49d/CD29 (G) among i.v. intestinal P14 T cells (left). Quantification of indicated integrin heterodimer expression among P14 T cells (right). (H–K) Representative flow cytometry plots (bottom) showing expression of CXCR3 (H), CXCR4 (I), CCR6 (J), and CCR9 (K) among i.v. intestinal P14 T cells. Frequencies of cells expressing each molecule (top right) and representative histograms (top left) indicating the distribution of expression for each molecule; expression by naïve (CD62LhiCD44lo) CD8+ T cells from a separate uninfected mouse is shown for comparison. Data are represented as mean ± SEM. Repeated measures one-way ANOVA. *p<0.05, **p<0.01, ***p<0.001 ****p<0.0001. Data are representative of ≥3 independent experiments with n=5–6 mice per experiment. See also Figure S1.
Figure 2.
Figure 2.. Small intestine IEL CD8+ TRM cells express high levels of granzymes whereas cIEL TRM cells exhibit high potential for cytokine production.
(A–E) Histograms (top left), bar graphs (top right), and representative flow cytometry plots (bottom) showing expression of GzmA (A), GzmB (B), IL-2 (C), TNF (D), and IFNγ (E) by i.v.− intestinal P14 T cells. (F) Proportions of intestinal T cells expressing 0, 1, 2, or 3 cytokines. (G) Relative change in numbers of intestinal P14 T cells between days 21 and 80 post-infection, normalized to TCM cells. (H–J) Histograms (top left), bar graphs (top right), and representative flow cytometry plots (bottom) showing expression of CD127 (H), CD122 (I), and CD27 (J) by intestinal P14 T cells. Data are represented as mean ± SEM. Repeated measures one-way ANOVA. *p<0.05, **p<0.01, ***p<0.001 ****p<0.0001. Data are representative of ≥3 independent experiments with n=5–6 mice per experiment. See also Figure S1.
Figure 3.
Figure 3.. Colon CD8+ TRM cells express higher levels of Eomes than SI TRM cells.
(A-C) Hierarchically clustered summary heatmaps, derived from CITE-seq data, representing top ten genes differentially expressed among intestinal TRM cells (A); relative expression of selected genes, divided by category (B); or relative expression of all proteins included in the CITE-seq antibody panel (C). Rows represent scaled expression of individual genes (A, B) or proteins (C); columns represent TRM cells from each of the 4 intestinal tissue compartments. Values are mapped to colors using the minimum and maximum of each row. (D) UMAP plots colored by tissue compartment (top left) or expression of selected proteins superimposed onto individual cells. (E–H) Histograms (top left), bar graphs (top right), and representative flow cytometry plots (bottom) showing expression of Ly6C (E), P2RX7 (F), T-bet (G), and Eomes (H) among intestinal P14 T cells. (I) Geometric mean fluorescence intensity (gMFI) of expression of selected proteins by intestinal TRM cells, derived from flow cytometry analyses from Figures 2A–2E, 2H–2J, 3E–3H, and S3C–H, represented as a summary heatmap. Values are mapped to colors using the minimum and maximum of each row. Data are represented as mean ± SEM. Repeated measures one-way ANOVA. *p<0.05, **p<0.01, ***p<0.001 ****p<0.0001. Data are representative of ≥3 independent experiments with n=5–6 mice per experiment. See also Figures S2–S4 and Table S3.
Figure 4.
Figure 4.. Small intestine IEL TRM cells may exhibit higher developmental plasticity than siLPL TRM cells.
(A and B) Velocities (A) and latent time (B) of siIEL and siLPL TRM cells derived from scVelo projected onto a UMAP-based embedding. (C) Experimental design. siIEL and siLPL TRM cells were FACS-purified from CD45.2+ recipient mice ≥21 days following adoptive transfer of donor CD45.1+ P14 T cells and LCMV infection. Cells were transferred into new, separate CD45.2+ recipients subsequently infected with LCMV and sacrificed 10–14 days later. (D and E) Representative flow cytometry plots (D) and bar graphs (E) showing frequencies of transferred CD45.1+ ex-siIEL (left) or CD45.1+ ex-siLPL (right) TRM cells in the intestinal tissue compartments and spleen. (F–H) Representative flow cytometry plots (left) and bar graphs (right) showing frequencies of cells expressing CD69 and CD103 (F), GzmA (G), or Ly6C (H) among ex-siIEL TRM cells in the intestinal tissue compartments. (I) Representative flow cytometry plots showing expression of CD62L and CD127 among ex-siIEL CD8+CD45.1+ P14 T cells or recipient (non-P14) CD8+CD45.2+ T cells in the spleen. Data are represented as mean ± SEM. Repeated measures one-way ANOVA. *p<0.05, **p<0.01, ***p<0.001 ****p<0.0001. Data are representative of ≥2 independent experiments with n=5–6 mice per experiment.
Figure 5.
Figure 5.. Eomes is dispensable for intestinal CD8+ TRM cell formation.
(A) Experimental design. CD8+ P14 T cells from congenic control and Eomesfl/flCd4-Cre+(Eomes cKO) mice were adoptively co-transferred at a 1:1 ratio into recipients subsequently infected with LCMV. Donor P14 T cells were isolated from spleen and intestinal tissue compartments as in Figure 1 at 7 days (B and C) or ≥21 days (D and E) post-infection. (B and D) Quantification of the proportions (top) or absolute numbers (bottom) of control i.v. control vs. Eomes cKO P14 T cells in each tissue compartment at 7 days (B) or ≥21 days (D) post-infection. (C and E) Representative flow cytometry plots (top) and bar graphs (bottom) indicating frequencies of control vs. Eomes cKO intestinal P14 T cells expressing CD69 and CD103 at 7 days (C) or ≥21 days (E) post-infection. Data are represented as mean ± SEM. Paired t-test. *p<0.05, **p<0.01, ***p<0.001 ****p<0.0001. Data are representative of ≥3 independent experiments with n=5–6 mice per experiment. See also Figures S5 and S6.
Figure 6.
Figure 6.. Eomes plays a critical role in maintenance of established SI CD8+ TRM cells.
(A) Experimental design. CD8+ T cells from congenic control and Eomesfl/flErt2-Cre+ (Eomes iKO) P14 mice were adoptively co-transferred at 1:1 ratio into recipients subsequently infected with LCMV. Mice received tamoxifen i.p. once daily x 5 doses starting at day 21 post-infection. Spleen and intestinal P14 T cells were harvested >10 days later. (B and C) Representative flow cytometry plots (B) and quantification (C) of the proportions (top) or absolute numbers (bottom) of i.v. control vs. Eomes iKO P14 T cells in each intestinal tissue compartment. (D) Representative flow cytometry plots (top) and bar graphs (bottom) indicating frequencies of control vs. Eomes iKO intestinal P14 T cells expressing CD69 and CD103. (E) Proportions of control vs. Eomes iKO P14 TRM cells among CD69+CD103+ (top) or CD69+CD103 (bottom) subpopulations. (F) Frequencies (top) or absolute numbers (bottom) of total control vs. Eomes iKO P14 T cells in the spleen. (G) Bar graphs indicating the frequencies (top) or absolute numbers (bottom) of control vs. Eomes iKO TCM (CD62LhiCD127hi), TEM (CD62LloCD127hi), and t-TEM (CD62LloCD127lo) cells. Data are represented as mean ± SEM. Paired t-test. *p<0.05, **p<0.01, ***p<0.001 ****p<0.0001. Data are representative of ≥3 independent experiments with n=5–6 mice per experiment. See also Figure S7.
Figure 7.
Figure 7.. Eomes promotes SI CD8+ TRM cell maintenance, in part, through effects on Bcl-2.
(A) Relative expression of selected genes derived using CITE-seq data from control vs. Eomesfl/flErt2-Cre+ (Eomes iKO) P14 T cells, represented as hierarchically clustered summary heatmaps; rows represent individual genes and columns represent P14 T cells from each of the 4 intestinal tissue compartments. (B) Representative flow cytometry plots (top) and bar graphs displaying the frequencies of i.v. control vs. Eomes iKO intestinal P14 T cells expressing Bcl-2. (C) Representative flow cytometry plots (top) and bar graphs representing frequencies of adoptively co-transferred empty vector (EV)- vs. Eomes overexpression (OE)-transduced intestinal P14 T cells expressing Bcl-2 at day 7 following LCMV infection. (D) Experimental design. CD8+ T cells from congenic control or Tgfbr2fl/flErt2-Cre+ (TGFβR2 iKO) P14 mice were adoptively co-transferred at a 1:1 ratio into recipients subsequently infected with LCMV, followed by treatment with tamoxifen as in Figure 6A. (E and F) Bar graphs representing frequencies of total (E), CD69+CD103+ (F, left), or CD69+CD103 (F, right) control vs. TGFβR2 iKO i.v. intestinal P14 T cells. (H) Experimental design. CD8+ T cells from control (CD45.1+) or Eomes iKO (CD45.1.2+) P14 mice were activated and transduced with EV, TGFβR2 OE, or Bcl-2 OE constructs. Cells were mixed adoptively co-transferred at a 1:1 into CD45.2+ recipients subsequently infected with LCMV, followed by treatment with tamoxifen as in Figure 6A. (I) Bar graphs representing frequencies of EV-transduced control vs. Eomes iKO P14 T cells (left); TGFβR2 OE-transduced control vs. Eomes iKO P14 T cells (middle); and Bcl-2 OE-transduced control vs. Eomes iKO P14 T cells (right) in the siIEL and siLPL tissue compartments. (J) CD45.1+ intestinal P14 T cells were isolated from CD45.2+ recipient mice infected with LCMV 21 days prior, FACS-purified, and processed for scATAC-seq. Tracks representing Eomes ChIP-seq (top) and scATAC-seq peaks for each of the four intestinal tissue compartments (bottom) are shown for Bcl2. Data are represented as mean ± SEM. Paired t-test. *p<0.05, **p<0.01, ***p<0.001 ****p<0.0001. Data are representative of ≥3 independent experiments with n=5–6 mice per experiment. See also Figure S7 and Table S7.

References

    1. Chang JT, Wherry EJ, and Goldrath AW (2014). Molecular regulation of effector and memory T cell differentiation. Nature immunology 15, 1104–1115. 10.1038/ni.3031. - DOI - PMC - PubMed
    1. Milner JJ, Nguyen H, Omilusik K, Reina-Campos M, Tsai M, Toma C, Delpoux A, Boland BS, Hedrick SM, Chang JT, and Goldrath AW (2020). Delineation of a molecularly distinct terminally differentiated memory CD8 T cell population. Proc Natl Acad Sci U S A 117, 25667–25678. 10.1073/pnas.2008571117. - DOI - PMC - PubMed
    1. Gerlach C, Moseman EA, Loughhead SM, Alvarez D, Zwijnenburg AJ, Waanders L, Garg R, de la Torre JC, and von Andrian UH (2016). The Chemokine Receptor CX3CR1 Defines Three Antigen-Experienced CD8 T Cell Subsets with Distinct Roles in Immune Surveillance and Homeostasis. Immunity 45, 1270–1284. 10.1016/j.immuni.2016.10.018. - DOI - PMC - PubMed
    1. Sallusto F, Lenig D, Forster R, Lipp M, and Lanzavecchia A (1999). Two subsets of memory T lymphocytes with distinct homing potentials and effector functions. Nature 401, 708–712. 10.1038/44385. - DOI - PubMed
    1. Fonseca R, Beura LK, Quarnstrom CF, Ghoneim HE, Fan Y, Zebley CC, Scott MC, Fares-Frederickson NJ, Wijeyesinghe S, Thompson EA, et al. (2020). Developmental plasticity allows outside-in immune responses by resident memory T cells. Nature immunology 21, 412–421. 10.1038/s41590-020-0607-7. - DOI - PMC - PubMed

Publication types