

Normalisation of SARS-CoV-2 concentrations in wastewater: The use of flow, electrical conductivity and crAssphage
- PMID: 36581271
- PMCID: PMC9791714
- DOI: 10.1016/j.scitotenv.2022.161196
Normalisation of SARS-CoV-2 concentrations in wastewater: The use of flow, electrical conductivity and crAssphage
Abstract
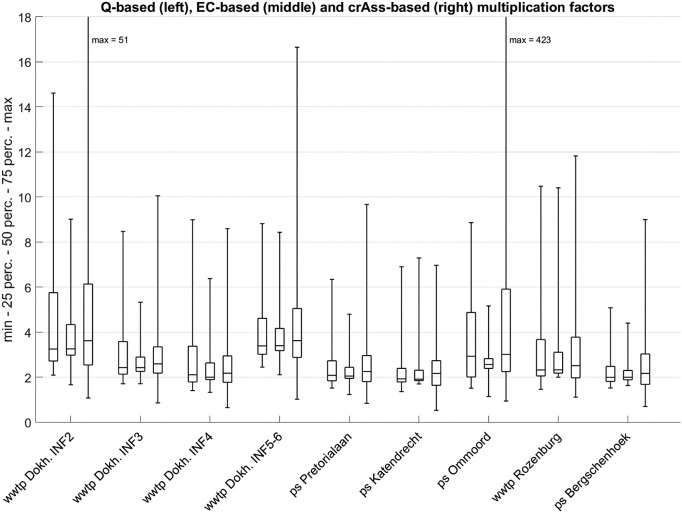
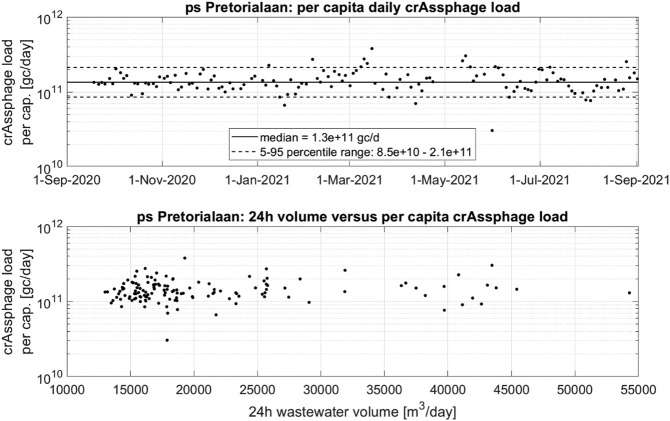
Over the course of the Corona Virus Disease-19 (COVID-19) pandemic in 2020-2022, monitoring of the severe acute respiratory syndrome coronavirus 2 ribonucleic acid (SARS-CoV-2 RNA) in wastewater has rapidly evolved into a supplementary surveillance instrument for public health. Short term trends (2 weeks) are used as a basis for policy and decision making on measures for dealing with the pandemic. Normalisation is required to account for the dilution rate of the domestic wastewater that can strongly vary due to time- and location-dependent sewer inflow of runoff, industrial discharges and extraneous waters. The standard approach in sewage surveillance is normalisation using flow measurements, although flow based normalisation is not effective in case the wastewater volume sampled does not match the wastewater volume produced. In this paper, two alternative normalisation methods, using electrical conductivity and crAssphage have been studied and compared with the standard approach using flow measurements. For this, a total of 1116 24-h flow-proportional samples have been collected between September 2020 and August 2021 at nine monitoring locations. In addition, 221 stool samples have been analysed to determine the daily crAssphage load per person. Results show that, although crAssphage shedding rates per person vary greatly, on a population-level crAssphage loads per person per day were constant over time and similar for all catchments. Consequently, crAssphage can be used as a quantitative biomarker for populations above 5595 persons. Electrical conductivity is particularly suitable to determine dilution rates relative to dry weather flow concentrations. The overall conclusion is that flow normalisation is necessary to reliably determine short-term trends in virus circulation, and can be enhanced using crAssphage and/or electrical conductivity measurement as a quality check.
Keywords: COVID-19; Normalisation; Public health; Sewage surveillance.
Copyright © 2022 The Authors. Published by Elsevier B.V. All rights reserved.
Conflict of interest statement
Declaration of competing interest The authors declare that they have no known competing financial interests or personal relationships that could have appeared to influence the work reported in this paper.
Figures


References
-
- Ahmed W., Tscharke B., Bertsch P.M., Bibby K., Bivins A., Choi P., Clarke L., Dwyer J., Edson J., Nguyen T.M.H., O'Brien J.W., Simpson S.L., Sherman P., Thomas K.V., Verhagen R., Zaugg J., Mueller J.F. SARS-CoV-2 RNA monitoring in wastewater as a potential early warning system for COVID-19 transmission in the community: a temporal case study. Sci. Total Environ. 2020;761 doi: 10.1016/j.scitotenv.2020.144216. - DOI - PMC - PubMed
-
- Betancourt W.Q., Schmitz B.W., Innes G.K., Prasek S.M., Pogreba Brown K.M., Stark E.R., Foster A.R., Sprissler R.S., Harris D.T., Sherchan S.P., Gerba C.P., Pepper I.L. COVID-19 containment on a college campus via wastewater-based epidemiology, targeted clinical testing and an intervention. Sci. Total Environ. 2021;779 doi: 10.1016/j.scitotenv.2021.146408. - DOI - PMC - PubMed
MeSH terms
Substances
LinkOut - more resources
Full Text Sources
Medical
Miscellaneous
