

Novel MYCBP::EHD2 and RUNX1::ZNF780A Fusion Genes in T-cell Acute Lymphoblastic Leukemia
- PMID: 36581344
- PMCID: PMC9806666
- DOI: 10.21873/cgp.20364
Novel MYCBP::EHD2 and RUNX1::ZNF780A Fusion Genes in T-cell Acute Lymphoblastic Leukemia
Abstract
Background/aim: T-cell acute lymphoblastic leukemia (T-ALL) is a rare malignancy characterized by proliferation of early T-cell precursors that replace normal hematopoietic cells. T-ALL cells carry non-random chromosome aberrations, fusion genes, and gene mutations, often of prognostic significance. We herein report the genetic findings in cells from a T-ALL patient.
Materials and methods: Bone marrow cells from a patient with T-ALL were examined using G-banding, array comparative genomic hybridization (aCGH), RNA sequencing, reverse transcription polymerase chain reaction (RT-PCR), Sanger sequencing, and fluorescence in situ hybridization.
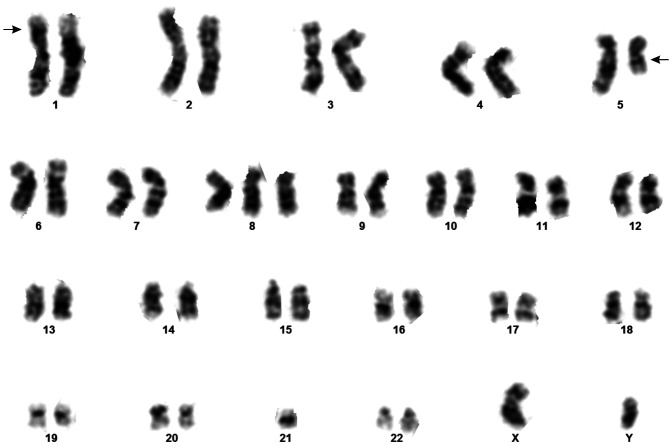
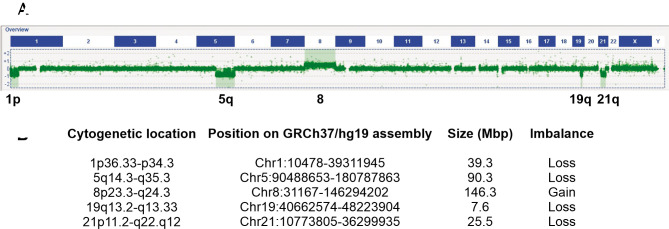
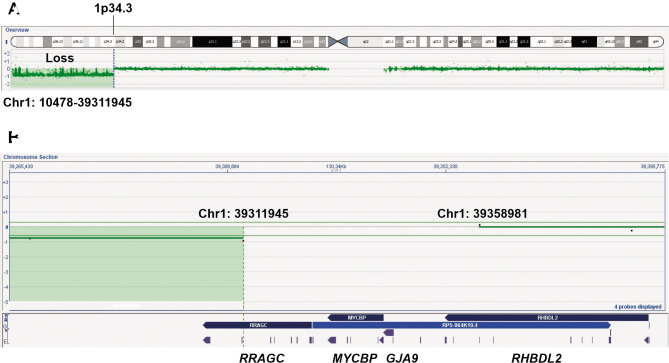
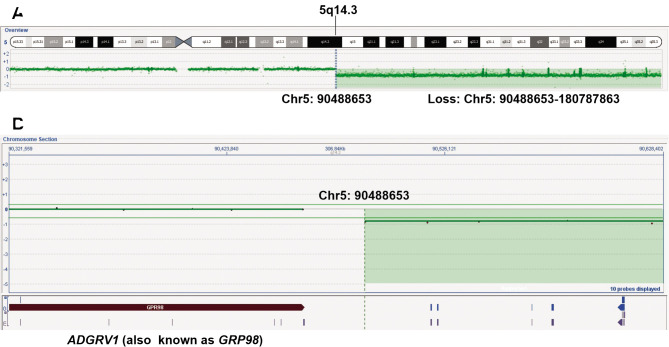
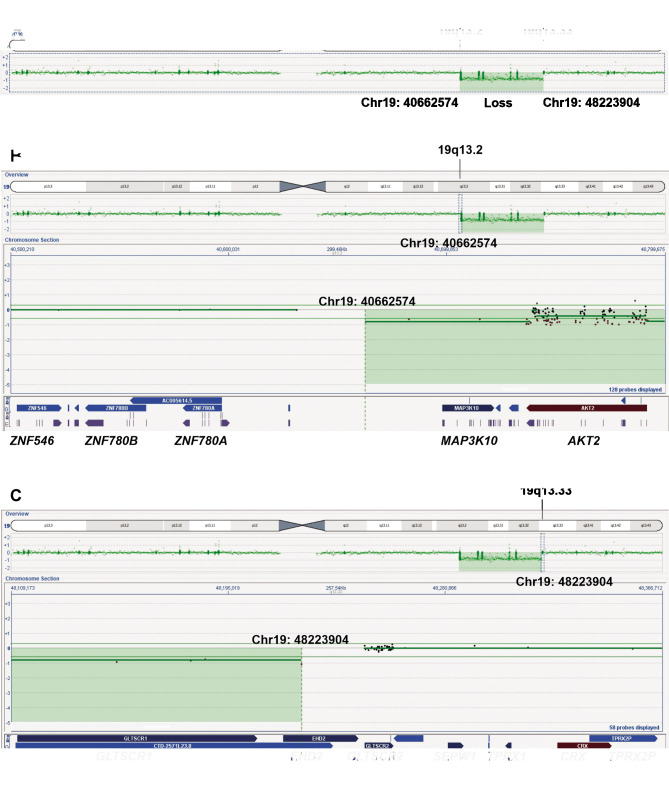
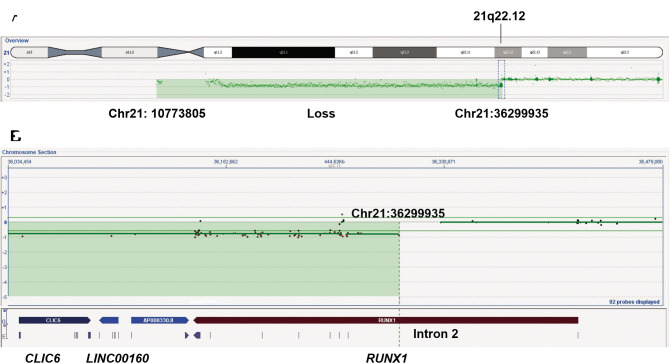
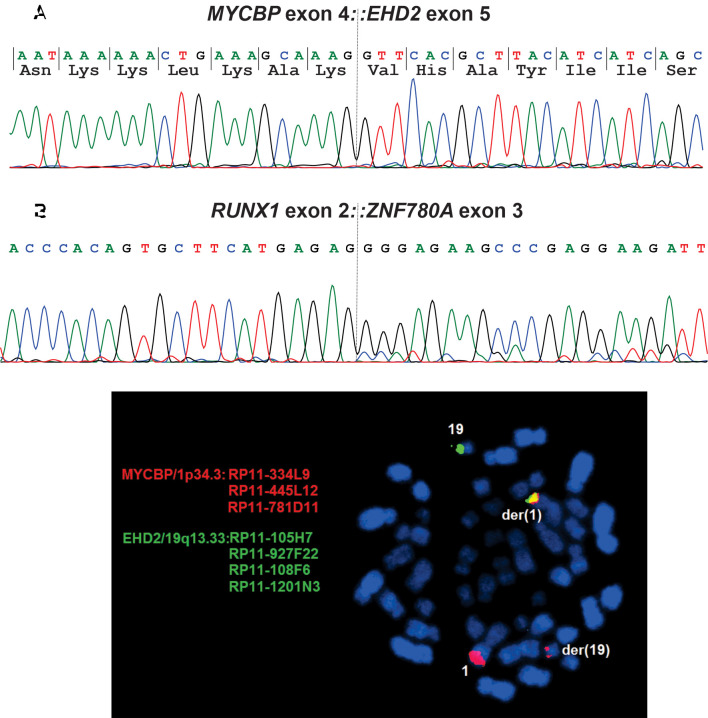
Results: G-banding revealed del(1)(p34), add(5)(q14), trisomy 8, and monosomy 21 in the leukemic cells. aCGH detected the gross unbalances inferred from the karyotyping results, except that heterozygous loss of chromosome 21 did not include its distal part; 21q22.12-q22.3 was undeleted. In addition, aCGH detected a submicroscopic interstitial 7.56 Mbp deletion in the q arm of chromosome 19 from 19q13.2 to 19q13.33. RNA sequencing detected and RT-PCR/Sanger sequencing confirmed the presence of two novel chimeras, MYCBP::EHD2 and RUNX1::ZNF780A. They were generated from rearrangements involving subbands 1p34.3 (MYCBP), 19q13.2 (ZNF780A), 19q13.33 (EHD2), and 21q22.12 (RUNX1), i.e., at the breakpoints of chromosomal deletions.
Conclusion: The leukemic cells showed the heterozygous loss of many genes as well as the generation of MYCBP::EHD2 and RUNX1::ZNF780A chimeras. Because the partner genes in the chimeras were found at the breakpoints of the chromosomal deletions, we believe that both the heterozygous losses and the generation of the two chimeras occurred simultaneously, and that they were pathogenetically important.
Keywords: EHD2; MYCBP; MYCBP::EHD2; RNA-sequencing; RUNX1; RUNX1::ZNF780A; T-cell acute lymphoblastic leukemia; ZNF780A; cytogenetics; fusion gene.
Copyright © 2023, International Institute of Anticancer Research (Dr. George J. Delinasios), All rights reserved.
Conflict of interest statement
The Authors declare that they have no potential conflicts of interest.
Figures
Similar articles
-
RUNX1-PDCD6 fusion resulting from a novel t(5;21)(p15;q22) chromosome translocation in myelodysplastic syndrome secondary to chronic lymphocytic leukemia.PLoS One. 2018 Apr 19;13(4):e0196181. doi: 10.1371/journal.pone.0196181. eCollection 2018. PLoS One. 2018. PMID: 29672642 Free PMC article.
-
Abnormalities of the der(12)t(12;21) in ETV6-RUNX1 acute lymphoblastic leukemia.Genes Chromosomes Cancer. 2013 Feb;52(2):202-13. doi: 10.1002/gcc.22021. Epub 2012 Oct 18. Genes Chromosomes Cancer. 2013. PMID: 23077088
-
WNT inhibitory factor 1 (WIF1) is a novel fusion partner of RUNX family transcription factor 1 (RUNX1) in acute myeloid leukemia with t(12;21)(q14;q22).J Hematop. 2024 Dec;17(4):245-249. doi: 10.1007/s12308-024-00597-4. Epub 2024 Jul 27. J Hematop. 2024. PMID: 39066949
-
RUNX1-MTG16 fusion gene in acute myeloblastic leukemia with t(16;21)(q24;q22): case report and review of the literature.Cancer Genet Cytogenet. 2008 Aug;185(1):47-50. doi: 10.1016/j.cancergencyto.2008.04.011. Cancer Genet Cytogenet. 2008. PMID: 18656694 Review.
-
The Landscape of Secondary Genetic Rearrangements in Pediatric Patients with B-Cell Acute Lymphoblastic Leukemia with t(12;21).Cells. 2023 Jan 18;12(3):357. doi: 10.3390/cells12030357. Cells. 2023. PMID: 36766699 Free PMC article. Review.
Cited by
-
Transformers meets neoantigen detection: a systematic literature review.J Integr Bioinform. 2024 Jul 4;21(2):20230043. doi: 10.1515/jib-2023-0043. eCollection 2024 Jun 1. J Integr Bioinform. 2024. PMID: 38960869 Free PMC article.
-
Acute Undifferentiated Leukemia With a Balanced t(5;10)(q35;p12) Resulting in Fusion of HNRNPH1 With MLLT10.Cancer Genomics Proteomics. 2023 Jul-Aug;20(4):354-362. doi: 10.21873/cgp.20387. Cancer Genomics Proteomics. 2023. PMID: 37400142 Free PMC article.
References
-
- Heim S, Mitelman F. Cancer cytogenetics: Chromosomal and molecular genetic abberations of tumor cells. Fourth Edition edn. Wiley-Blackwell. 2015
MeSH terms
Substances
LinkOut - more resources
Full Text Sources
Miscellaneous