. 2022 Dec 29;13(12):1077.
doi: 10.1038/s41419-022-05530-0.

High p62 expression suppresses the NLRP1 inflammasome and increases stress resistance in cutaneous SCC cells

Affiliations

High p62 expression suppresses the NLRP1 inflammasome and increases stress resistance in cutaneous SCC cells

Paulina Hennig et al. Cell Death Dis. .

Abstract

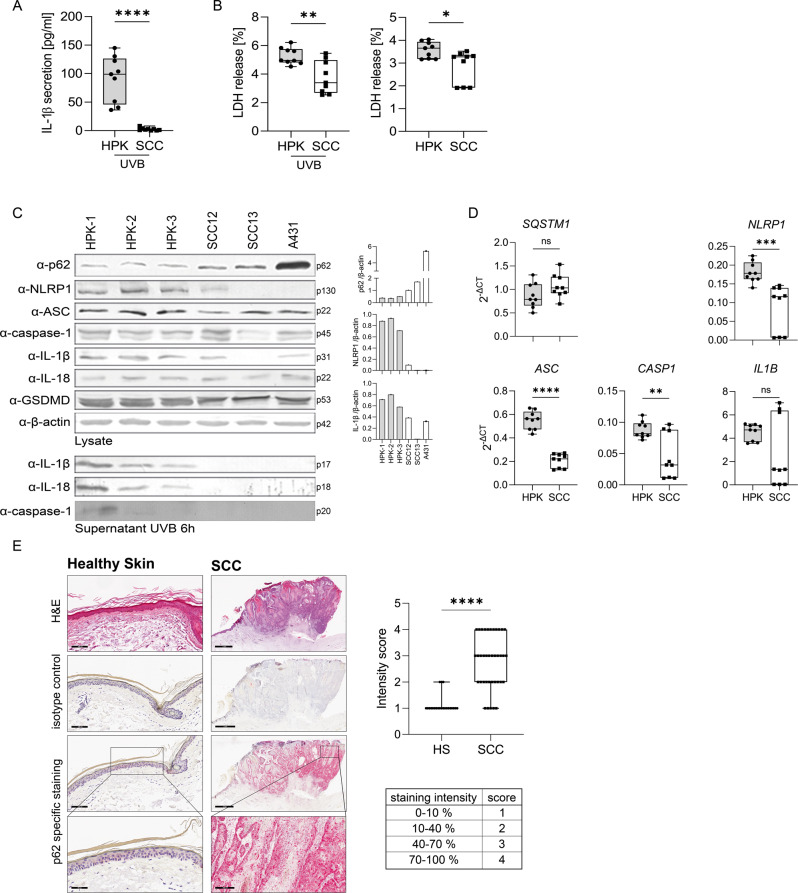
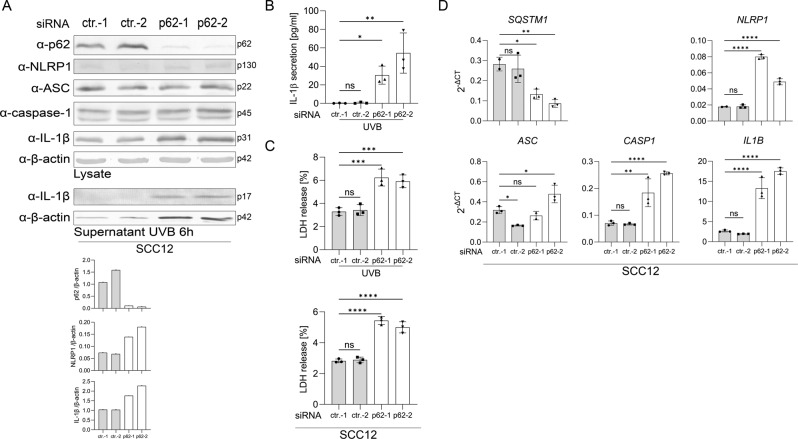
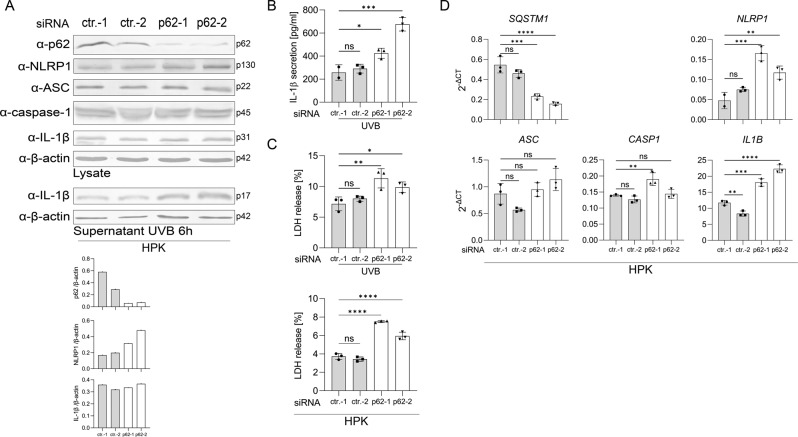
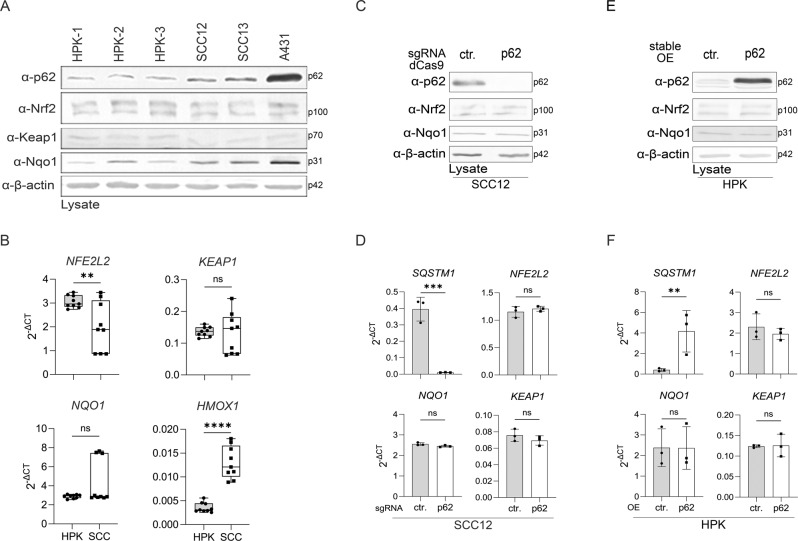
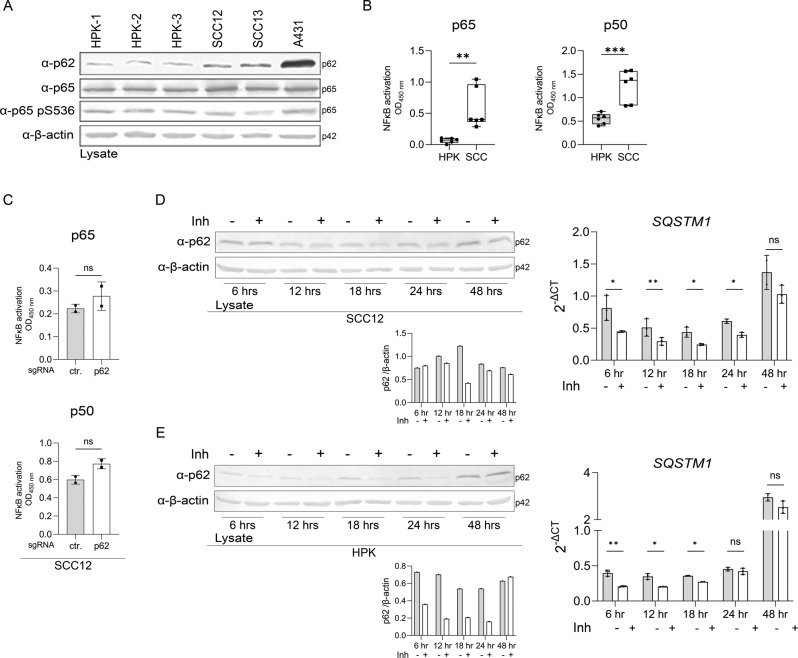
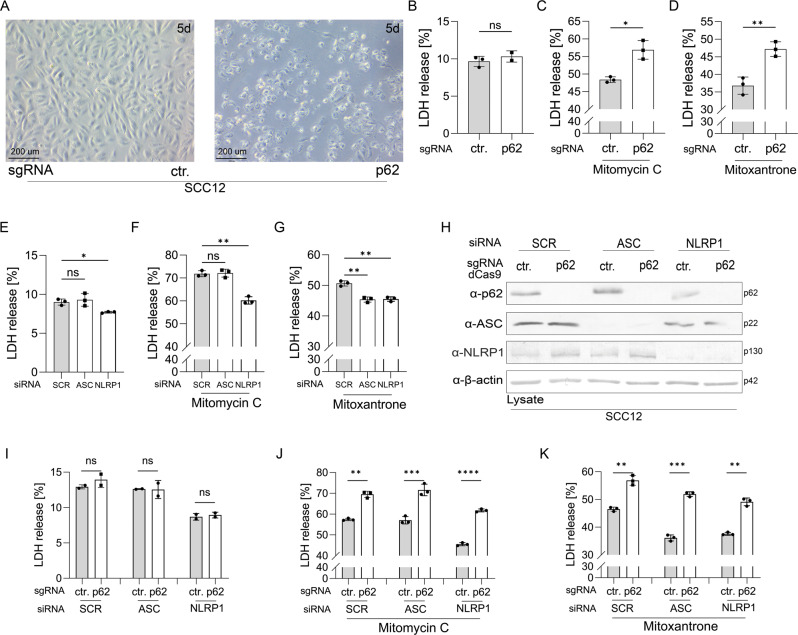
NLRP1 is the primary inflammasome sensor in human keratinocytes. Sensing of UVB radiation by NLRP1 is believed to underlie the induction of sunburn. Although constitutive NLRP1 activation causes skin inflammation and predisposes patients to the development of cutaneous SCCs, the NLRP1 pathway is suppressed in established SCCs. Here, we identified high levels of the autophagy receptor p62 in SCC cells lines and SCC tumors. Increased NF-κB activity in SCC cells causes p62 up-regulation. Suppression of p62 expression rescues UVB-induced NLRP1 inflammasome activation in early-stage SCC cells. p62 expression protects SCC cells from cytotoxic drugs, whereas NLRP1 sensitizes them. In summary, we identify p62 as a novel negative regulator of the NLRP1 inflammasome in human cutaneous SCC cells, in which suppression of NLRP1 by increased levels of p62 supports stress resistance of skin cancer cells.


Conflict of interest statement

The authors declare no competing interests.

Figures

Fig. 1
Fig. 1. p62 expression is increased in SCC cells and carcinomas.
AD HPKs from three different donors were compared with SCC12, SCC13 and A431 cells. A IL-1β secretion determined by ELISA 6 h after UVB irradiation. B Cell lysis determined by LDH assay of UVB irradiated and mock-treated cells (after 6 h). C Western blots of lysate and of supernatant 6 h after UVB irradiation or mock treatment from HPKs and SCC cell lines (left panel) with a quantification of the band corresponding to p62, NLRP1, and IL1β normalized to β-actin (right panel). Representative experiment out of three. D mRNA expression of the indicated genes determined by qPCR in mock-treated cells. E H&E staining and p62 expression in healthy human skin (N = 22) and in SCCs (N = 38) isolated from patients determined by immunohistochemistry. A representative staining is shown. Expression of p62 was quantified and summarized by a blinded scoring system by two uninvolved individuals. Data are represented as mean ± SD of three experiments where 3 donors in the group of HPKs (N = 9) and 3 SCC cell lines (SCC12, SCC13, A431) in the group of SCCs (N = 9) were subjected (A, B, D) or are representative of three independent experiments (C). P values were calculated with two-tailed unpaired t-test (A, B, D) and Mann-Whitney test (E). (****P < 0.001, ***P ≤ 0.001, **P ≤ 0.01, and *P ≤ 0.05, ns = not significant). Black scale bar = 100 µm (healthy skin), 2 mm (SCC), magnitude 50 µm (healthy skin), 300 µm (SCC). SCC squamous cell carcinoma, HPK human primary keratinocyte, HS healthy skin.
Fig. 2
Fig. 2. Knockdown of p62 expression rescues inflammasome activation in SCC12 cells.
AC SCC12 cells were transfected with two different control siRNAs (ctr.-1, ctr.-2) or two different siRNAs targeting p62 mRNA (p62-1, p62-2). A Western blots of lysate of mock-treated transfected SCC12 with a quantification of the band corresponding to p62, NLRP1, and IL1β normalized to β-actin (lower panel), and of supernatant 6 h after UVB irradiation. B IL-1β in the supernatant 6 h after UVB irradiation determined by ELISA. C LDH release 6 h after UVB irradiation (upper panel) or after mock-treatment. D mRNA expression of the indicated genes determined by qPCR in mock-treated cells. Data are represented as mean ± SD of three experiments using one-way analysis of variance with Dunnett’s multiple comparison test (N = 3) (BD) or are representative of at least three independent experiments (A). (****P < 0.001, ***P ≤ 0.001, **P ≤ 0.01, and *P ≤ 0.05, ns = not significant).
Fig. 3
Fig. 3. p62 knockdown supports inflammasome activation in HPKs.
AD HPKs were transfected with two control siRNAs (ctr.-1, ctr.-2) or two different siRNAs targeting p62 mRNA (p62-1, p62-2). A Western blots of lysates of mock-treated HPKs with a quantification of the band corresponding to p62, NLRP1, and IL1β normalized to β-actin (lower panel), and of supernatant 6 h after UVB irradiation. B ELISA measurement of IL-1β in the supernatant 6 h after UVB irradiation. C Cell lysis determined by LDH assay 6 h after UVB irradiation (upper panel) or upon mock-treatment (lower panel). D Expression of mRNA of the indicated genes in mock-treated cells determined by qPCR. Data are represented as mean ± SD of three experiments using one-way analysis of variance with Dunnett’s multiple comparison test (N = 3) (BD) or are representative of at least three independent experiments (A). (****P < 0.001, ***P ≤ 0.001, **P ≤ 0.01, and *P ≤ 0.05, ns = not significant).
Fig. 4
Fig. 4. The Nrf2 pathway is not a target of p62 in SCC cells.
HPKs from three different donors and SCC cell lines were analyzed for expression of the indicated genes. (A) Western blots for protein expression and (B) qPCR for mRNA expression. Expression of the indicated genes in control and p62 knockout SCC12 cells. C Western blots for protein and D qPCR for mRNA expression. E, F Expression of the indicated genes in control and stable p62 overexpressing HPKs. E Protein expression by western blots and F qPCR for mRNA expression. Data are represented as mean ± SD of three experiments (B, D, F) or are representative of three (A, C) or two (E) independent experiments. B 3 donors in the group of HPKs (N = 9) and 3 SCC cell lines (SCC12, SCC13, A431) in the group of SCCs (N = 9) were subjected. P values were calculated with two-tailed unpaired (B) or paired (N = 3) (D, F) t test. (****P < 0.001, ***P ≤ 0.001, **P ≤ 0.01, ns = not significant).
Fig. 5
Fig. 5. NF-κB activity is increased in SCC cells and regulates p62 expression.
A Western blots for expression of the indicated genes in HPKs isolated from three different donors and in SCC cell lines SCC12, SCC13 and A431. B NF-κB activity assay for the indicated family members in HPKs and SCC cell lines. C p62 does not regulate NF-κB activity in SCC12 cells. NF-κB activity was determined in SCC12 cells lacking p62 expression and in control cells. SCC12 (D) and HPKs (E) were mock-treated or with the NF-κB inhibitor BMS-345541. Expression of p62 was analyzed at the protein level by western blot with a quantification of the band corresponding to p62 normalized to β-actin (lower panel), and at the mRNA level by qPCR. Data are represented as mean ± SD of two (C) or three (B, D, E) experiments, or are representative of three (A) or two (D left panel, E left panel) independent experiments. B 3 donors in the group of HPKs (N = 9) and 3 SCC cell lines (SCC12, SCC13, A431) in the group of SCCs (N = 9) were subjected. P values were calculated with two-tailed unpaired (B) or paired (C (N = 2), D (N = 3), E (N = 3)) t-test. (***P ≤ 0.001, **P ≤ 0.01, and *P ≤ 0.05, ns not significant).
Fig. 6
Fig. 6. p62 protects and NLRP1/ASC sensitizes SCC12 cells against anti-neoplastic drugs.
Control and p62 knockout SCC12 cells were mock-treated (A, B) or with mitomycin C or mitoxantrone for 24 h (C, D). A Microscopic picture of control (left panel) and p62 knockout SCC12 cells 5 days after seeding of same cell numbers. LDH release 24 h after B mock or C mitomycin C or D mitoxantrone treatment. SCC12 cells were transfected with scrambled siRNA (SCR) or siRNA targeting ASC or NLRP1 mRNA. LDH release after E mock or F mitomycin C or G mitoxantrone treatment. Control and p62 knockout SCC12 cells were transfected with scrambled, ASC, or NLRP1 mRNA targeting siRNA. H Western blot for expression of the indicated genes. LDH release 24 h after I mock-treatment or with J mitomycin C or K mitoxantrone. Data are represented as mean ± SD of three (BG, JK) or two (I) experiments, or are representative of three (H) independent experiments. P values were calculated with two-tailed paired (N = 3) (BD, IK) t test, or one-way analysis of variance with Dunnett’s multiple comparison test (N = 3) (EG). (****P < 0.001, ***P ≤ 0.001, **P ≤ 0.01, and *P ≤ 0.05, ns not significant).

Similar articles

Cited by

References

    1. Nestle FO, Di Meglio P, Qin JZ, Nickoloff BJ. Skin immune sentinels in health and disease. Nat Rev Immunol. 2009;9:679–91. doi: 10.1038/nri2622. - DOI - PMC - PubMed
    1. Alam M, Ratner D. Cutaneous squamous-cell carcinoma. N. Engl J Med. 2001;344:975–83. doi: 10.1056/NEJM200103293441306. - DOI - PubMed
    1. Chen AC, Halliday GM, Damian DL. Non-melanoma skin cancer: carcinogenesis and chemoprevention. Pathology. 2013;45:331–41. doi: 10.1097/PAT.0b013e32835f515c. - DOI - PubMed
    1. Bernard JJ, Gallo RL, Krutmann J. Photoimmunology: how ultraviolet radiation affects the immune system. Nat Rev Immunol. 2019;19:688–701. doi: 10.1038/s41577-019-0185-9. - DOI - PubMed
    1. Jackson SP, Bartek J. The DNA-damage response in human biology and disease. Nature. 2009;461:1071–8. doi: 10.1038/nature08467. - DOI - PMC - PubMed

Publication types

MeSH terms