. 2023 Feb;7(2):94-109.
doi: 10.1038/s41551-022-00964-5. Epub 2022 Dec 29.

Intravascularly infused extracellular matrix as a biomaterial for targeting and treating inflamed tissues

Affiliations

Intravascularly infused extracellular matrix as a biomaterial for targeting and treating inflamed tissues

Martin T Spang et al. Nat Biomed Eng. 2023 Feb.

Abstract

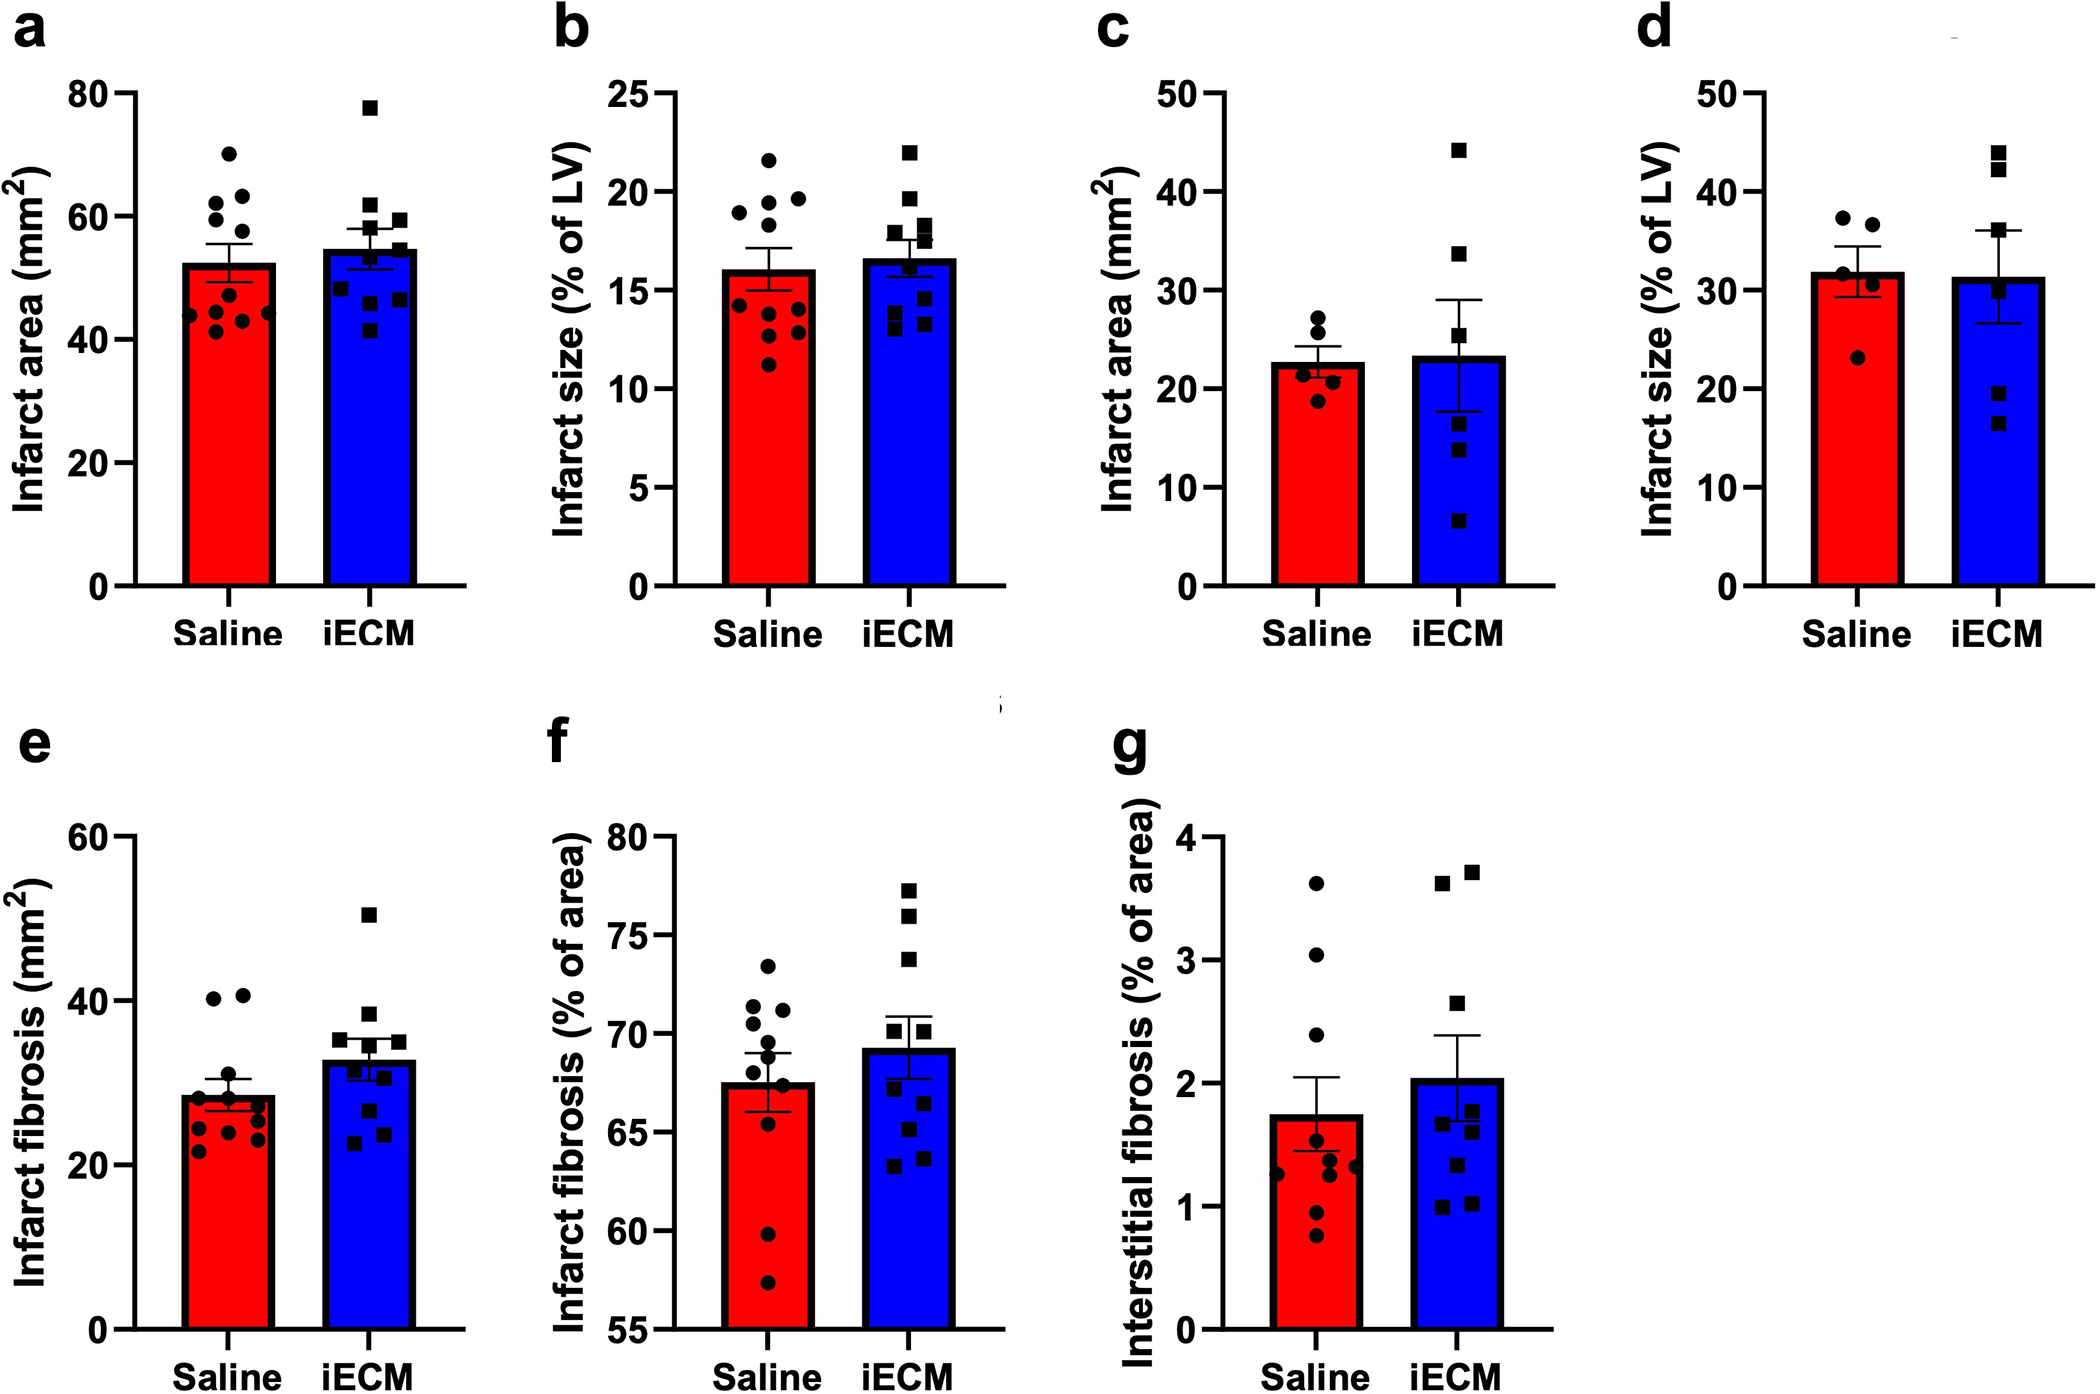
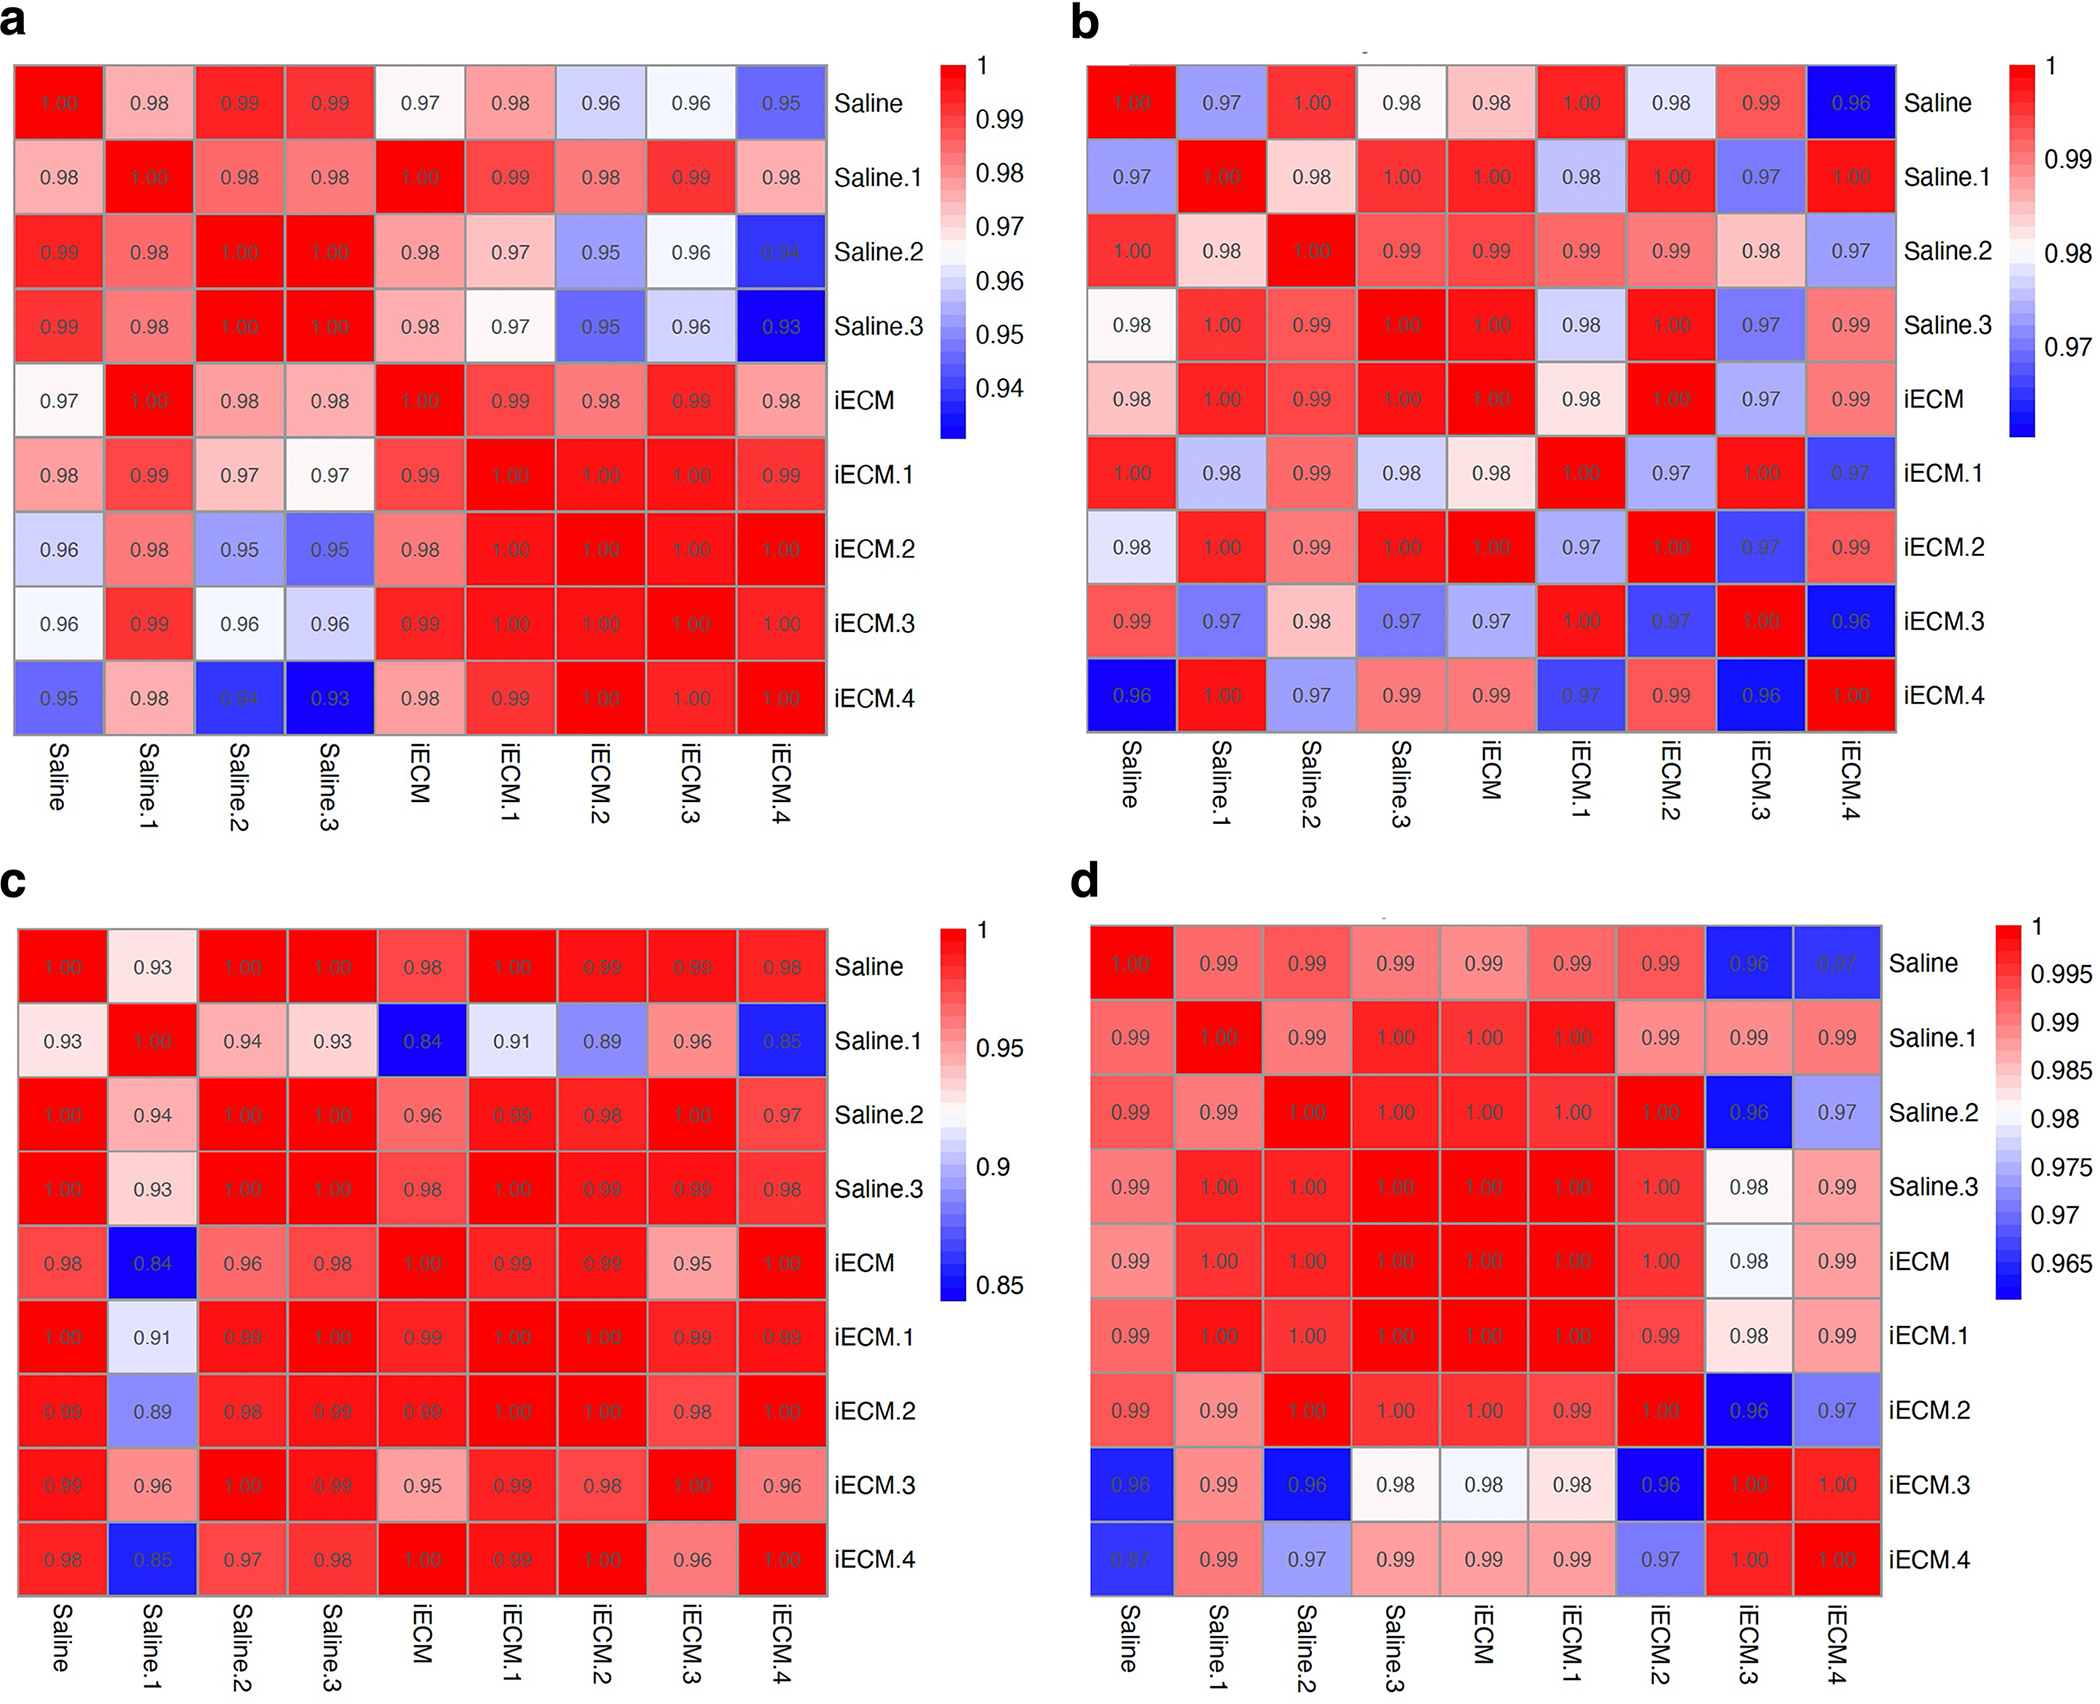
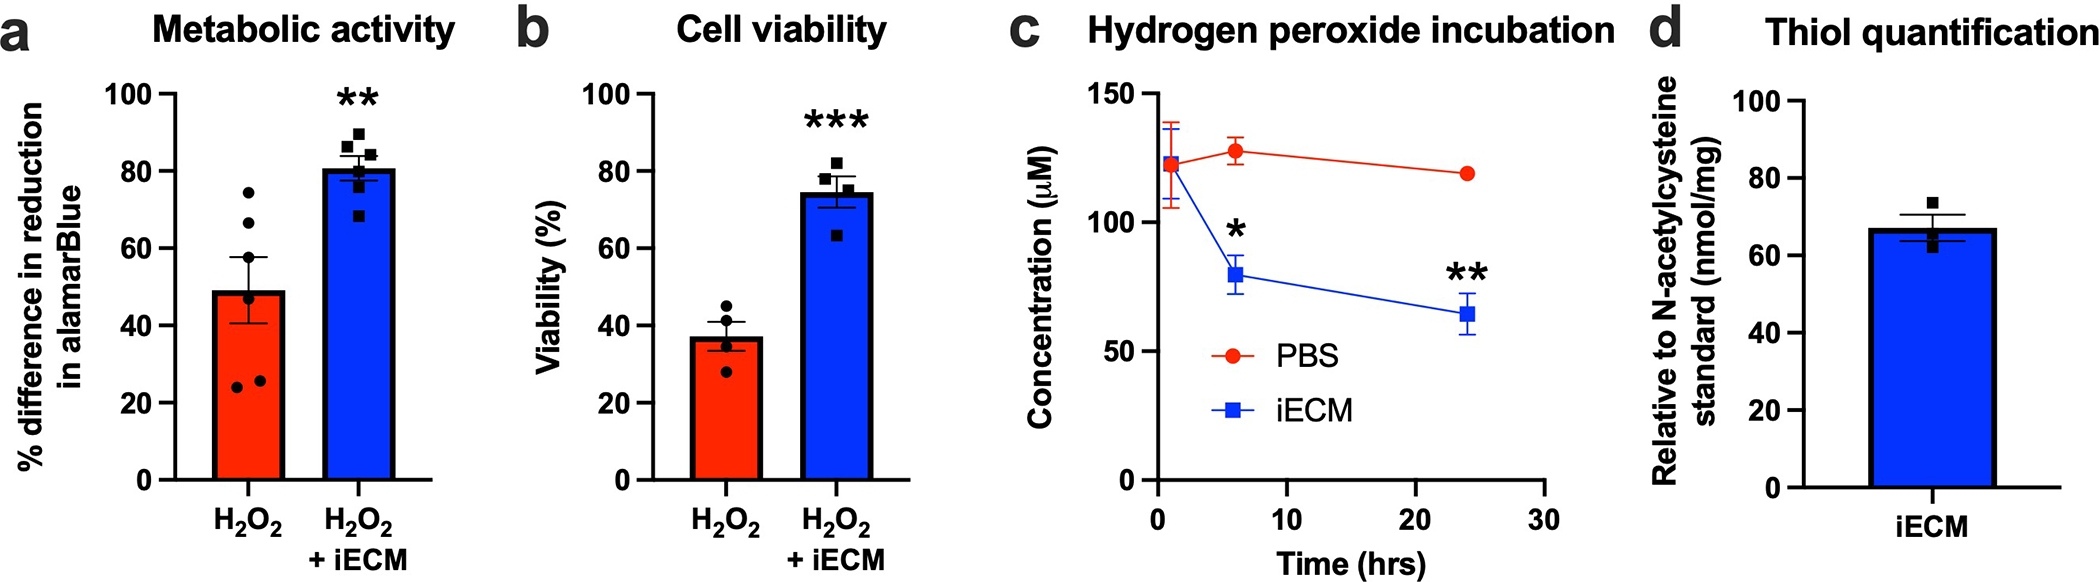
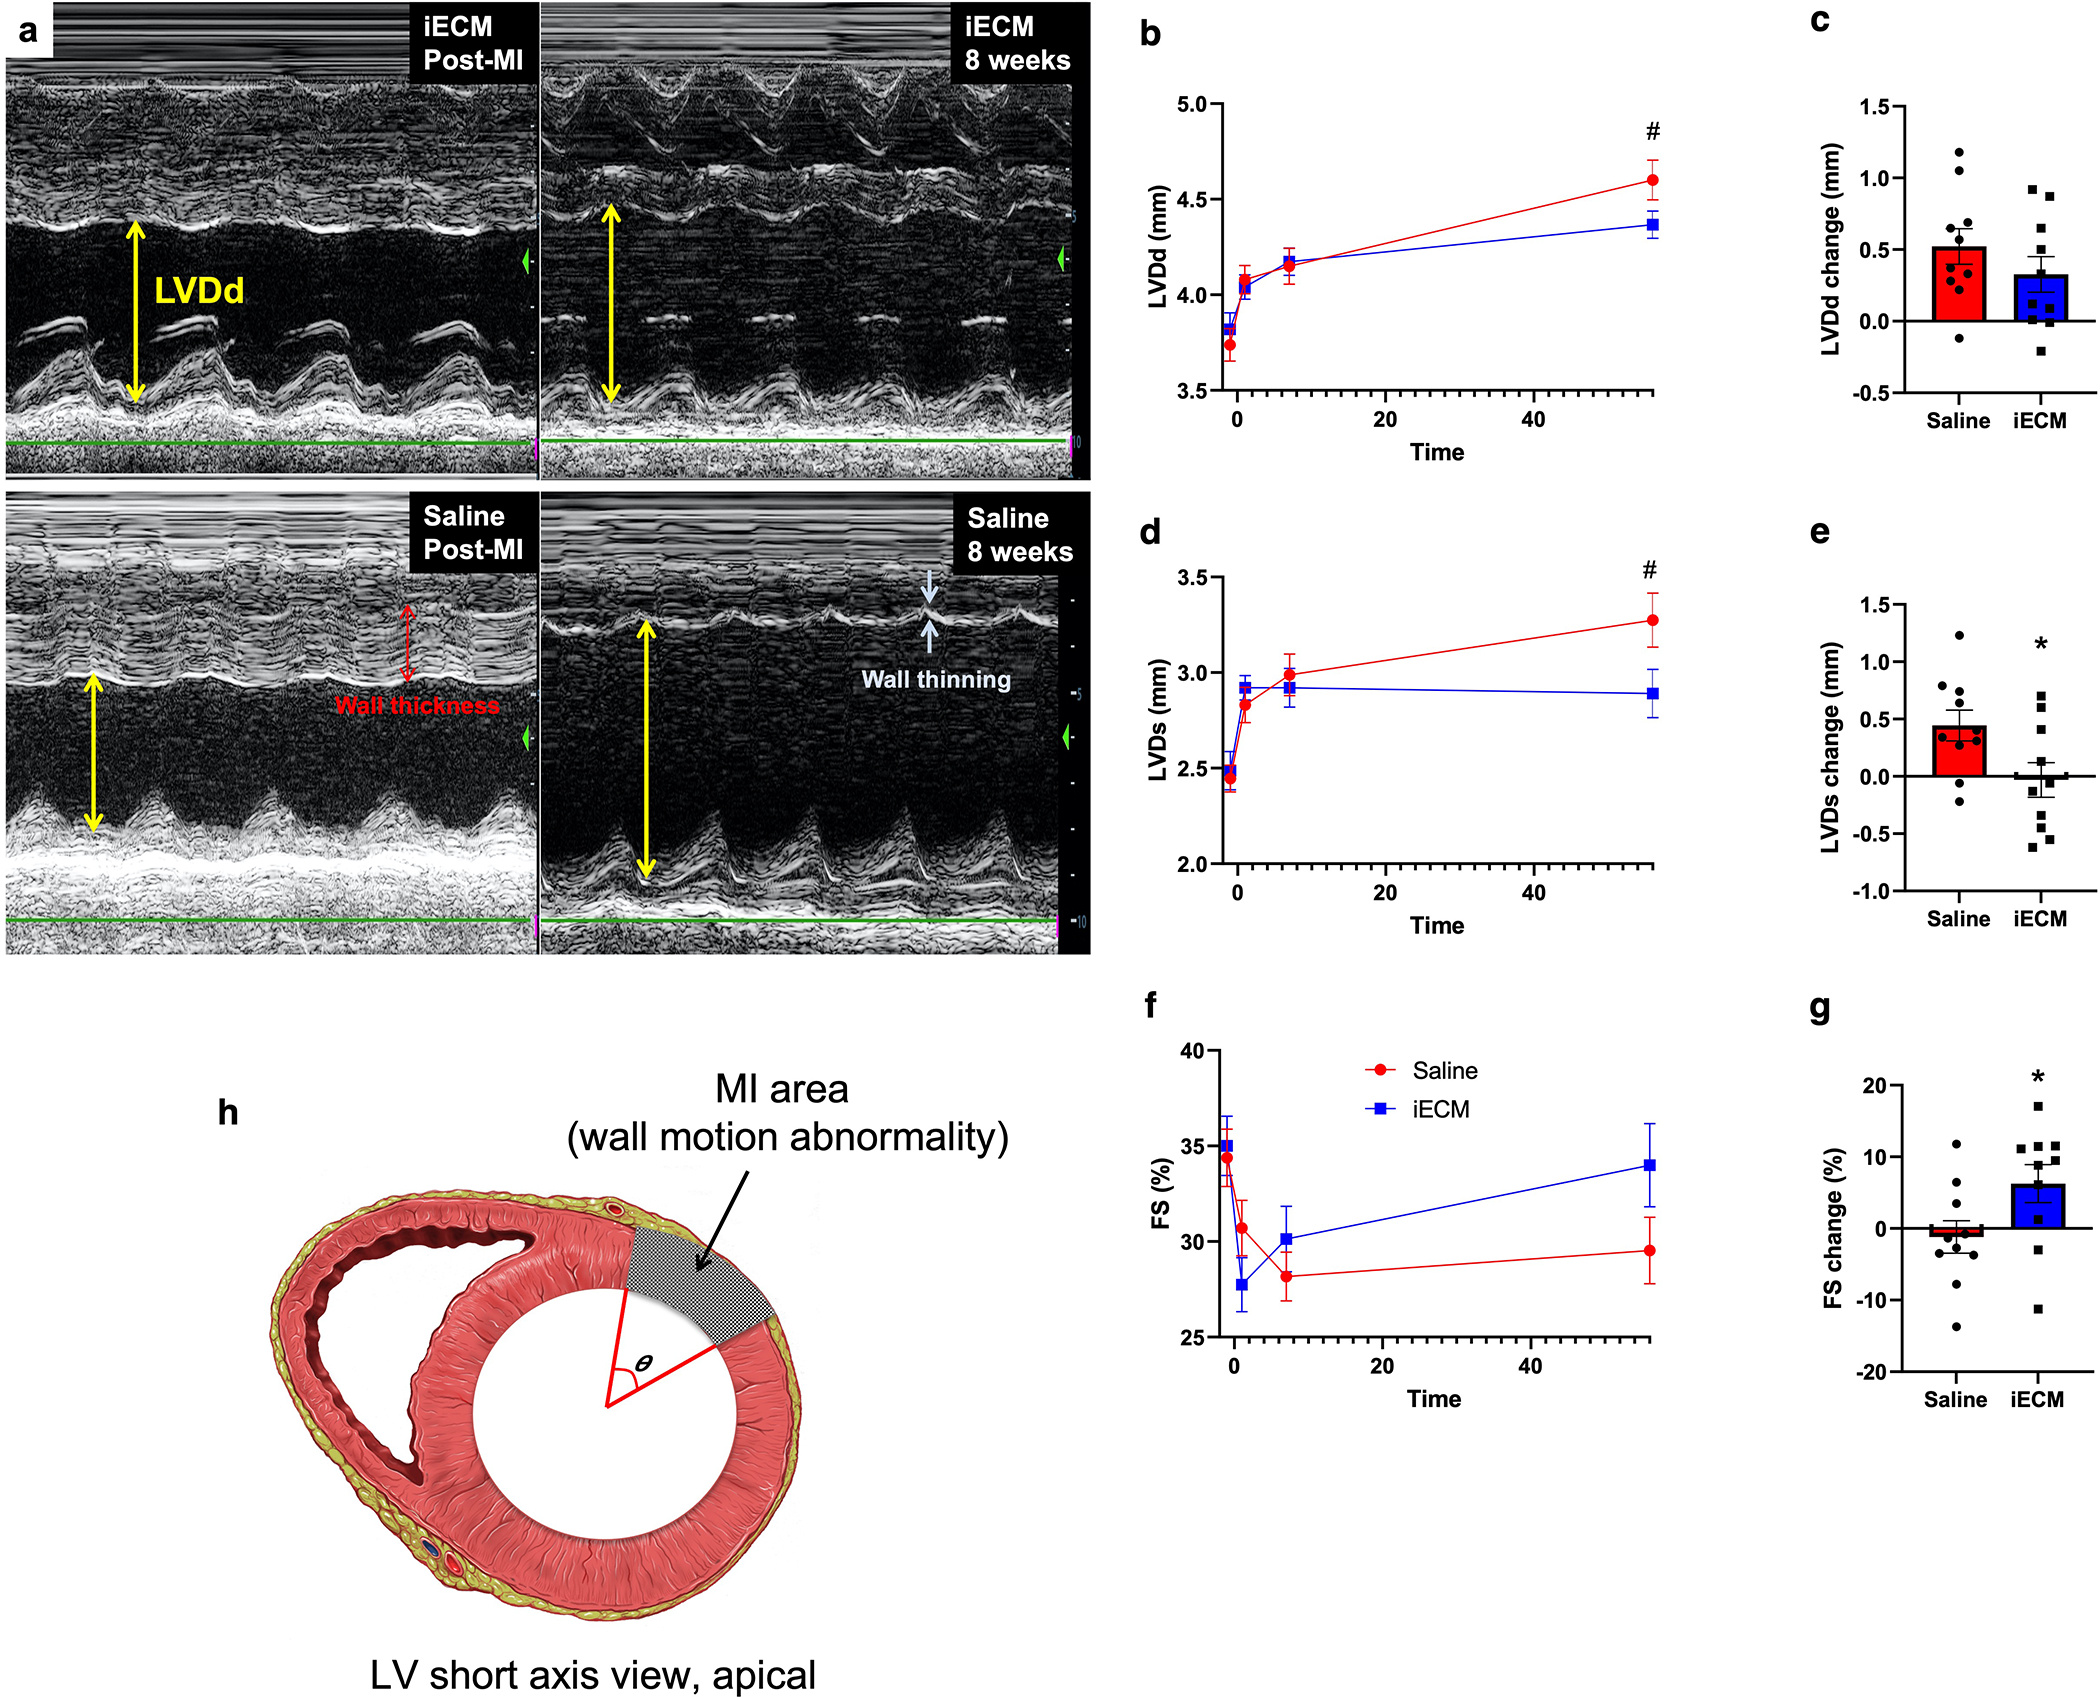
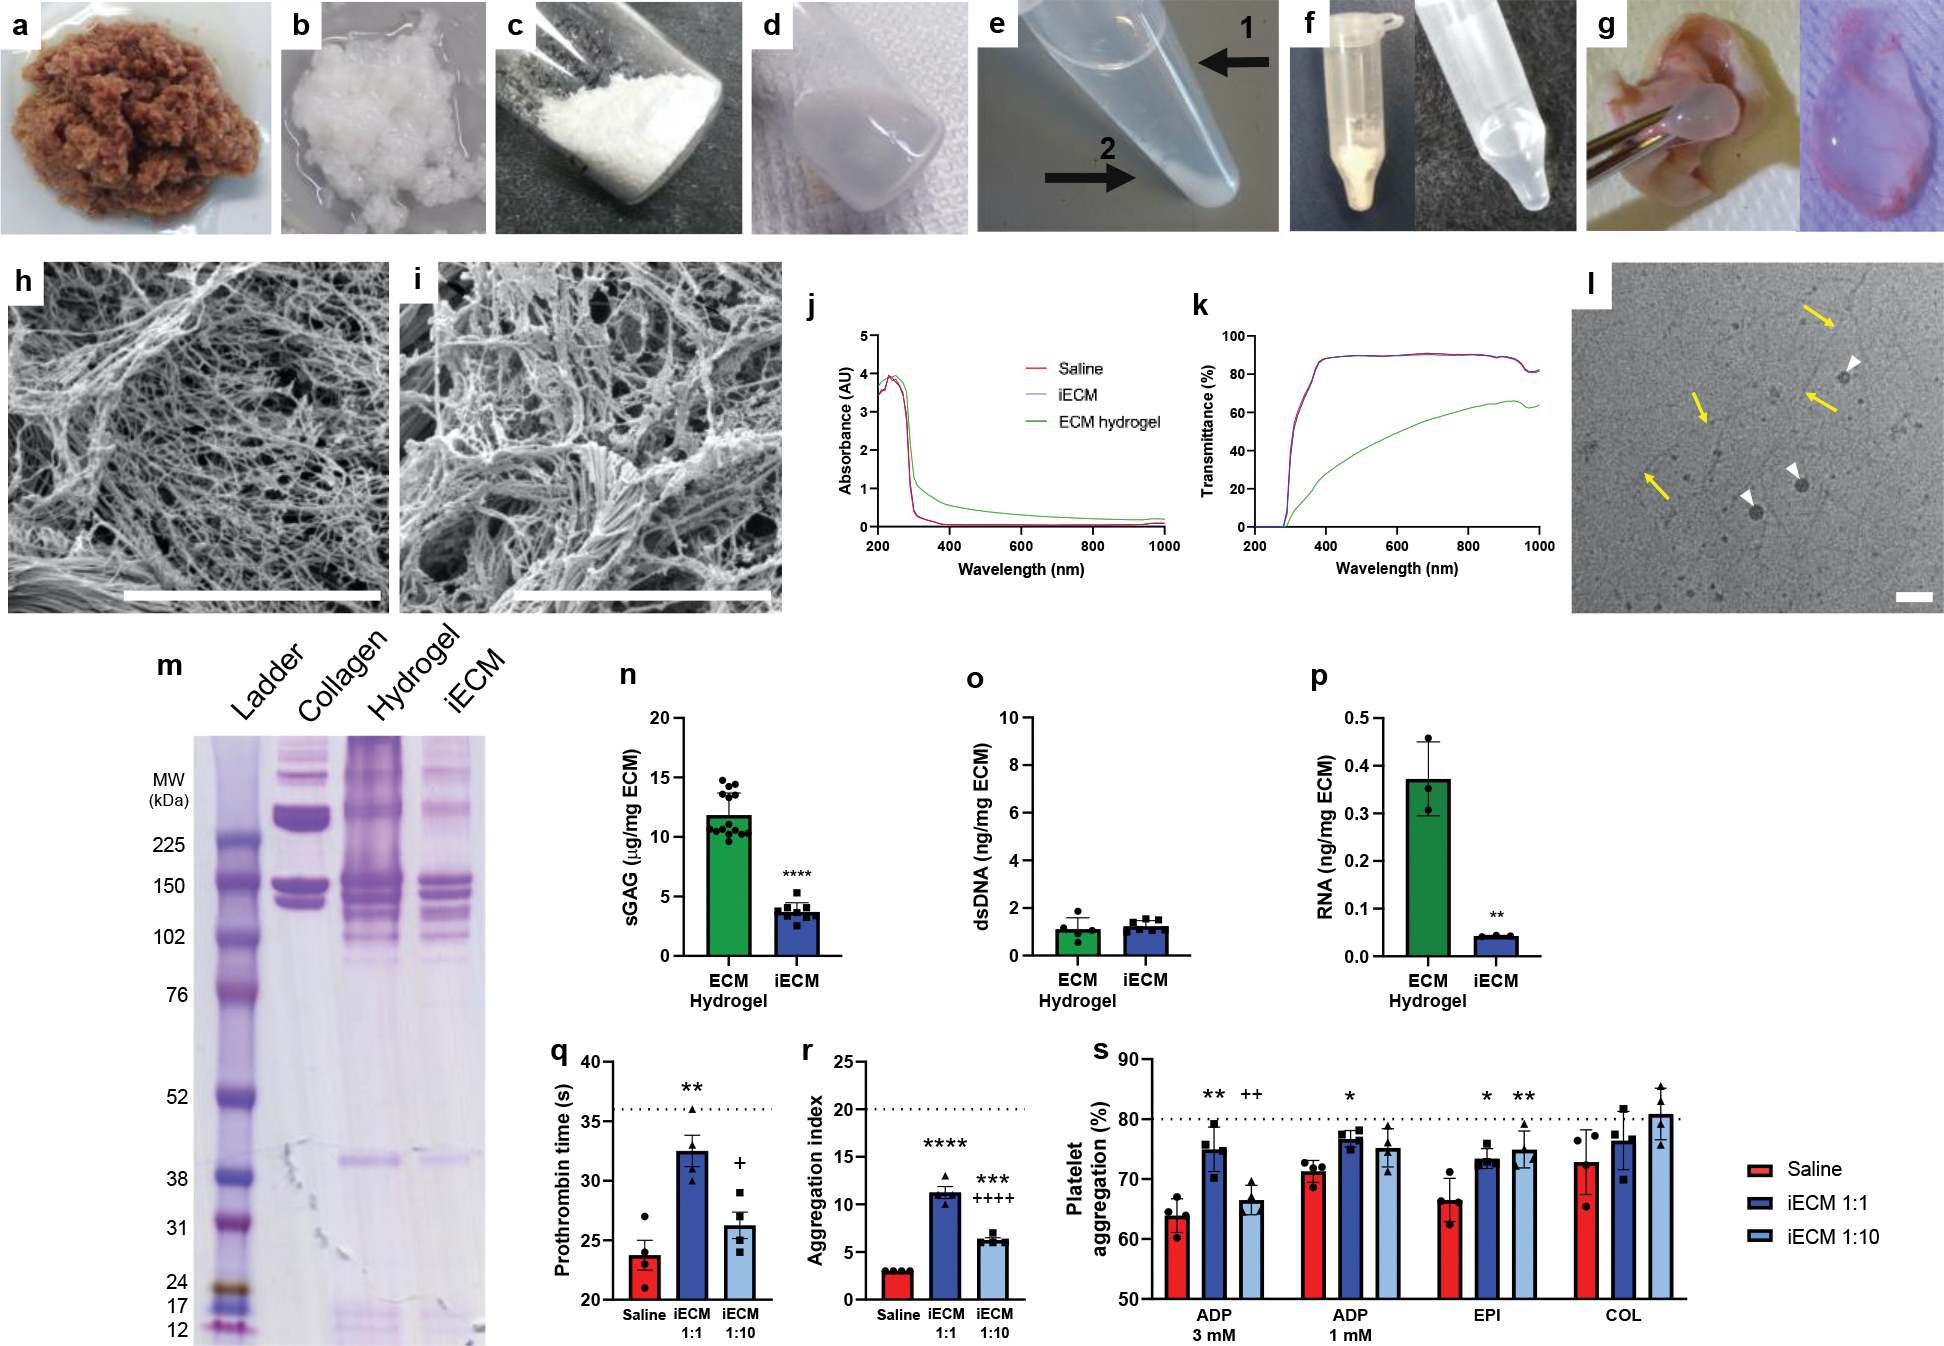
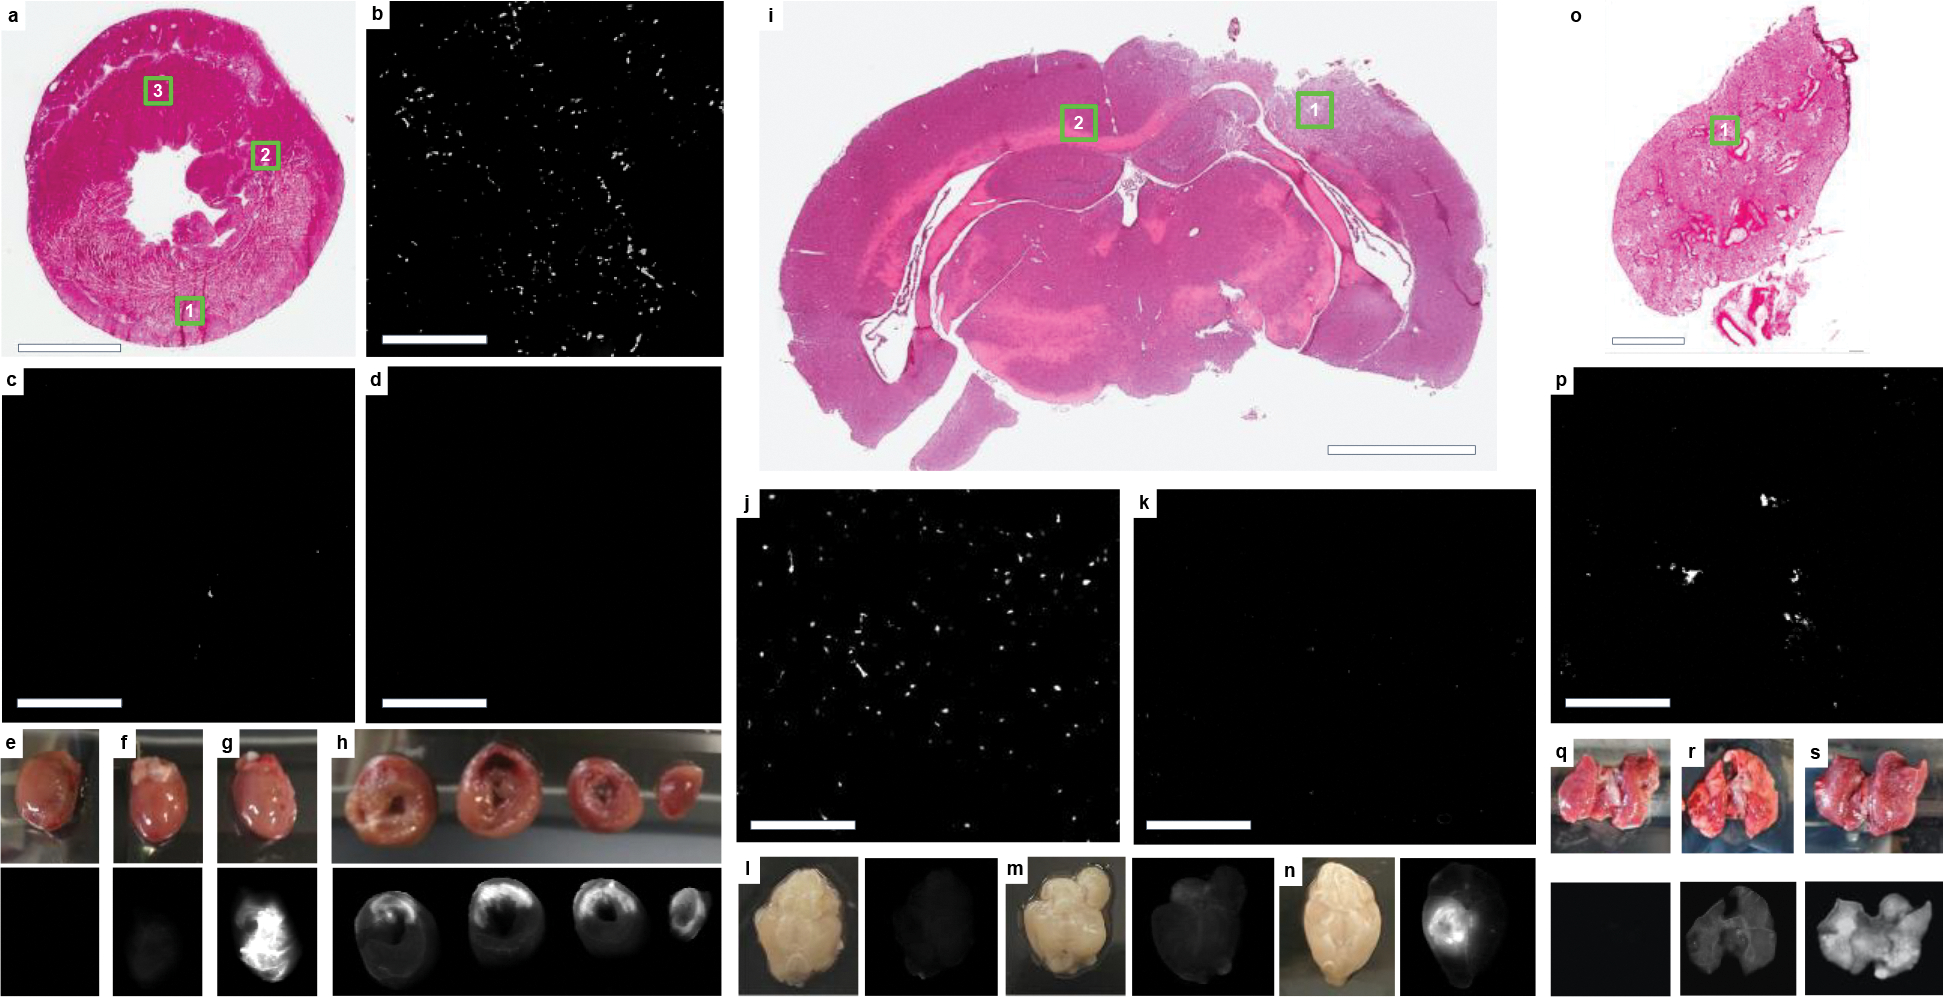
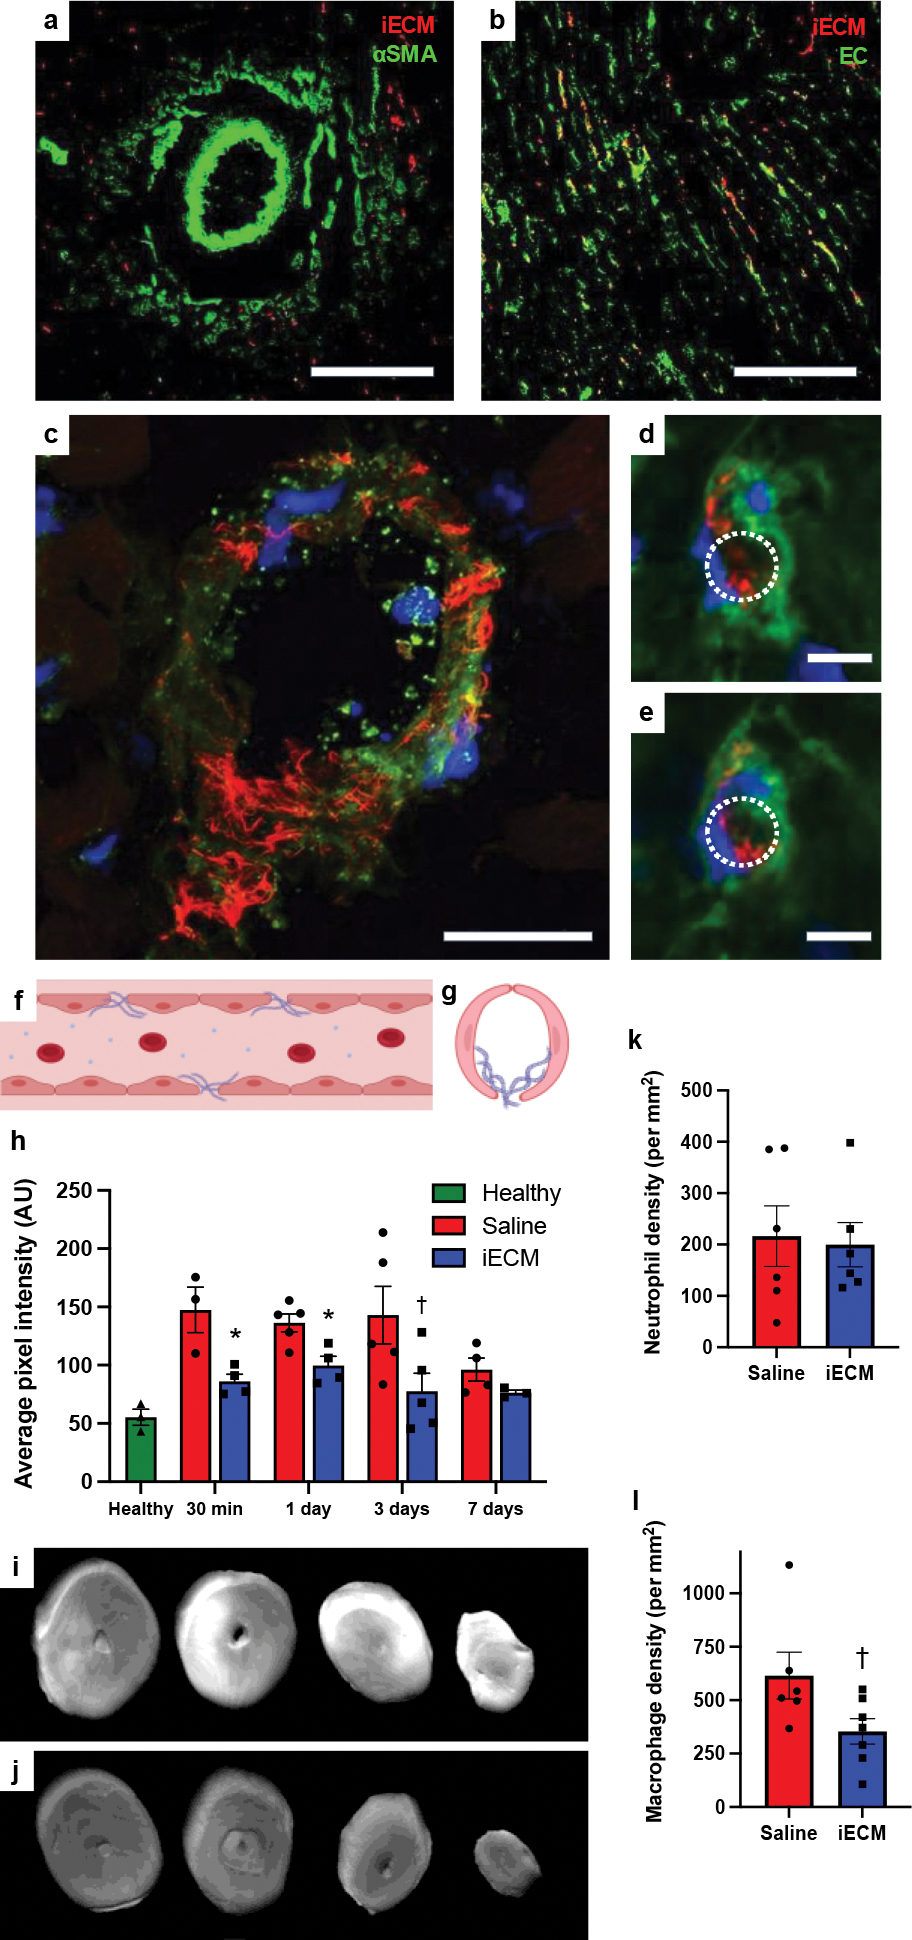
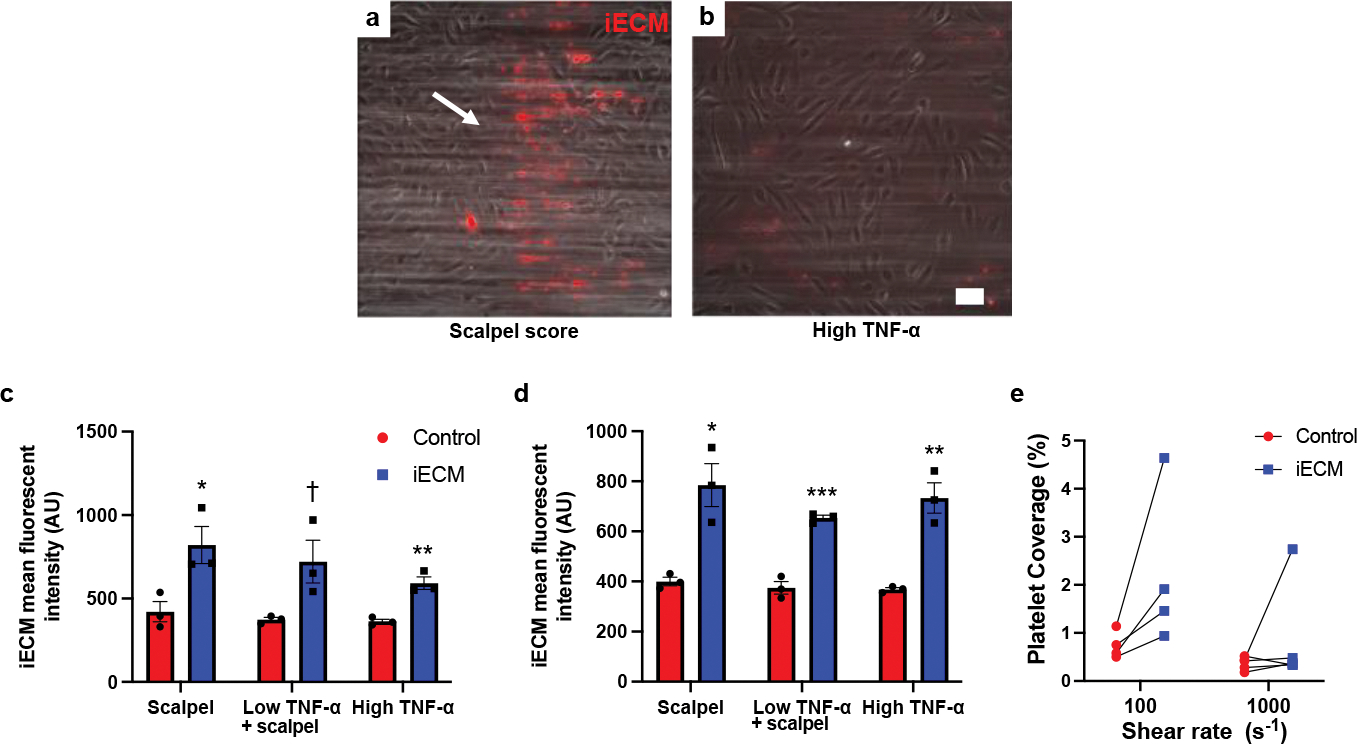
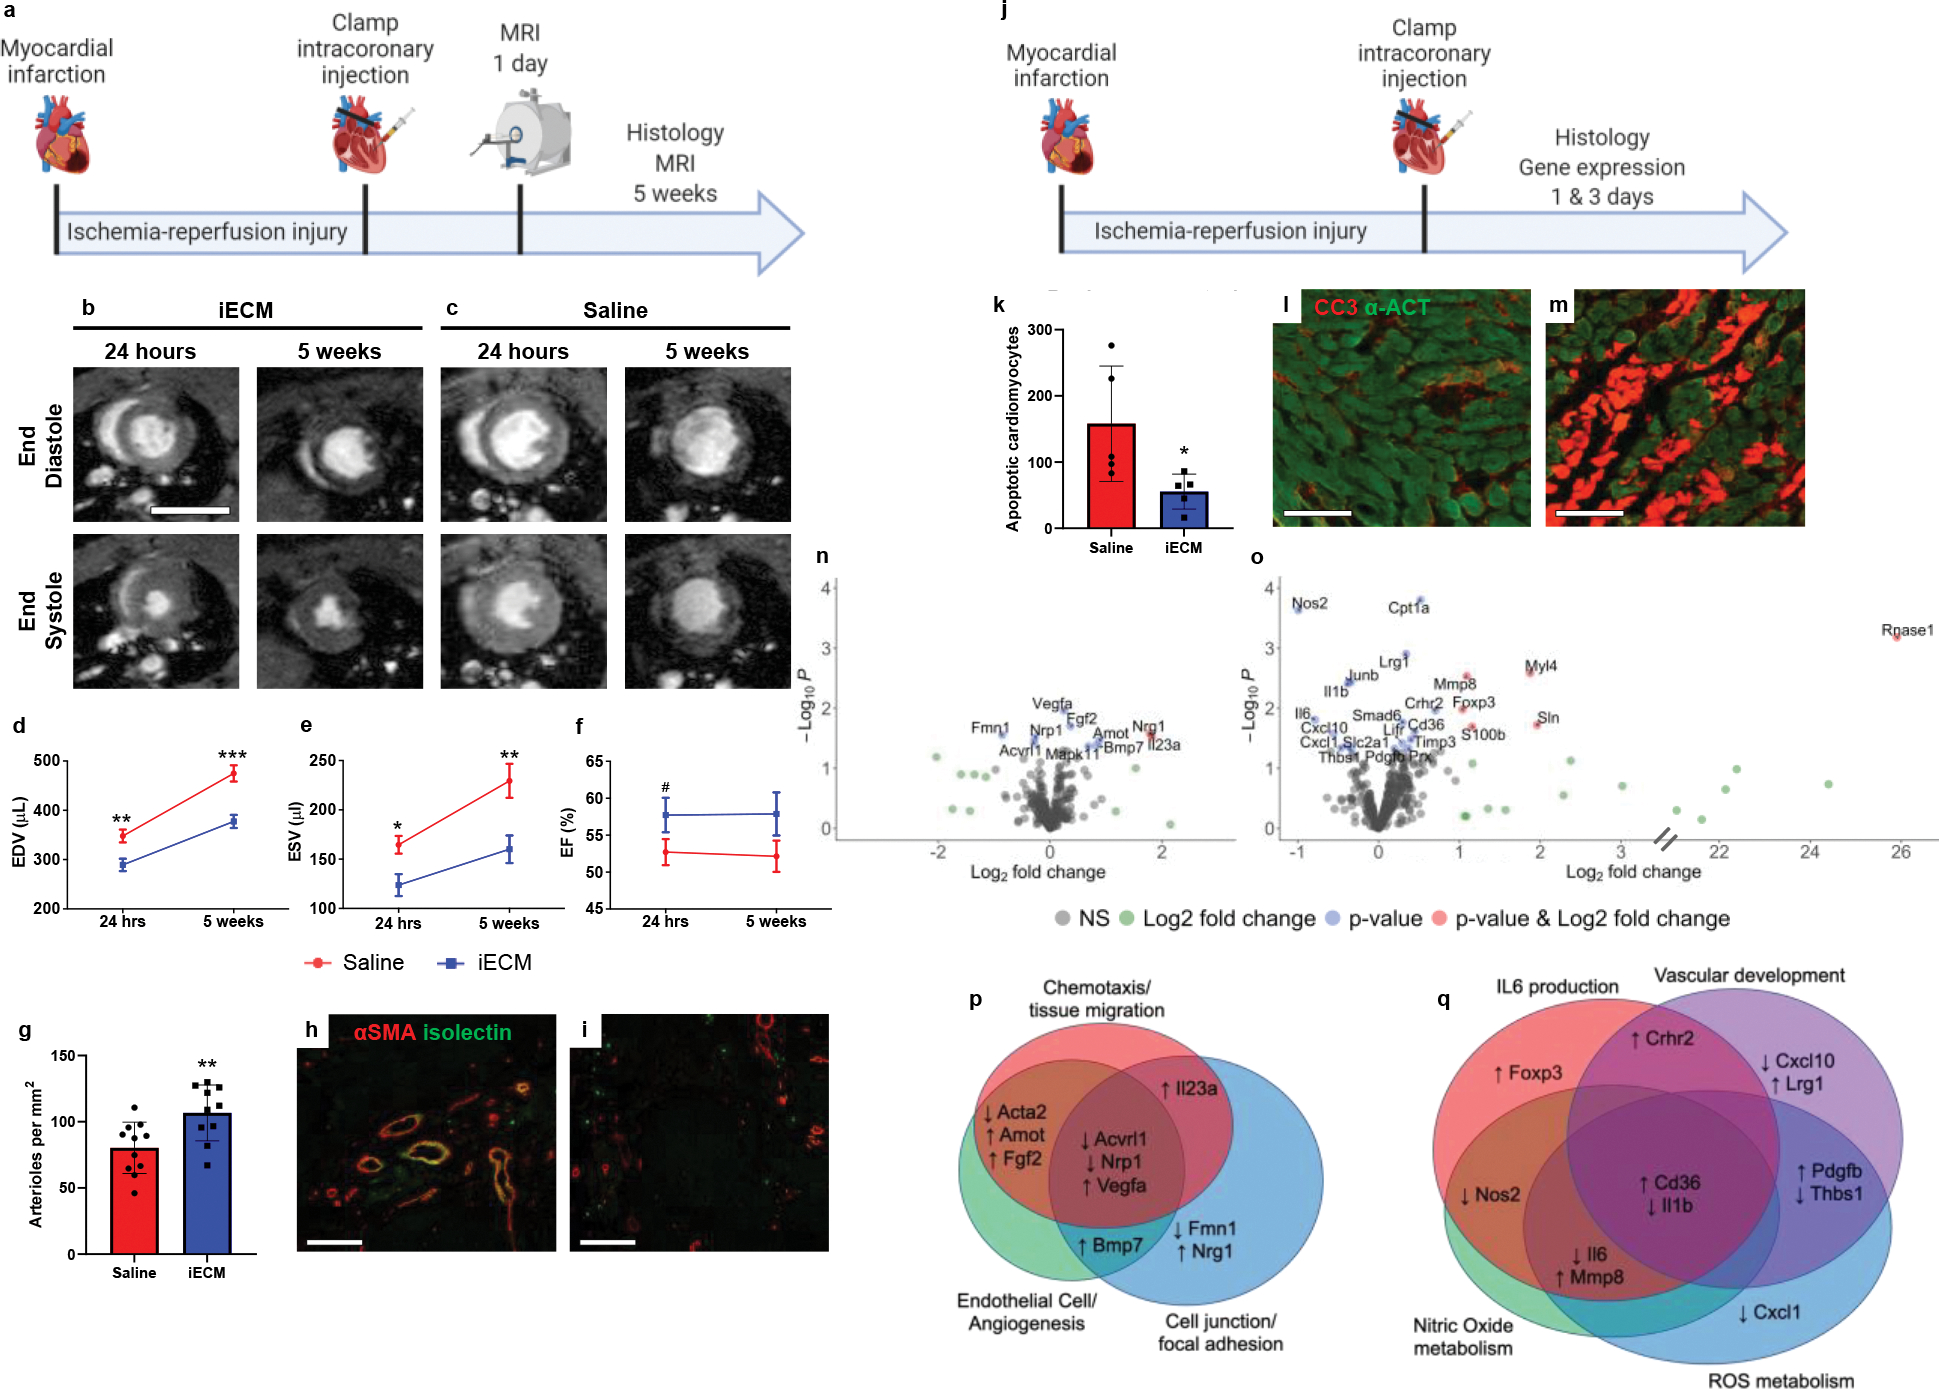
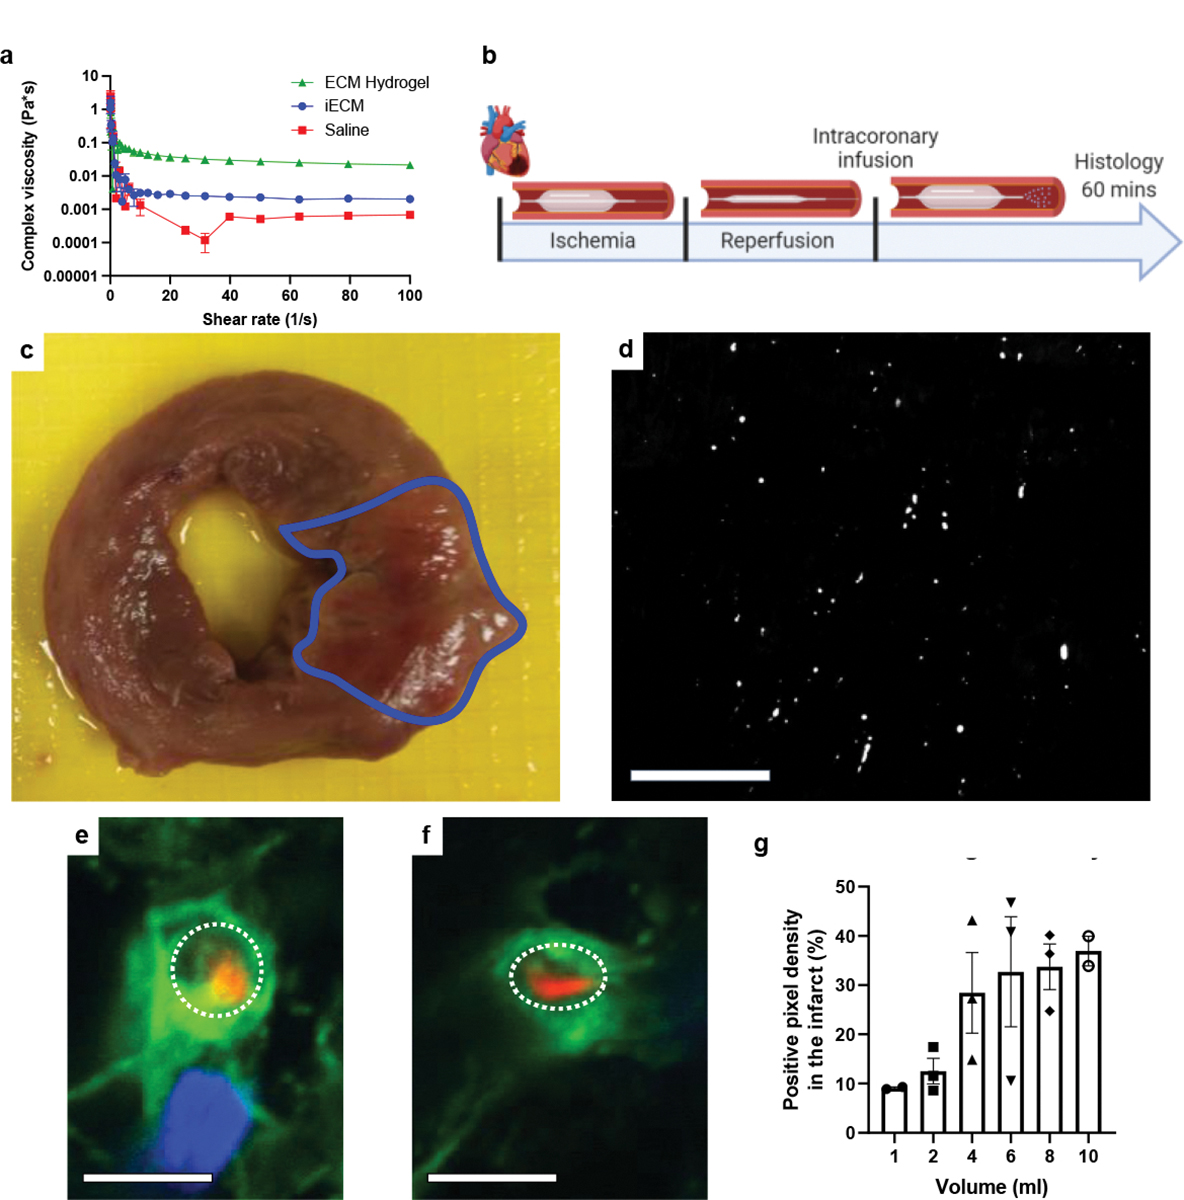
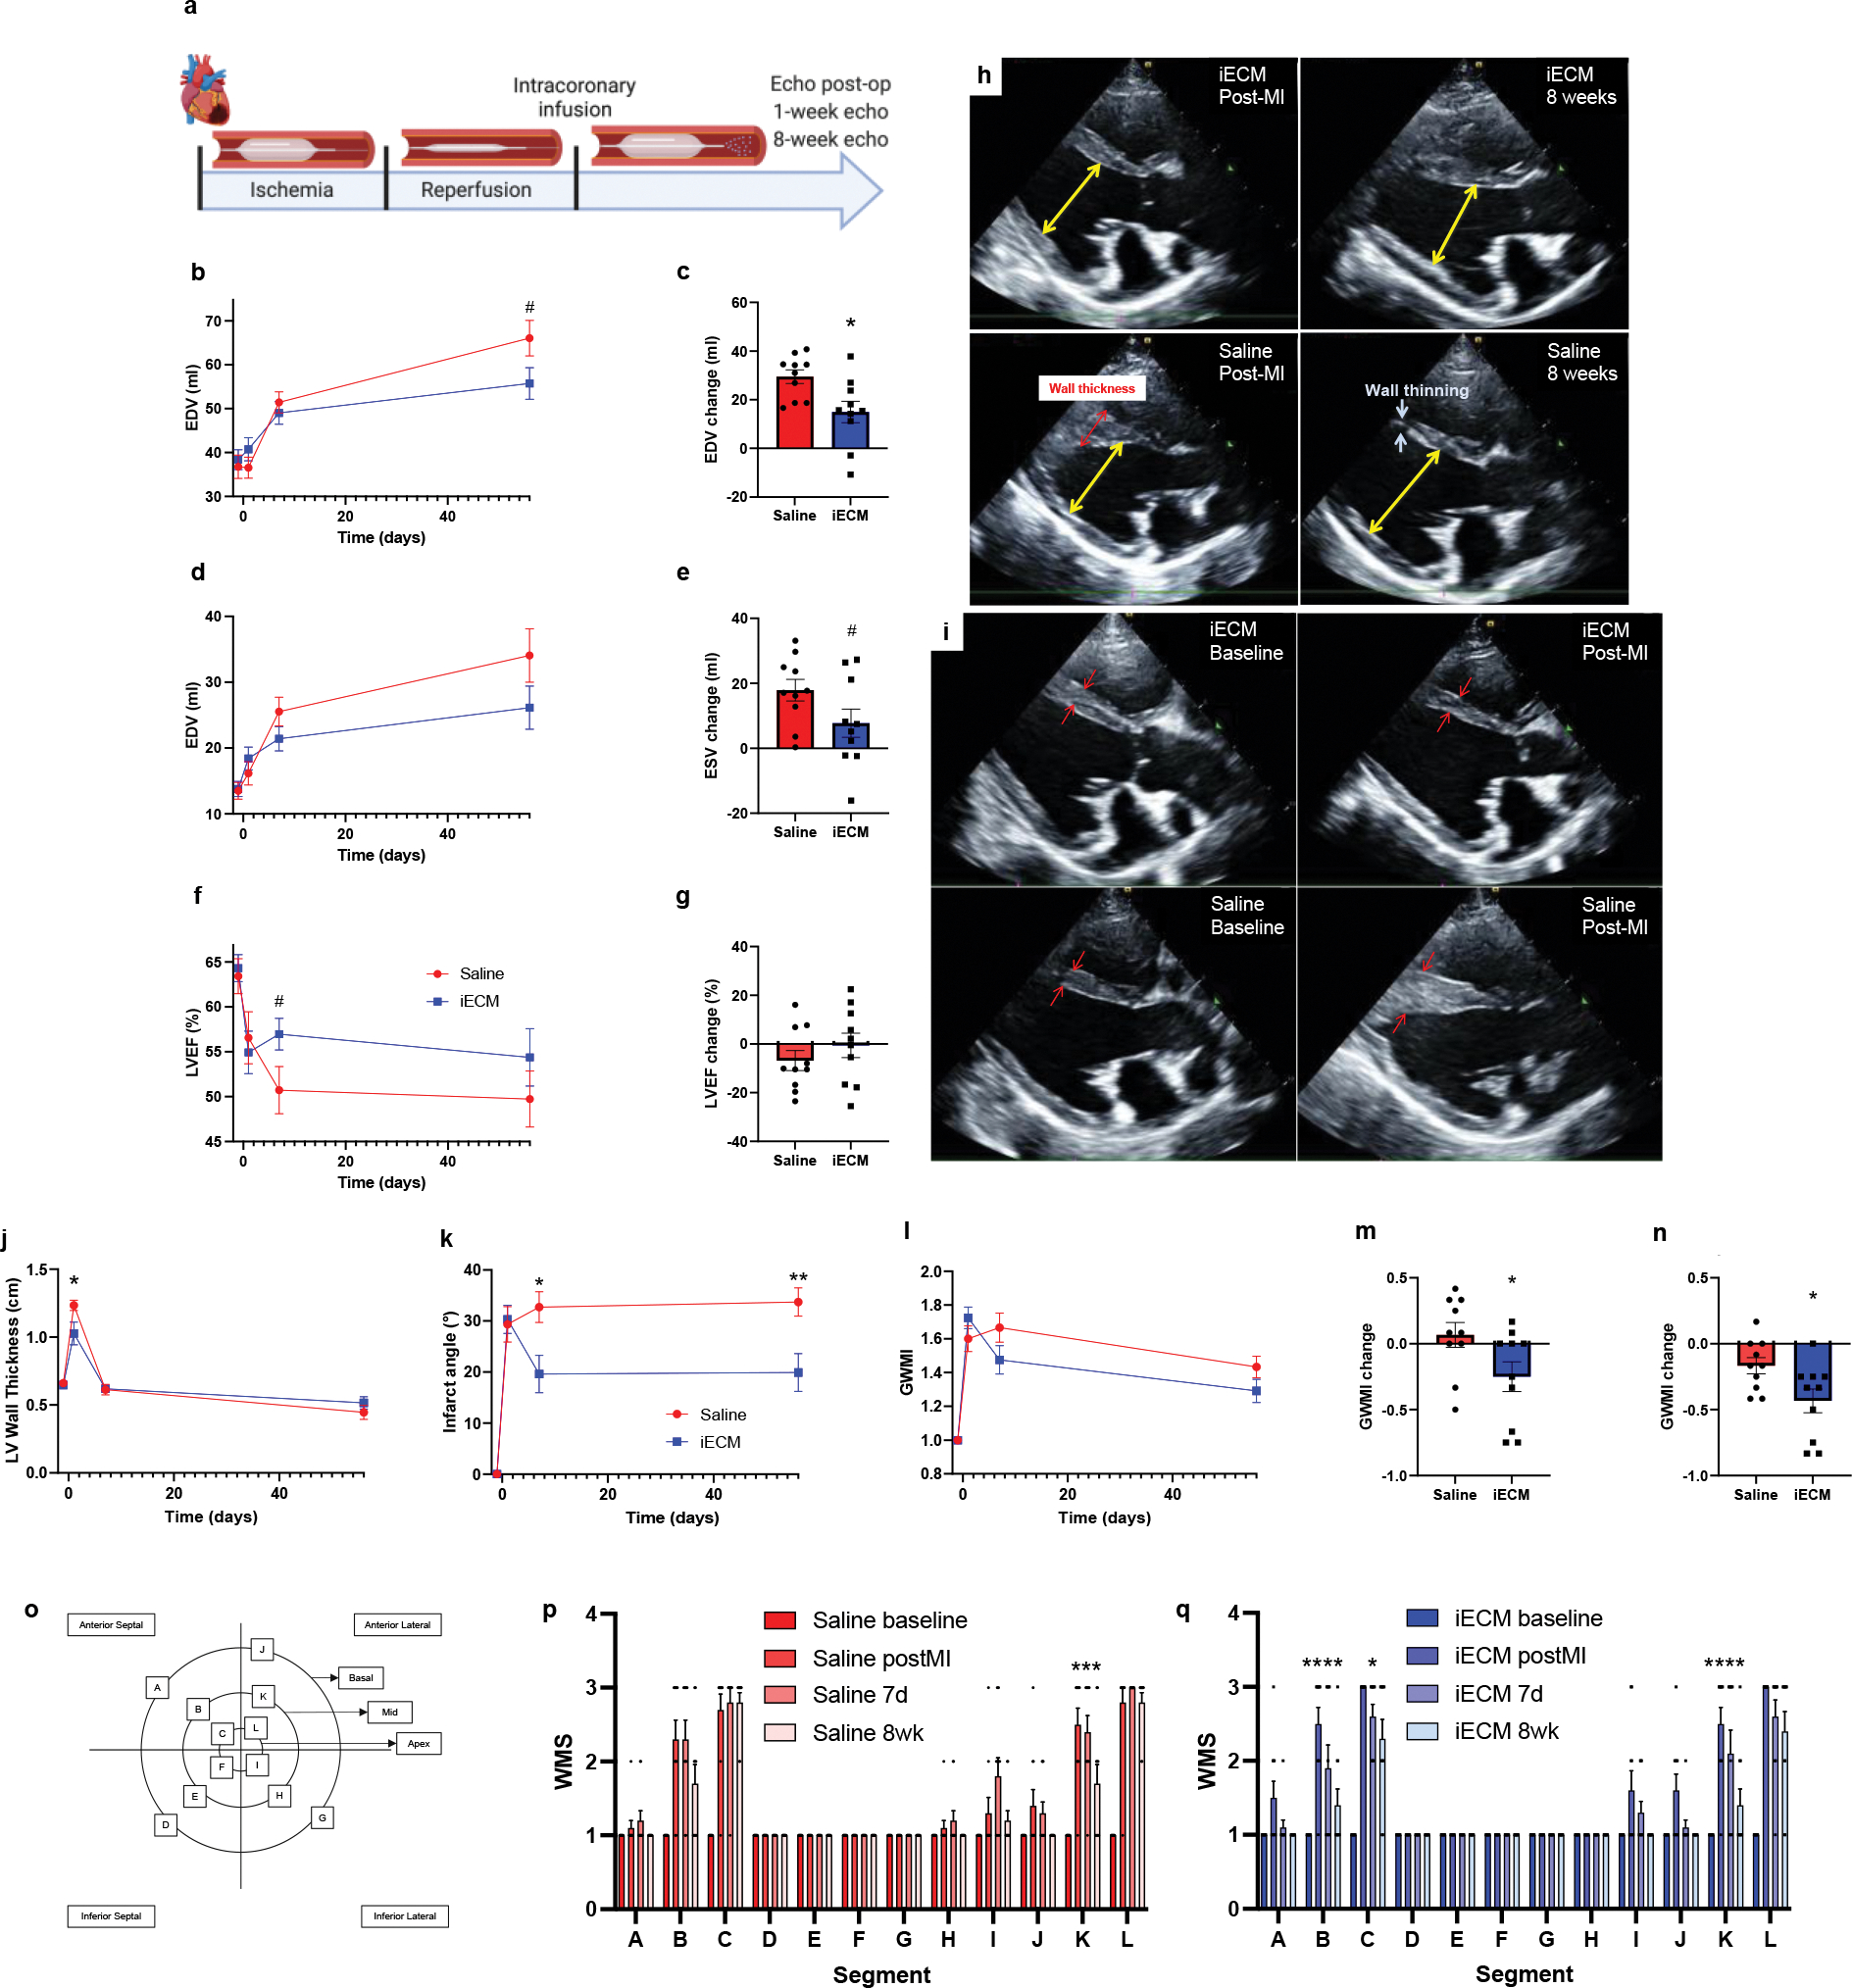
Decellularized extracellular matrix in the form of patches and locally injected hydrogels has long been used as therapies in animal models of disease. Here we report the safety and feasibility of an intravascularly infused extracellular matrix as a biomaterial for the repair of tissue in animal models of acute myocardial infarction, traumatic brain injury and pulmonary arterial hypertension. The biomaterial consists of decellularized, enzymatically digested and fractionated ventricular myocardium, localizes to injured tissues by binding to leaky microvasculature, and is largely degraded in about 3 d. In rats and pigs with induced acute myocardial infarction followed by intracoronary infusion of the biomaterial, we observed substantially reduced left ventricular volumes and improved wall-motion scores, as well as differential expression of genes associated with tissue repair and inflammation. Delivering pro-healing extracellular matrix by intravascular infusion post injury may provide translational advantages for the healing of inflamed tissues 'from the inside out'.


Conflict of interest statement

Competing interests

KLC and AND hold equity in Ventrix, Inc. KLC is a co-founder, consultant, and board member of Ventrix, Inc. The other authors declare no competing interests.

Figures

Extended Data Fig. 1 |
Extended Data Fig. 1 |. Histological measurements post-infusion show no significant differences in infarct size or fibrosis between iECM and saline infused rats.
Infarct area at 5 weeks (a,b) and 3 days (c,d) post-infusion, reported as area (a,c) and percentage of the LV (b,d). Infarct fibrosis reported as area (e) and percentage of infarct area (f). g, Interstitial fibrosis of the remote myocardium reported as a percentage of area. N=5 for saline and n=6 for iECM for day 3 measurements, and n=10 for both groups for 5 week measurements. Data are mean ± SEM. Add data are biological replicates.
Extended Data Fig. 2 |
Extended Data Fig. 2 |. Correlation matrices for the NanoString nCounter data.
Correlation matrix for day 1 post-infusion significantly differentially expressed genes only (a) and all genes in the Nanostring nCounter custom cardiac codeset (b). Correlation matrix for day 3 post-infusion significantly differentially expressed genes (c) and all genes in the Nanostring nCounter custom cardiac codeset (d). The Nanostring panel used was a 380 gene custom panel designed to probe for differences in gene expression across a wide range of myocardial injury models.
Extended Data Fig. 3 |
Extended Data Fig. 3 |. Effect of iECM on metabolic activity and viability of rat cardiac endothelial cells, ROS scavenging, and thiol content.
Percent difference in reduction in alamarBlue activity of rat cardiac endothelial cells in response to hydrogen peroxide with and without iECM, relative to controls with no hydrogen peroxide (a, n=6 both groups, **p=0.006). Percent viability as measured by Calcein-AM staining of rat cardiac endothelial cells in response to hydrogen peroxide with and without iECM, relative to controls with no hydrogen peroxide (b, n=4 both groups, ***p<0.001). Concentration of hydrogen peroxide was monitored following incubation with either PBS or iECM, showing a continuing decrease with iECM (c, *p=0.01, **p=0.003, n=3 for both groups at 1 and 24 hrs, n=2 at 6 hrs). Thiol content was determined compared to N-acetylcysteine standard in iECM per mg of material (d, n=3). Data are mean ± SEM. All data are biological replicates and were evaluated with a two tailed unpaired t-test.
Extended Data Fig. 4 |
Extended Data Fig. 4 |. Additional echocardiography results showing that iECM infusions mitigate negative LV remodeling in a pig acute MI model.
a, Representative M-mode echocardiographic images showing that iECM mitigates negative LV remodeling. Yellow arrows represent LV diastolic dimension, red arrows represent wall thickness, and white arrows represent wall thinning. b-g, LV diastolic dimension (LVDd, #p=0.08), LV systolic dimension (LVDs), and fractional shortening (FS) over time (b,d,f) and changes from post-MI to 8 weeks post-MI (c, e (*p=0.03), g (*p=0.047)). h, Diagram demonstrating how infarct angle was measured. N=10 all groups. Data are mean ± SEM. All data are biological replicates and were evaluated with a two tailed unpaired t-test.
Figure 1:
Figure 1:
Generation and architecture of infusible extracellular matrix (iECM). a, Isolated left ventricular myocardium is cut into pieces. b, Decellularized ECM after continuous agitation in 1% sodium dodecyl sulfate. c, Lyophilized and milled ECM. d, Liquid digested ECM hydrogel. e, Fractionated ECM hydrogel after centrifugation; (1) supernatant low molecular weight fraction (iECM) and (2) high molecular weight pellet. f, Lyophilized (left) and resuspended (right) iECM. g, Subcutaneous injection and gelation of iECM. Scanning electron microscopy images showing nanofibrous architecture of ECM hydrogel (h) and iECM (i) following in situ gelation. Scale bar is 5 μm. j-p, Characterization of iECM. j-k, Optical measurements of iECM vs liquid ECM hydrogel. iECM showed minimal differences in optical properties from saline whereas the ECM hydrogel had increased absorbance and decreased transmittance. j, Absorbance sweep of iECM, ECM hydrogel, and saline. k, Calculated transmittance of iECM, ECM hydrogel, and saline. l, Cryogenic transmission electron microscopy image of iECM in solution showing nanoscale fibrillar architecture (yellow arrows). White arrowheads indicate ice. Scale bar is 100 nm. m, Polyacrylamide gel electrophoresis of ladder (Full-Range RPN800E, lane 1), collagen (lane 2), ECM hydrogel (lane 3), and iECM (lane 4), showing depletion of high molecular weight (>200 kDa) peptides/proteins in iECM. n, Sulfated glycosaminoglycan (sGAG) content was significantly lower in iECM (n=9, 9 vials sampled across 2 batches) vs ECM hydrogel (n=15, 15 vials sampled across 2 batches). ****p<0.0001. o, Double stranded DNA (dsDNA) content was not significantly different between iECM (n=7, 7 vials sampled across 2 batches) and ECM hydrogel (n=5, 5 vials sampled across 2 batches). p, Total RNA content was significantly lower in iECM (n=3 batches) vs. ECM hydrogel (n=3 batches). **p=0.002 q-s, Hemocompatibility of infusible extracellular matrix (iECM) with human blood and platelet rich plasma (n=4 all groups). q, Prothrombin time. **p=0.004 compared to saline; +p=0.02 compared to iECM 1:1. r, Red blood cell aggregation index. ****p<0.0001 compared to saline; ***p<0.001 compared to saline; ++++p<0.0001 compared to iECM 1:1. s, Platelet aggregation following addition of agonists: adenosine diphosphate (ADP; 3mM: **p=0.002 compared to saline, ++p=0.009 compared to iECM 1:1; 1 mM: *p=0.02 compared to saline), epinephrine (EPI; *p=0.02 compared to saline; **p<0.007 compared to saline), collagen (COL). Standard ranges for each parameter are indicated below dashed lines and data are biological replicates. Data are mean ± SEM. n-p were evaluated with a two tailed unpaired t-test. q-s were evaluated with one way ANOVA with Tukey post-hoc test.
Figure 2:
Figure 2:
iECM infusions target injured tissues. a, H&E short axis section of an acute MI heart following iECM infusion, scale bar 3 mm. b-d, Fluorescence images for locations shown in insets in a of infarcted myocardium (b, 1), neighboring myocardium (c, 2), and remote myocardium (d, 3), scale bars are 200 μm. e-h, Heart near-infrared scans of saline without dye (e), trilysine conjugated with VivoTag®-S 750 (VT750) (f), and iECM conjugated with VT750 (g). h, Short axis slices of an iECM infused heart from the base to the apex (left to right), infarct regions oriented in the upper portion of the slices. iECM tracking using VT750 24 hours following infusion and MI procedure. i, H&E section of a brain following traumatic brain injury (TBI) and iECM infusion. j-k, Fluorescence images for locations shown in insets in i of injured brain (j, 1) or remote brain (k, 2). Near-infrared scans of brain infused with saline without dye following TBI (l), healthy brain infused with iECM conjugated with VT750 (m), and brain infused with iECM conjugated with VT750 following TBI (n). o, H&E section of a lung following monocrotaline injury, a model of pulmonary arterial hypertension (PAH), and iECM infusion. p, Fluorescence image for location shown in inset in o of injured lung (1). Lung near-infrared scans of lung infused saline without dye following PAH (q), healthy lung infused with iECM conjugated with VT750 (r), and lung infused with iECM conjugated with VT750 following PAH (s).
Figure 3:
Figure 3:
iECM colocalizes with the microvasculature, and reduces vascular permeability and macrophage density after MI. iECM was pre-labeled and visualized in red in all parts of Fig. 3. a, Staining for arterioles using anti-alpha smooth muscle actin (αSMA) in green. (b-e), Staining for endothelial cells using isolectin in green. Scale bar is 200 μm for a-b. c, iECM does not block the lumen of an arteriole but fills in the gaps in the endothelium. Scale bar is 25 μm. d,e, Representative sequential z-stack images of a capillary showing that iECM binds to the endothelium while not blocking it. Lumen traced with dotted white lines. Scale bar is 5 μm. f, Diagram of longitudinal axis view of iECM fibers binding in a leaky vessel. g, Diagram of short axis view of iECM binding in a capillary. h, Quantified cardiac tissue signal intensity following MI, intracoronary infusion, and IV BSA, suggesting iECM infusions decrease tissue permeability and accelerate vascular healing. BSA signal was measured at 30 min (n=3 saline, n=4 iECM, *p=0.02) and 1 (n=5 saline, n=4 iECM, *p=0.01), 3 (n=5 saline, n=5 iECM, p=0.055), and 7 (n=4 saline, n=3 iECM) days after infusion in the MI model, and in a healthy animals (n=3) 30 min after infusion. i-j, Fluorescent scans of hearts 30 min following MI, intracoronary infusion of saline (i) or iECM (j), and IV infusion of fluorescent bovine serum albumin (IV BSA). (k) Neutrophil (n=6 saline, n=6 iECM) and (l) macrophage density (n=6 saline, n=7 iECM, p=0.05) in the infarct area of rats one and three post-MI and infusion, respectively. Data are mean ± SEM. All data are biological replicates. Data were evaluated with a two tailed unpaired t-test. f,g created with Biorender.com
Figure 4:
Figure 4:
iECM binds to injured endothelial cells and facilitates platelet adhesion in vitro. Representative images of iECM binding to either scalpel score (white arrow region) damaged HUVECs (a) or strongly TNF-α inflamed HUVECs (b) under flow conditions with red blood cells and plasma in an in vitro adhesion flow assay Scale bar is 100 μm. iECM binding to injured (scalpel) and/or inflamed (TNF-α) HUVECs was significantly increased over controls at both low (100s−1) (c) and high (1000s−1) (d) shear rates (n=3 all groups). Low shear (c): scalpel: *p=0.03, low TNF-α + scalpel: p=0.055, high TNF-α: **p=0.004. High shear (d): scalpel: *p=0.01, low TNF-α + scalpel: ***p<0.001, high TNF-α: **p=0.004. Under flow conditions with whole blood, iECM increased platelet adhesion for all 4 blood donors at low shear rates (e). Data are mean ± SEM. All data are biological replicates. Data were evaluated with a two tailed unpaired t-test.
Figure 5:
Figure 5:
Infusible extracellular matrix (iECM) significantly improved cardiac function post-MI. a, Timeline of survival study. b-c, Representative magnetic resonance images at 24 hours and 5 weeks post-injection of iECM (b) or saline (c). Scale bar 10 mm. d-f, iECM infusions preserve left ventricle volumes at 24 hours and 5 weeks post-MI, end diastolic volume (d, EDV, n=11 saline, n=10 at 24 hrs and n=11 at 5 weeks iECM, **p=0.005 at 24 hrs, ***p<0.001 at 5 weeks), end systolic volume (e, ESV, n=11 saline, n=10 at 24 hrs and n=11 at 5 weeks iECM, *p=0.01 at 24 hrs, **p=0.006 at 5 weeks), ejection fraction (f, EF, n=11 saline, n=10 at 24 hrs and n=11 at 5 weeks iECM, #p=0.1 at 24 hrs). g, Infarct arteriole density increased with iECM infusions at 5 weeks post-infusion (n=11 saline, n=10 iECM, **p=0.008), promoting neovascularization. Representative images of iECM (h) and saline (i) infused hearts, alpha smooth muscle actin (αSMA) in red for arterioles and isolectin in green for endothelial cells. Scale bar 250 μm. j, Timeline of acute mechanisms of repair study. Mechanisms of repair were evaluated through histology (k-m) and gene expression (n-q) analyses. k, Number of cardiomyocytes undergoing apoptosis significantly decreased in the border zone of iECM infused hearts at 3 days post-infusion (n=5 saline, n=5 iECM, *p=0.04). Representative images of iECM (l) and saline (m) infused hearts, cleaved caspase 3 (CC3) for apoptosis in red, and alpha actinin (α-ACT) for cardiomyocytes in green. Scale bar 100 μm. Volcano plots showing differential gene expression from NanoString analysis at 1 day (n) and 3 days (o) after iECM infusion. Genes related to chemotaxis/tissue migration, endothelial cells/angiogenesis, and cell junction/focal adhesion proteins are differentially expressed 1 day (p) following iECM infusions and genes related to Interleukin 6 (IL6), vascular development, nitric oxide metabolism, and reactive oxygen species (ROS) metabolism are differentially expressed at 3 days (q) following infusion. Data are mean ± SEM. All data are biological replicates. Data in d-f, g, and k were evaluated with a two tailed unpaired t-test. a,j created with Biorender.com.
Figure 6:
Figure 6:
iECM infusions are amenable to intracoronary infusion with a balloon infusion catheter. a, iECM complex viscosity is lower than its full ECM hydrogel counterpart, suggesting potential for catheter delivery. Note, error bars are too small to be visible for most measurements. N=3 all groups. b, Timeline of catheter feasibility study. c, Macroscopic short-axis view of a pig heart post-MI and iECM infusion. Infarct outlined in blue. d, Fluorescent image of iECM distribution and retention in a histological section from the same heart. Scale bar 200 μm. e,f, Representative confocal images of iECM (red) and endothelial cells (green) from iECM infused pigs. iECM lines the endothelial cells of infarcted myocardium, as similarly observed in the rat MI model. Lumen traced with dotted white lines; Scale bars 5 μm. g, iECM infusions showed a plateau effect with increasing infusion volumes, as suggested by quantified signal density in the infarct (n=2 for 1 and 10 mL, n=3 for 2 to 8 mL). Data are mean ± SEM. All data are biological replicates. b created with Biorender.com.
Figure 7:
Figure 7:
iECM infusions mitigate negative left ventricular remodeling in pig acute MI model. a, Timeline of survival study following induced MI and iECM or saline infusion. End diastolic volume (EDV), end systolic volume (ESV), ejection fraction (EF), left ventricular (LV) wall thickness, infarct angle, global wall motion index (GWMI), and wall motion scores (WMS) were measured before MI (baseline), post-MI, 7 days, and 8 weeks post-MI (n=10 all groups). B-g, Changes in EDV, ESV, and EF over time (b,d,f) and at 8 weeks post post-MI relative to immediately post-MI (c,e,g), suggest iECM infusions mitigate negative left ventricular remodeling (b: #p=0.07, c: *p=0.01, e: #p=0.08 compared to saline). Representative echocardiography images at end diastole show how iECM infusions mitigate negative LV remodeling from post-MI to 8 weeks post-MI (h) and mitigate acute increases in wall thickness post-MI (i). Red arrows indicate wall thickness, yellow arrows are used for LV end diastolic measurement. Changes in MI wall thickness (j, *p=0.04), infarct angle (k, *p=0.01, **p=0.008), GWMI (l-n; m: *p=0.045, n: *p=0.03 ), and WMS segments (o-q) over time, showing how iECM infusions preserve LV wall thickness and motion and mitigate infarct expansion. o, Wall motion score diagram used for scoring wall motion. p, Saline wall motion scores (Segment K: ***p<0.001 post-MI vs. 8 weeks). q, iECM wall motion scores (Segments B and K: ****p<0.0001, Segment C: *p=0.01 post-MI vs. 8 weeks). Data are mean ± SEM. All data are biological replicates. Data in b-n were evaluated with a two tailed unpaired t-test. Data in p and q were evaluated with one way ANOVA with Tukey post-hoc test. a created with Biorender.com.

Comment in

References

    1. Badylak SF The extracellular matrix as a biologic scaffold material. Biomaterials 28, 3587–3593 (2007). - PubMed
    1. Saldin LT, Cramer MC, Velankar SS, White LJ & Badylak SF Extracellular matrix hydrogels from decellularized tissues: Structure and function. Acta Biomaterialia 49, 1–15 (2017). - PMC - PubMed
    1. Spang MT & Christman KL Extracellular matrix hydrogel therapies: In vivo applications and development. Acta Biomaterialia 68, 1–14 (2018). - PMC - PubMed
    1. Badylak SF, Freytes DO & Gilbert TW Extracellular matrix as a biological scaffold material: Structure and function. Vol. 5 1–13 (2009). - PubMed
    1. Christman KL Biomaterials for tissue repair. Science 363, 340–341 (2019). - PMC - PubMed

Publication types