. 2023 Jan;24(1):55-68.
doi: 10.1038/s41590-022-01385-x. Epub 2022 Dec 29.

SHP-2 and PD-1-SHP-2 signaling regulate myeloid cell differentiation and antitumor responses

Affiliations

SHP-2 and PD-1-SHP-2 signaling regulate myeloid cell differentiation and antitumor responses

Anthos Christofides et al. Nat Immunol. 2023 Jan.

Abstract

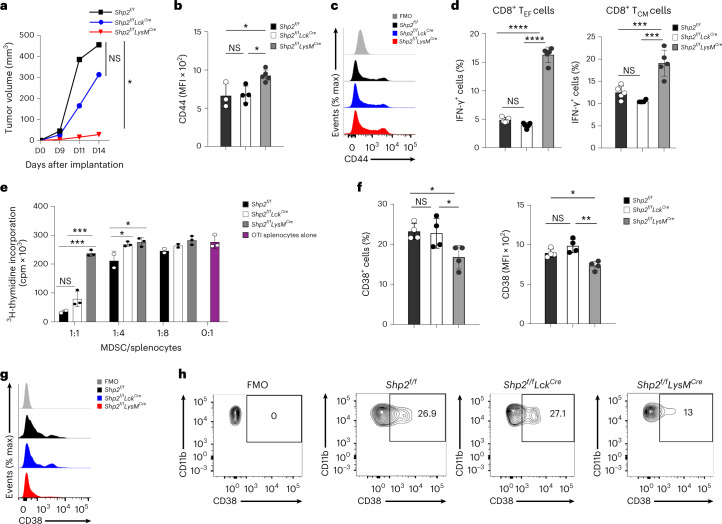
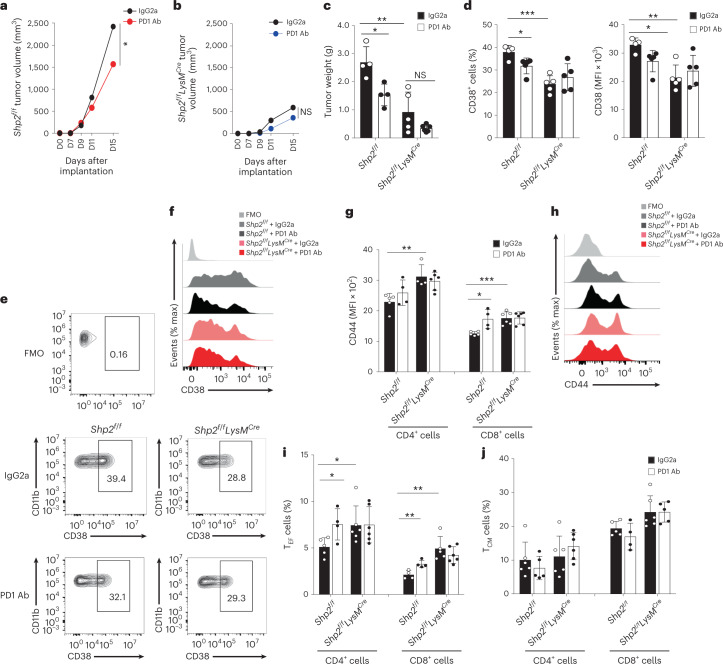
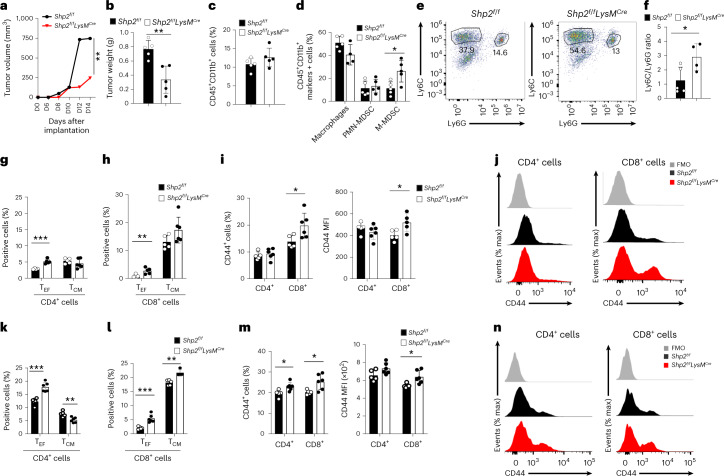
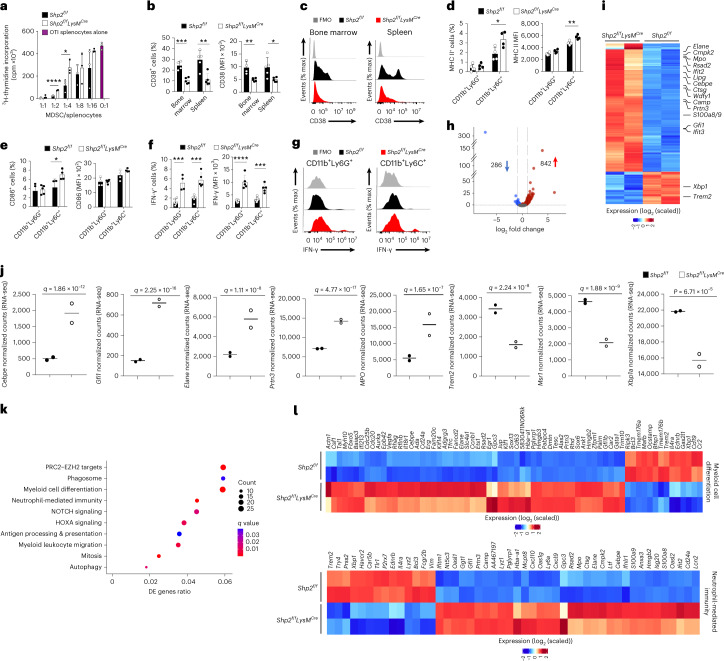
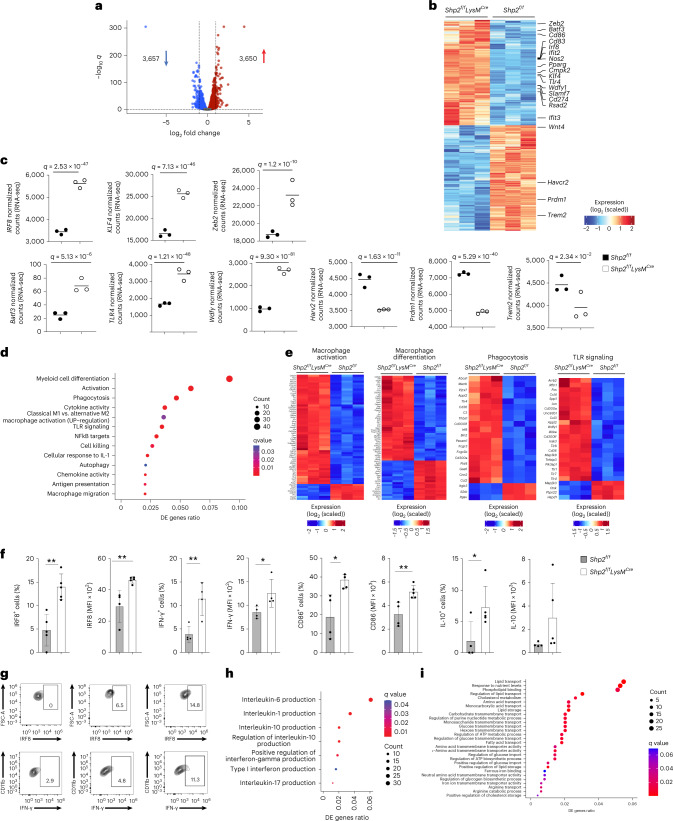
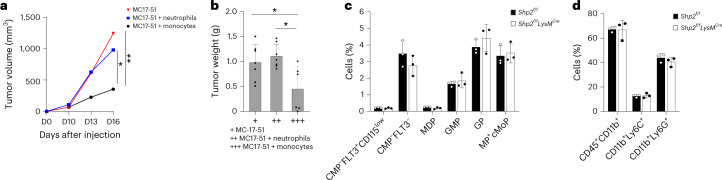
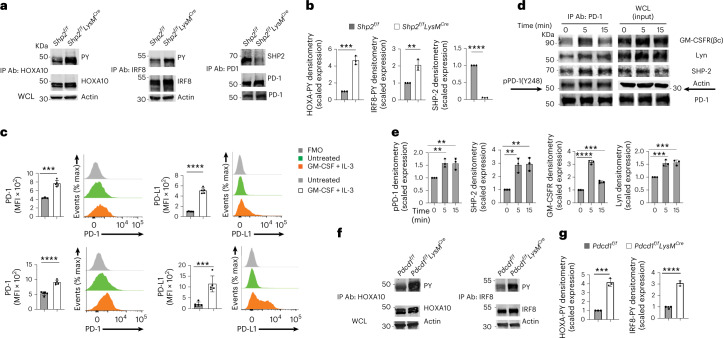
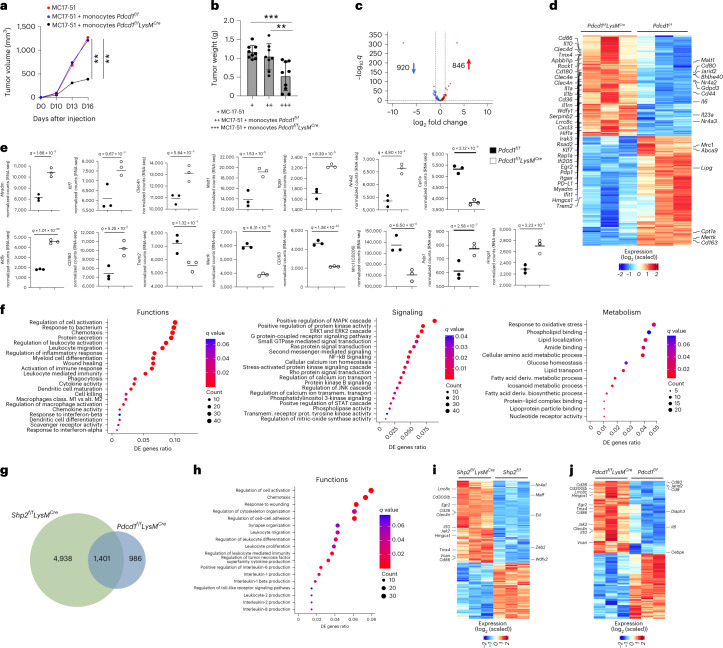
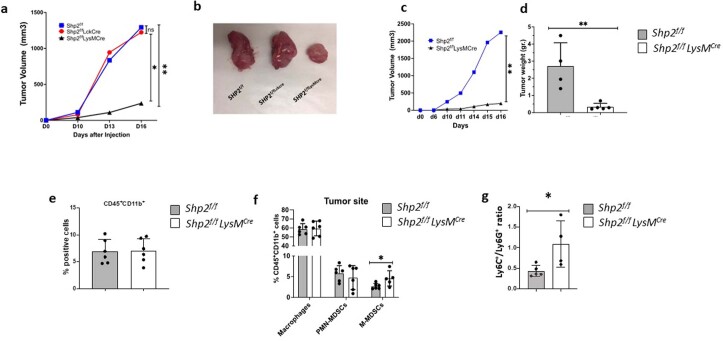
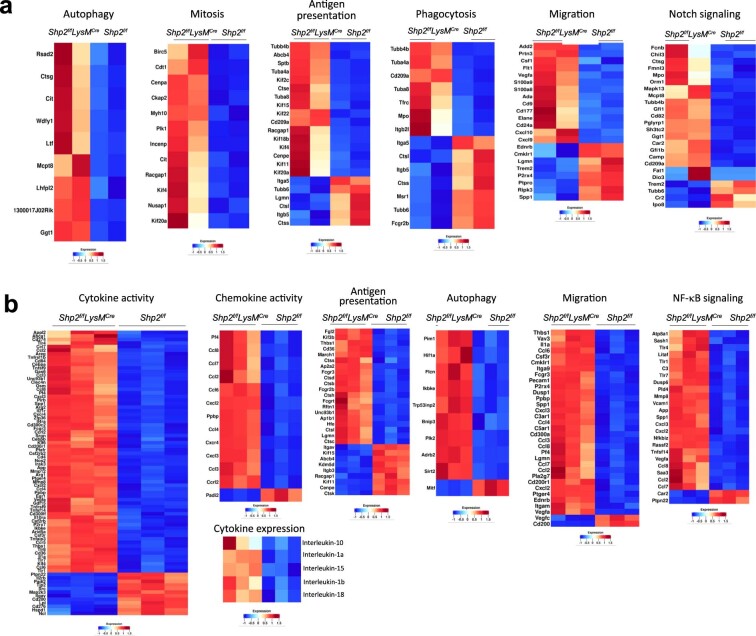
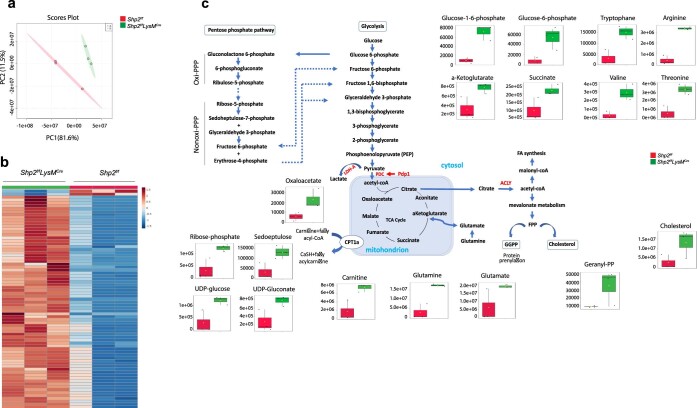
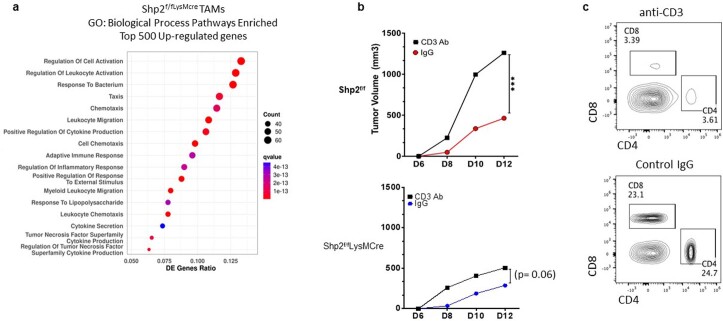
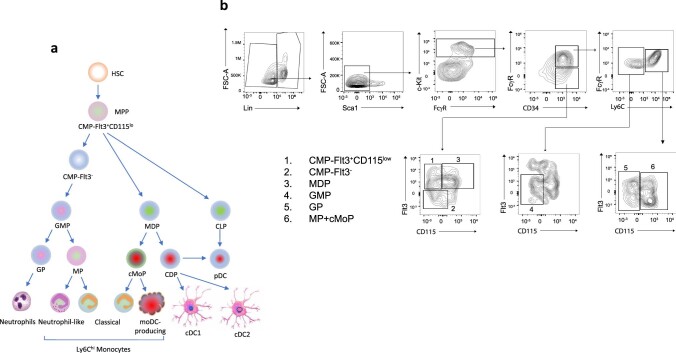
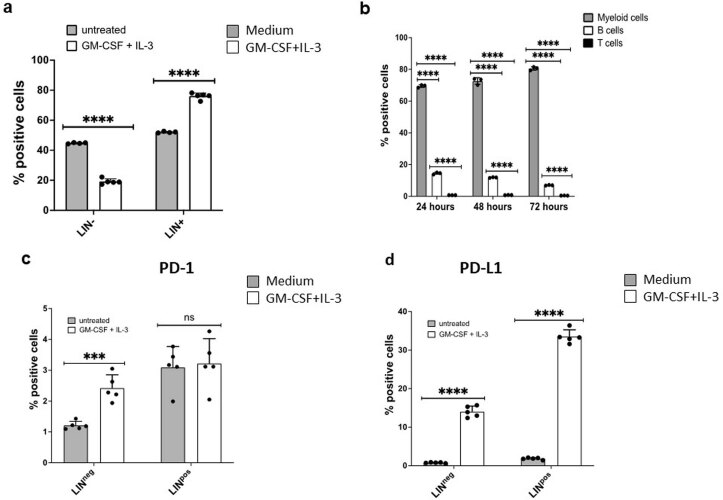
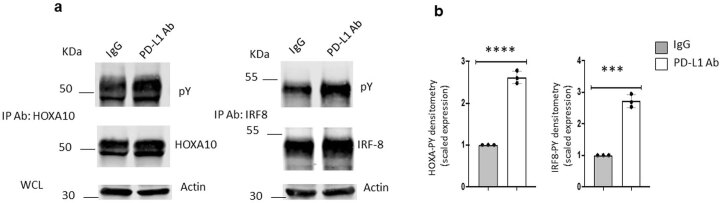
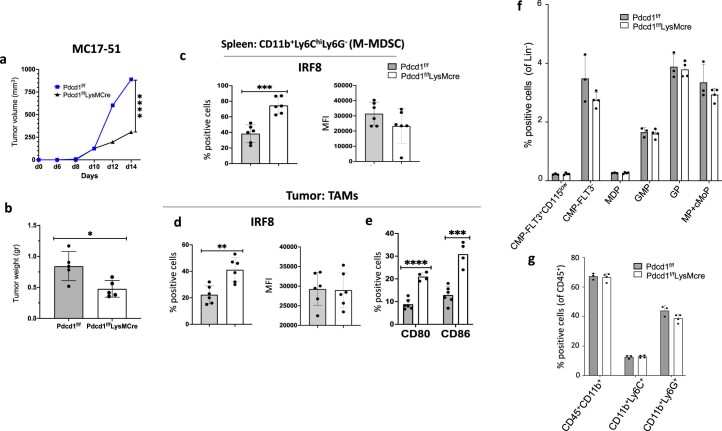
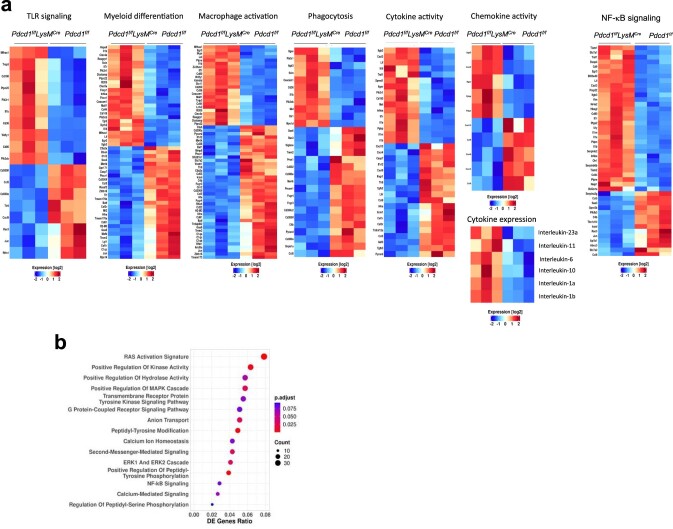
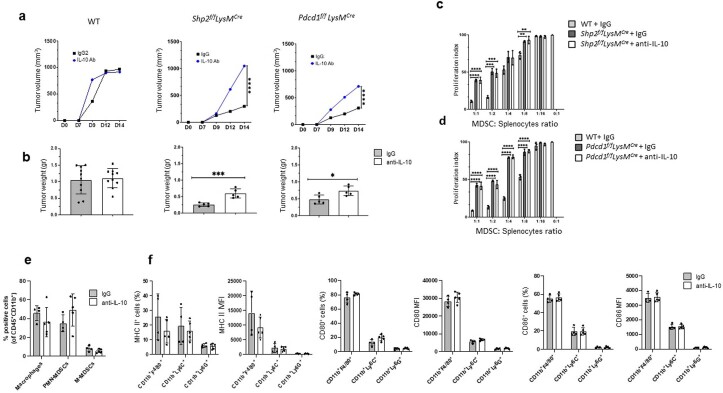
The inhibitory receptor PD-1 suppresses T cell activation by recruiting the phosphatase SHP-2. However, mice with a T-cell-specific deletion of SHP-2 do not have improved antitumor immunity. Here we showed that mice with conditional targeting of SHP-2 in myeloid cells, but not in T cells, had diminished tumor growth. RNA sequencing (RNA-seq) followed by gene set enrichment analysis indicated the presence of polymorphonuclear myeloid-derived suppressor cells and tumor-associated macrophages (TAMs) with enriched gene expression profiles of enhanced differentiation, activation and expression of immunostimulatory molecules. In mice with conditional targeting of PD-1 in myeloid cells, which also displayed diminished tumor growth, TAMs had gene expression profiles enriched for myeloid differentiation, activation and leukocyte-mediated immunity displaying >50% overlap with enriched profiles of SHP-2-deficient TAMs. In bone marrow, GM-CSF induced the phosphorylation of PD-1 and recruitment of PD-1-SHP-2 to the GM-CSF receptor. Deletion of SHP-2 or PD-1 enhanced GM-CSF-mediated phosphorylation of the transcription factors HOXA10 and IRF8, which regulate myeloid differentiation and monocytic-moDC lineage commitment, respectively. Thus, SHP-2 and PD-1-SHP-2 signaling restrained myelocyte differentiation resulting in a myeloid landscape that suppressed antitumor immunity.


Conflict of interest statement

V.A.B. has patents on the PD-1 pathway licensed by Bristol-Myers Squibb, Roche, Merck, EMD-Serono, Boehringer Ingelheim, AstraZeneca, Novartis and Dako. All the other authors declare no competing interests.

Figures

Fig. 1
Fig. 1. Myeloid-specific SHP-2 deletion diminished tumor progression and suppressive function of MDSC.
a, Tumor volume in Shp2f/f, Shp2f/fLckCre and Shp2f/fLysMCre mice inoculated with B16-F10 melanoma cells (1 × 105 cells per mouse) and monitored longitudinally on each day of assessment. Data shown are means of n = 6 mice per group and are from one of three independent experiments with reproducible results. bc, Quantification (b) and representative flow cytometry (c) of expression of CD44 in CD8+ T cells isolated from dLNs of mice as in a. d, Expression of IFN-γ assessed in CD8+ TEM and TCM cells from dLN in mice as in a. Mean fluorescence intensity (MFI) ± s.d. results are shown. Results are representative of four independent experiments with n = 8 mice per group. e, Thymidine incorporation in OTI splenocytes (2 × 105 cells per well) stimulated with OVA257–264 after the addition of graded numbers of GR1+ MDSCs cells isolated from the spleens of tumor-bearing Shp2f/f, Shp2f/fLckCre and Shp2f/fLysMCre mice. Mean ± s.d. of cpm values are shown. Results are representative of three separate experiments using n = 9 mice per group and four technical replicates per condition. f,g, Representative flow cytometry histograms (g) and contour plots (h) of CD38 expression on splenic MDSC from Shp2f/f, Shp2f/fLckCre and Shp2f/fLysMCre tumor-bearing mice. Mean percentage ± s.d., MFI ± s.d.% positive cells results are representative of two independent experiments with n = 4 and n = 6 mice per group and reproducible results. *P = 0.0023–0.0465, ***P = 0.0001–0.0007, ****P < 0.0001, ANOVA. Source data
Fig. 2
Fig. 2. PD-1 blockade induced antitumor responses in Shp2f/f mice but not in Shp2f/fLysMCre mice.
ac, Tumor size in Shp2f/f (a) and Shp2f/fLysMCre mice (b) inoculated with B16-F10 melanoma (3 × 105 cells per mouse) and treated with PD-1 blocking antibody or IgG2a control on days 9, 11 and 13 after tumor inoculation and measured starting on day 7 (a, b) or day 15 (c). Results show means + s.d. are representative of three experiments n = 4 mice per group and two experiments with n = 5 mice per group. df, Quantification (d) and representative flow cytometry (e, f) of CD38 expression in spleen PMN-MDSC isolated from mice as in a. g,h, Quantification (g) and representative histograms (h) of CD44 expression in CD4+ and CD8+ T cells of dLN. i,j, Frequency of CD4+ and CD8+ TEF cells (i) and CD4+ and CD8+ TCM-like cells (j) in dLN on Shp2f/f versus Shp2f/fLysMCre mice treated with IgG2a or PD-1 Ab mean percentage ± s.d. are shown. Results are from one of three separate experiments with five mice per group. *P = 0.017–0.028, **P = 0.0047–0.0075, ***P = 0.0006, unpaired two-sided t test.
Fig. 3
Fig. 3. Myeloid-specific SHP-2 deletion alters the MDSC.
a,b, In Shp2f/f and Shp2f/fLysMCre mice, tumor volume was monitored for 14 days (a) and tumor weight was assessed or on day 14 (b) post inoculation with MC17-51 cells. ce, Percentage of CD45+CD11b+ cells (c), macrophages, CD11b+Ly6ChiLy6G monocytic MDSCs (M-MDSCs) and CD11b+Ly6CloLy6G+ PMN-MDSCs (d), and representative pseudocolor plots (e) in tumors from mice as in a. f, The ratio of M-MDSC/PMN-MDSC in the tumors of Shp2f/f and Shp2f/fLysMCre tumor-bearing mice as in a. gn, Frequency of CD4+ TEF cells (g, k) and CD8+ TEF cells (h, l) and representative flow cytometry (j, n) and quantification (i, m) of CD44 expression in CD4+ and CD8+ TEF cells in dLN (gj), and the spleen (kn) of tumor-bearing mice as in a. Mean percentage ± s.d. are shown. Results are representative of three separate experiments with four mice per group and two experiments with seven mice per group. *P = 0.0166–0.0293, **P = 0.0019-0.0085, ***P = 0.0003-0.00085, unpaired two-sided t test.
Fig. 4
Fig. 4. SHP-2 deletion promotes myeloid cell differentiation to mature leukocytes with enhanced neutrophil-mediated immunity.
a, 3H-thymidine incorporation (cpm) in OTI splenocytes stimulated with OVA257–264 cocultured with PMN-MDSC isolated from Shp2f/f and Shp2f/fLysMCre mice at day 15 post inoculation of MC17-51 tumor cells. Mean ± s.d. of cpm values is shown. ****P < 0.0001 cpm counts obtained by addition of Shp2f/f versus Shp2f/fLysMCre PMN-MDSC, unpaired t test. Results are representative of three separate experiments using 8–10 mice per group, and three technical replicates per condition. b,c, Quantification (b) and representative histograms (c) of CD38 expression in PMN-MDSC from spleen and BM in mice as in a. Mean percentage ± s.d. dg, Quantification of MHC II (d) and CD86 (e) expression in tumor-infiltrating CD11b+Ly6CloLy6G+ and CD11b+Ly6ChiLy6G cells and quantification (f) and representative histograms (g) of IFN-γ expression in tumor-infiltrating CD11b+Ly6CloLy6G+ and CD11b+Ly6ChiLy6G cells in mice as in a. Results are from one of three independent experiments with n = 5 mice per group. h,i, Volcano plot of differentially expressed (DE) genes (h) and heat map (i) of top 600 DE genes in PMN-MDSC cells isolated from spleens of Shp2f/f and Shp2f/fLysMCre tumor-bearing mice and analyzed by bulk RNA-seq (q < 0.05 for all DEGs, log2(FC) > 0 and log2(FC) < 0 for upregulated and downregulated genes, respectively). j, Expression of the indicated genes in PMN-MDSC from Shp2f/f and Shp2fl/flLysMCre tumor-bearing mice (data from RNA-seq dataset). k, Bubble plot of substantially enriched pathways (q < 0.1) in cells from Shp2fl/flLysMCre mice sorted by GeneRatio. l, Heat maps of differentially expressed genes involved in myeloid cell differentiation and neutrophil-mediated immunity (q < 0.05). *P = 0.026, ***P = 0.0034–0.004, ****P < 0.0001, unpaired t test.
Fig. 5
Fig. 5. SHP-2 deletion increases monocyte and DC specification gene transcripts and imprints an effector differentiation program in TAMs.
a,b, Volcano plot of DE genes (a) and heat map (b) of the top 6,500 DE genes in TAMs isolated from MC17-51 tumor-bearing Shp2f/f and Shp2f/fLysMCre mice and analyzed by RNA-seq. log2(FC) > 0 and log2(FC) < 0 for upregulated and downregulated genes, q < 0.05 for all DEGs, respectively). c, Expression of the indicated genes by TAMs from Shp2f/f and Shp2f/fLysMCre tumor-bearing mice (data from RNA-seq dataset). d, Bubble plot of substantially enriched pathways (q < 0.1) in TAMs of Shp2f/fLysMCre mice sorted by GeneRatio. e, Heat maps of differentially expressed genes related to macrophage differentiation, macrophage activation, phagocytosis and TLR signaling in TAMs from Shp2f/f and Shp2f/fLysMCre tumor-bearing mice (q < 0.05). f,g, Quantification of IRF8, IFN-γ, CD86 and IL-10 expression (f) and representative flow cytometry of IRF8 and IFN-γ expression (g) in TAMs of tumor-bearing Shp2f/f and Shp2f/fLysMCre mice. Results are representative of four independent experiments with four to six mice per group. h,i, Bubble plot of cytokine pathways (h) and metabolism pathways (i) substantially enriched in TAMs (q < 0.1) from Shp2f/fLysMCre mice sorted by GeneRatio.
Fig. 6
Fig. 6. SHP-2 ablation induces lasting antitumor properties in monocytes.
a, Tumor size in naïve WT mice subcutaneously injected with MC17-51 tumor cells with or without injection with CD45+CD11b+Ly6ChiLy6G monocytes or CD45+CD11b+Ly6CLy6G+ neutrophils isolated from the bone marrow of Shp2f/fLysMCre mice on day 9 post inoculation of MC17-51 tumors. b, Tumor weight on day 15 in mice as in a. Results show mean + s.d. Results are from one of two experiments with n = 10 mice per group. *P = 0.0104–0.0387, **P = 0.0033, ANOVA. c,d, The indicated subsets of Lin- myeloid progenitors (c) and mature CD45+CD11b+ myeloid cells and the subsets of CD45+CD11b+Ly6ChiLy6G monocytes (CD11b+Ly6C+) and CD45+CD11b+Ly6CLy6G+ neutrophils (CD11b+Ly6C+) were assessed in the bone marrow of Shp2f/f and Shp2f/fLysMCre tumor-bearing mice on day 9 before collection of monocytes or neutrophils from Shp2f/fLysMCre tumor-bearing mice for transfer into the new hosts. Results are from one of three separate experiments with n = 5 mice per group.
Fig. 7
Fig. 7. Ablation of SHP-2 or PD-1 enhances GMC-SF-mediated phosphorylation of HOXA1- and IRF8.
a, Immunoprecipitation with agarose-conjugated antibodies specific for HOXA10, IRF8 or PD-1 followed by SDS-PAGE and immunoblot with antibodies specific for pY or HOXA10, IRF8 or PD-1, respectively, in cell lysates from Shp2f/f and Shp2f/fLysMCre bone marrow cells cultured for 48 h with GM-CSF (10 ng ml−1) and IL-3 (5 ng ml−1). Expression of actin in whole-cell lysates was examined as input. b, Abundance of phosphorylated HOXA10, IRF8 or PD-1 normalized to immunoprecipitated HOXA10, IRF8 or PD-1 and expressed as fold change over the value obtained in Shp2f/f cells, defined as one. Results are representative of three experiments. c, Expression of PD-1 and PD-L1 in Lin (top) and Lin+ (bottom) cells following 48 h of the bone marrow from C57BL/6 WT mice as in a. MFI ± s.d. and representative histograms are shown. Results are from one of five experiments with four to six mice per group. d, Immunoprecipitation with agarose-conjugated PD-1 antibody followed by SDS-PAGE and immunoblot with the indicated antibodies in cell lysates from C57BL/6 WT bone marrow cells cultured as in a, rested for 3 h and then either left untreated or stimulated with GM-CSF (40 ng ml−1) for the indicated time points. e, The abundance of PD-1 phosphorylated at Y248 (pPD-1), SHP-2, GM-CSFR(βc) and Lyn coprecipitated with PD-1 from the cell lysates was normalized to immunoprecipitated PD-1 and was expressed as fold change over the value obtained in nonstimulated cells at the zero timepoint (defined as one). Expression of indicated proteins in whole-cell lysates was also examined. Results from one of two experiments are shown. f, Immunoprecipitation with agarose-conjugated HOXA10-specific antibody or agarose-conjugated IRF8-specific antibodies followed by SDS-PAGE and immunoblot with antibodies specific for pY followed by immunoblot with HOXA10 or Irf8 in bone marrow cells from Pdcd1f/f and Pdcd1f/fLysMCre mice cultured as in a. Expression of actin in whole-cell lysates was examined as input. g, Quantification of phosphorylated HOXA10 and IRF8 was assessed as in b. Results from one of two experiments are shown (f,g). **P = 0.0025–0.0084, ***P = 0.0004–0.0084, ****P < 0.0001, t-test. Source data
Fig. 8
Fig. 8. PD-1 deletion altered signaling and metabolism, and imprinted an effector function program in TAMs.
a,b, Tumor size in naïve WT mice subcutaneously injected with MC17-51 tumor cells with or without CD45+CD11b+Ly6ChiLy6G monocytes isolated from the bone marrow of Pdcd1f/fLysMCre and Pdcd1f/f mice on day 9 post inoculation of MC17-51 tumors. b, Tumor weight on day 15 in mice as in a. Results show mean + s.d. Results are from one of two experiments with n = 10 mice per group. **P = 0.0055–0.0079, ***P = 0.0006, ANOVA. c,d, Volcano plot of DE genes (c) and heat map (d) of 1,766 genes differentially expressed in TAMs isolated from MC17-51 tumor-bearing Pdcd1f/f and Pdcd1f/fLysMCre mice and analyzed by RNA-seq. log2(FC) > 0 and log2(FC) < 0 for upregulated and downregulated genes, q < 0.05 for all DEGs, respectively). e, Expression of the indicated genes in TAMs from Pdcd1f/f and Pdcd1f/fLysMCre tumor-bearing mice (data from RNA-seq dataset). f. Bubble plot of substantially enriched functional, signaling and metabolic pathways (q < 0.1) among the top 500 DE genes in TAMs of Pdcd1f/fLysMCre mice compared to Pdcd1f/f mice sorted by GeneRatio. g, Venn Diagrams depicting the overlap of substantially enriched pathways between upregulated DE genes in Shp2f/fLysMCre and Pdcd1f/fLysMCre TAMs. h, Bubble plot of common pathways enriched in among the top 500 DE genes in Shp2f/fLysMCre and Pdcd1f/fLysMCre TAMs. i,j, Heat maps of the top 6,500 DE genes in TAMs of tumor-bearing Shp2f/fLysMCre mice (i) and heat maps of the top 1,766 DE genes in TAMs of Pdcd1f/fLysMCre mice (j). Representative common (left) and distinct (right) IRF8-upregulated genes are annotated.
Extended Data Fig. 1
Extended Data Fig. 1. Myeloid-specific SHP-2 depletion diminishes tumor growth.
a, Shp2f/f, Shp2f/fLckCre, and Shp2f/fLysMCre mice were inoculated with MC17-51 fibrosarcoma cells, tumor volume was monitored longitudinally, and comparisons were made on each day of assessment. Data shown are means of n = 6 mice per group and are representative of three independent experiments. (*p < 0.05, **p < 0.01), ANOVA. b, Representative images of tumors isolated at day 15 from each of the three experimental group are shown. c, d, Shp2f/f and Shp2f/fLysMCre mice were inoculated with B16-F10 melanoma cells, tumor volume was monitored longitudinally (c) and tumor weight was measured at termination on day 16 (d). Data are means of n = 5 mice per group and are representative from one of four independent experiments. (*p < 0.05, **p < 0.01), unpaired t-test two tailed. e-g, The frequencies of CD45+CD11b+ myeloid cells (e), the fractions of macrophages, PMN-MDSC and M-MDSC (f) and the ratio of M-MDSC/PMN-MDSC (g) in tumors were assessed. Data are representative of means ± SD are shown. Results from one representative of 4 independent experiments with n = 4 mice per group are shown (*p < 0.05, **p < 0.01), unpaired t-test two tailed.
Extended Data Fig. 2
Extended Data Fig. 2. Distinct transcription signatures in PMN-MDSC and TAMs of Shp2f/fLysMCre tumor-bearing mice compared to Shp2f/f tumor-bearing mice.
a, b, Shp2f/fLysMCre and Shp2f/f mice were injected with MC17-51 cancer cells and 15 days later, PMN-MDSC (a) were isolated from the spleens, TAMs (b) were isolated from tumors, and RNA-seq was performed followed by pathway enrichment analysis of DEG. Heat maps of DEG for enriched pathways are shown. Differential gene expression analysis was performed using DESeq2.
Extended Data Fig. 3
Extended Data Fig. 3. Phagocytes from Shp2f/fLysMCre and Shp2f/f mice have distinct metabolic activities.
a, Phagocytes were generated from primary bone marrow cells of Shp2f/fLysMCre and Shp2f/f mice using GM-CSF and metabolite analysis was performed after 48 hours of culture. Principal component analysis (PCA). b, Unsupervised hierarchical clustering of top 75 metabolites (log2FC ≥ 1). c, Individual graphs of relative peak intensity of representative intermediate metabolites of glycolysis, PPP and TCA cycle. Results from one representative of two independent experiments are shown. The amounts of the indicated metabolites were plotted in whisker boxes. The lower and upper sides of the box indicate the first and third quartile, respectively. The horizontal line inside the box indicates the median value, whereas the lower and upper bars indicate the minimum and maximum of distribution, respectively.
Extended Data Fig. 4
Extended Data Fig. 4. Myeloid cells of Shp2f/fLysMCre mice have distinct molecular and functional properties.
a, GO Biological Processes Pathways enriched among top 500 upregulated genes in TAMs from Shp2f/fLysMCre MC17-51 tumor-bearing mice compared to Shp2f/f MC17-51 tumor-bearing mice, collected at day 15 after tumor implantation. Differential gene expression analysis was performed using DESeq2 and ClusterProfiler (v3.12.0) was utilized for downstream functional investigations. b, c, Shp2f/f and Shp2f/fLysMCre mice injected with MC17-51 fibrosarcoma were treated with either anti-CD3 antibody or control IgG at day -1 relative to tumor injection and subsequently every third day, and tumor growth was monitored for 12 days (b). Results show means of tumor volume and are representative of one from two independent experiments with n = 10 mice per group, (***p < 0.001) unpaired t-test two tailed. c, At termination, expression of lymph node CD4+ and CD8+ T cells was assessed by flow cytometry. One representative histoplot of each treatment condition generated from Shp2f/fLysMCre mice is shown. (In this experiment, the number of injected MC17-51 cells was reduced by 50% because, after T cell depletion, tumors in Shp2f/f mice rapidly exceeded the permitted size).
Extended Data Fig. 5
Extended Data Fig. 5. Differentiation and identification of myeloid progenitors.
a, b, Model for myeloid cell differentiation (a) and gating strategy (b) for characterization of bone marrow Linmyeloid progenitors. Identification of the progenitor subsets numbered in the histograms is shown.
Extended Data Fig. 6
Extended Data Fig. 6. Culture of bone marrow cells with GM-CSF + IL-3 induces PD-1 and PD-L1 expression in Lin and Lin+ myelocytes.
a b, Bone marrow cells from WT C57BL/6 mice were cultured with GM-CSF (10 ng/ml) and IL-3 (5 ng/ml) for 24, 48 and 72 hours. Changes in the Lin and Lin+ populations were examined at 48 hours of culture (a). The frequency of the differentiated myeloid cells (CD45+CD11b+), B cells (B220+) and T cells (CD3+) was assessed by flow cytometry at the indicated time points (b). c, d, Expression of PD-1 (c) and PD-L1 (d) in Lin and Lin+ subsets examined by flow cytometry at 72 hours of culture. Results are from one of five independent experiments with n = 5 biological replicates per group (**p < 0.01, ***p < 0.005, ****p < 0.001) unpaired t-test two tailed.
Extended Data Fig. 7
Extended Data Fig. 7. Enhanced HOXA10 and IRF8 phosphorylation in myeloid cells during culture with GM-CSF and IL-3 in the presence of anti-PD-L1 blocking antibody.
a, b, Bone marrow cells from C57BL/6 wild-type mice were cultured for 48 hr in the presence of GM-CSF (10 ng/ml) and IL-3 (5 ng/ml), with either IgG control of anti-PD-L1 blocking antibody (MIH5) (10 µg/ml). Cell lysates were prepared and immunoprecipitation was done with agarose-conjugated HOXA10-specific antibody or agarose-conjugated IRF8-specific antibody followed by SDS-PAGE and immunoblot with anti-PY and HOXA10 antibodies or anti-PY and and IRF8 antibodies (a). The abundance of phosphorylated HOXA10 was normalized to immunoprecipitated HOXA10 and the abundance of phosphorylated IRF8 was normalized to immunoprecipitated IRF8 and were expressed as fold change over the relevant values obtained in cells cultured without PD-L1 blocking antibody (defined as 1) (b). Expression of actin in whole cell lysates was also examined as input. Images were visualized, acquired and quantified with Li-COR Odyssey CLx imaging system. Results are from one of three independent experiments. Values of three separate quantifications per condition are shown. Source data
Extended Data Fig. 8
Extended Data Fig. 8. Myeloid-specific deletion of PD-1 induces antitumor immunity, and increased numbers of IRF8+ M-MDSC and TAMs, and CD80+ and CD86+ TAMs.
a, b, Pdcd12f/f and Pdcd1f/fLysMCre mice were inoculated with MC17-51 cells. Tumor volume was monitored longitudinally (a) and tumor weight (b) was measured at termination on day 15 after injection. Results show means of tumor volume (a) and means ± SD of tumor weight (b) and are representative of four independent experiments with n = 6 mice per group, (**p < 0.01, ****p < 0.0001), unpaired t-test two tailed. c-e, M-MDSC (c), and TAMs (d, e) were examined for the expression of IRF8, CD80 and CD86 by flow cytometry. Means ± SD of % positive cells and MFI are shown. Results are from one representative of four independent experiments with n = 6 mice per group (**p < 0.01, ****p < 0.0001) unpaired t-test two tailed. f, g, At day 9 after tumor implantation, bone marrow was collected and flow cytometry was used to identify the subsets of Lin myeloid progenitors (f) using the gating strategy shown in Extended Data Fig. 5, the mature CD45+CD11b+ myeloid cells, and the subsets of Ly6ChiLy6G and Ly6CloLy6G+ cells (g).
Extended Data Fig. 9
Extended Data Fig. 9. Distinct transcription signatures in TAMs of Pdcd1f/fLysMCre tumor-bearing mice compared to Pdcd1f/f tumor-bearing mice TAMs.
a, Pdcd1f/fLysMCre and Pdcd1f/f mice were injected with MC17-15 cancer cells and 15 days later, TAMs were isolated from tumors and RNA-seq was performed followed by pathway enrichment analysis of DEG. Heat maps of DEG for enriched pathways are shown. b, Shp2f/fLysMCre and Pdcd1f/fLysMCre mice were injected with MC17-51 fibrosarcoma and at day 15 after injection, TAMs were collected from tumors and RNA-seq was performed followed by GO analysis of DEG. GO Biological Processes of common signaling pathways enriched among top 500 DEG in TAMs from Shp2f/fLysMCre and Pdcd1f/fLysMCre tumor-bearing mice are shown. Differential gene expression analysis was performed using DESeq2 and ClusterProfiler (v3.12.0) was utilized for downstream functional investigations.
Extended Data Fig. 10
Extended Data Fig. 10. IL-10 neutralization compromises the enhanced anti-tumor responses of Shp2f/fLysMCre and Pdcd1f/fLysMCre mice.
a-f, Wild type, Shp2f/fLysMCre and Pdcd1f/fLysMCre mice were injected with MC17-51 cancer cells and were subsequently treated with anti-IL-10 Ab or control IgG1 on days 9, 11, and 13 after tumor inoculation. Tumor volume (a) was monitored longitudinally and tumor weight (b) was measured at termination on day 15 after injection. Results are representative of two separate experiments with n = 10 mice per group. At day 15 after tumor injection, GR1+MDSC were isolated from the spleens of wild-type mice treated with IgG, and from Shp2f/fLysMCre (c) and Pdcd1f/fLysMCre (d) tumor-bearing mice treated with anti-IL-10 Ab or IgG and were cultured at various ratios with splenocytes from OTI transgenic mice (2×10⁵cells/well) stimulated with OVA257-264. Results show Means ± SEM of cpm values of 3H-thymidine incorporation and are representative of two separate experiments with n = 4 mice per group. At day 15 after tumor injection, the fractions of the indicated cell populations (e), and the expression of MHC II, CD80 and CD86 (f) at the tumor site, were examined by flow cytometry. Data show Means ± SD and are representative from one of two independent experiments with n = 5 Shp2f/fLysMCre mice per group (*p < 0.05, **p < 0.01, ***p < 0.001, ****p < 0.0001) unpaired t-test two tailed.

References

    1. Baumeister SH, Freeman GJ, Dranoff G, Sharpe AH. Coinhibitory pathways in immunotherapy for cancer. Annu. Rev. Immunol. 2016;34:539–573. doi: 10.1146/annurev-immunol-032414-112049. - DOI - PubMed
    1. Cassetta L, Pollard JW. Tumor-associated macrophages. Curr. Biol. 2020;30:R246–R248. doi: 10.1016/j.cub.2020.01.031. - DOI - PubMed
    1. Veglia F, Sanseviero E, Gabrilovich DI. Myeloid-derived suppressor cells in the era of increasing myeloid cell diversity. Nat. Rev. 2021;21:485–498. - PMC - PubMed
    1. Yokosuka T, et al. Programmed cell death 1 forms negative costimulatory microclusters that directly inhibit T cell receptor signaling by recruiting phosphatase SHP2. J. Exp. Med. 2012;209:1201–1217. doi: 10.1084/jem.20112741. - DOI - PMC - PubMed
    1. Rota G, et al. Shp-2 is dispensable for establishing T cell exhaustion and for PD-1 signaling in vivo. Cell Rep. 2018;23:39–49. doi: 10.1016/j.celrep.2018.03.026. - DOI - PubMed

Publication types

Substances