Randomized Controlled Trial
. 2023 Jan;4(1):96-107.
doi: 10.1038/s43018-022-00503-w. Epub 2022 Dec 29.

Anti-SARS-CoV-2 antibody-containing plasma improves outcome in patients with hematologic or solid cancer and severe COVID-19: a randomized clinical trial

Affiliations
Randomized Controlled Trial

Anti-SARS-CoV-2 antibody-containing plasma improves outcome in patients with hematologic or solid cancer and severe COVID-19: a randomized clinical trial

Claudia M Denkinger et al. Nat Cancer. 2023 Jan.

Abstract

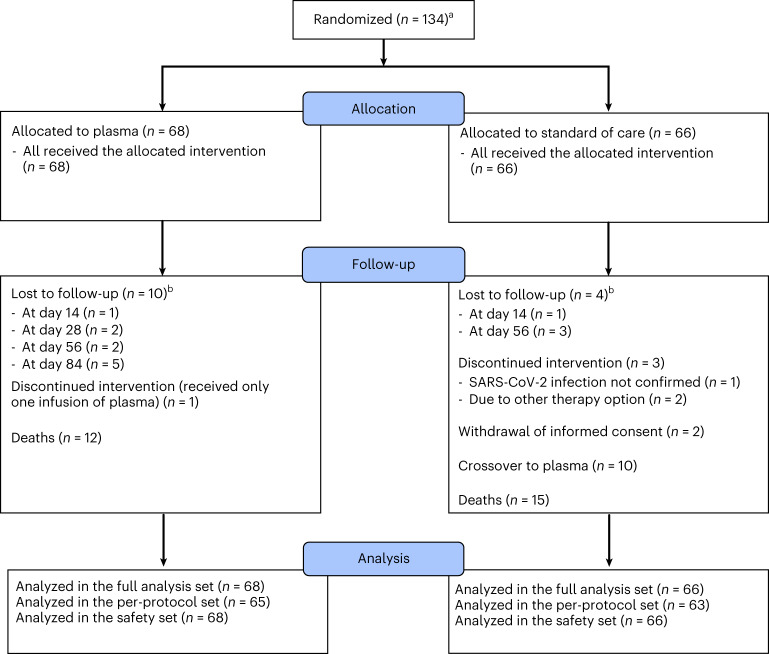
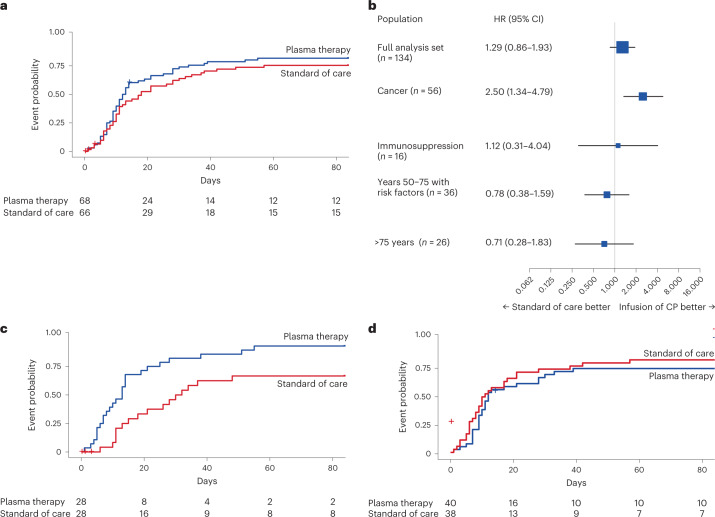
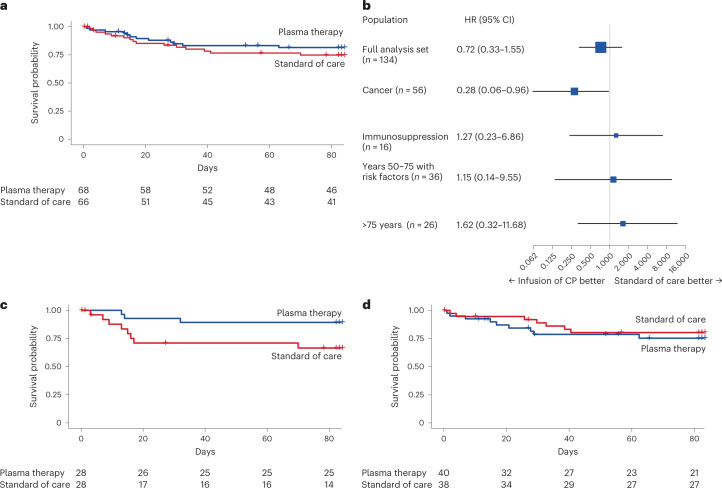
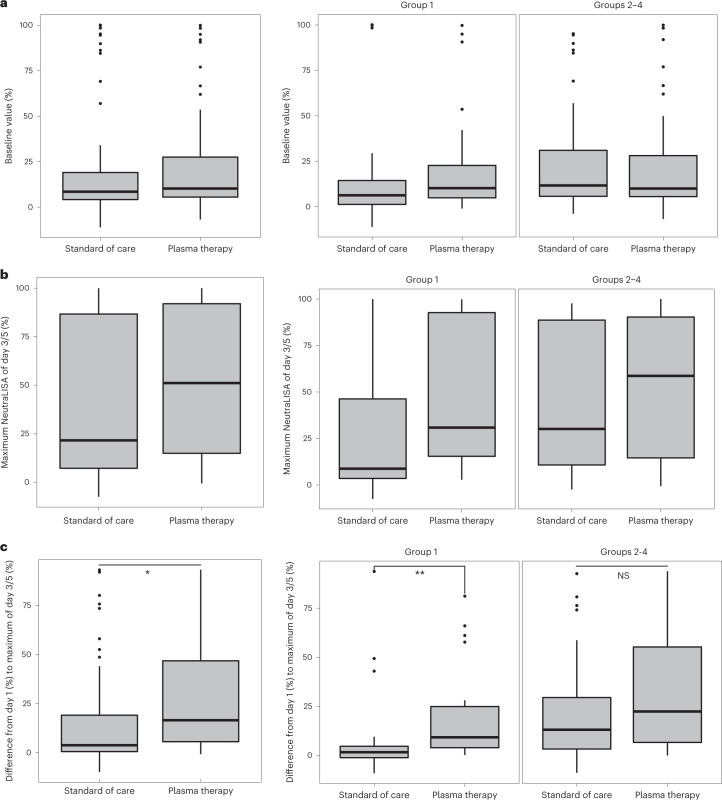
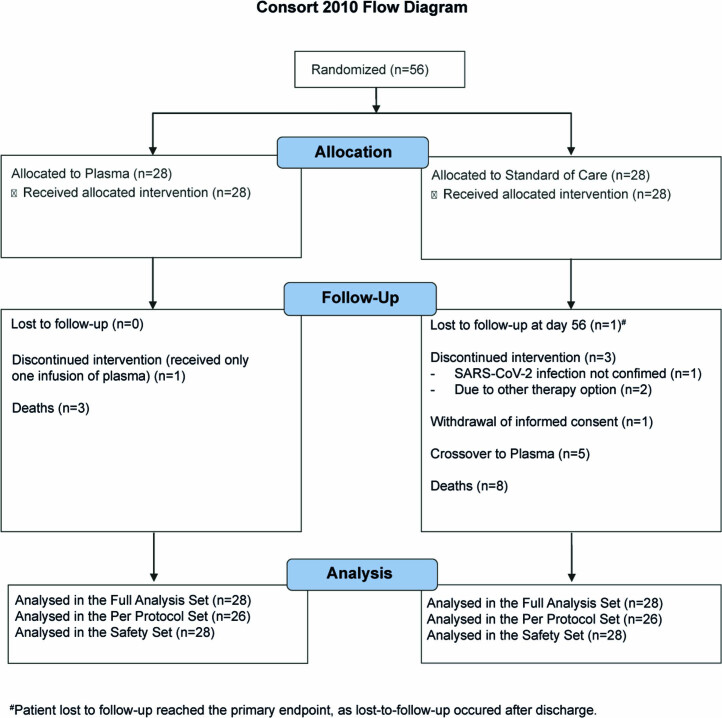
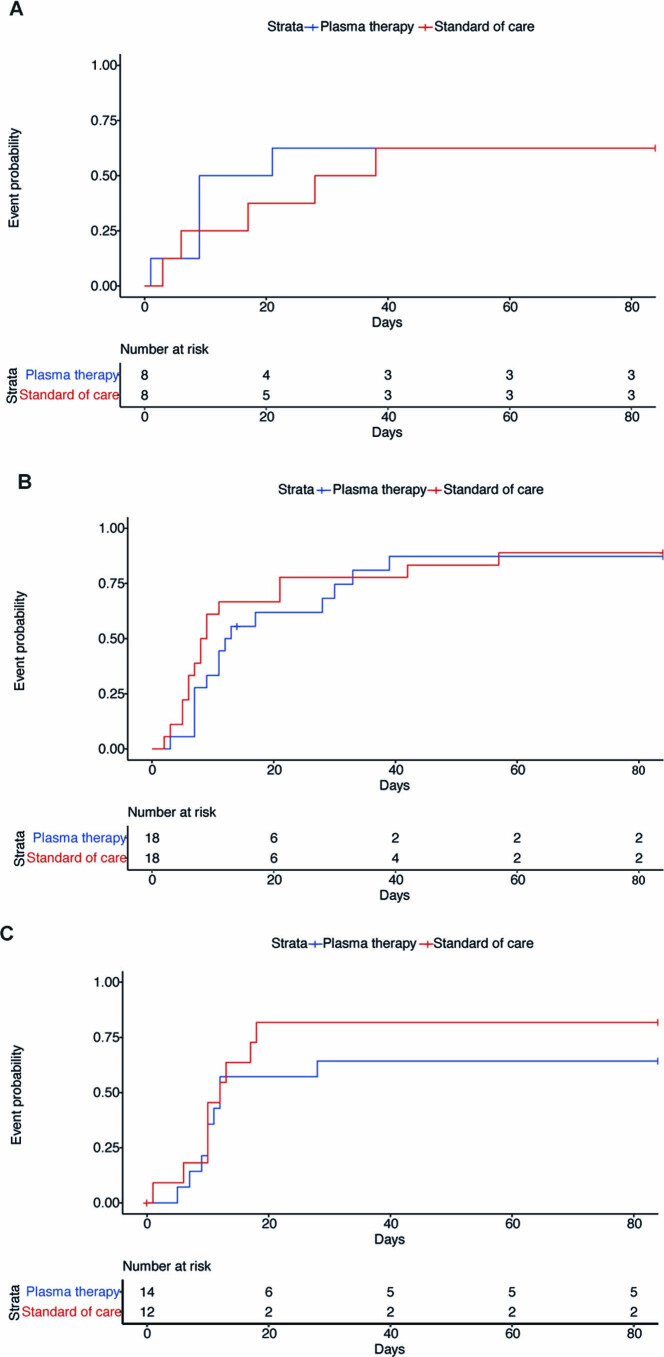
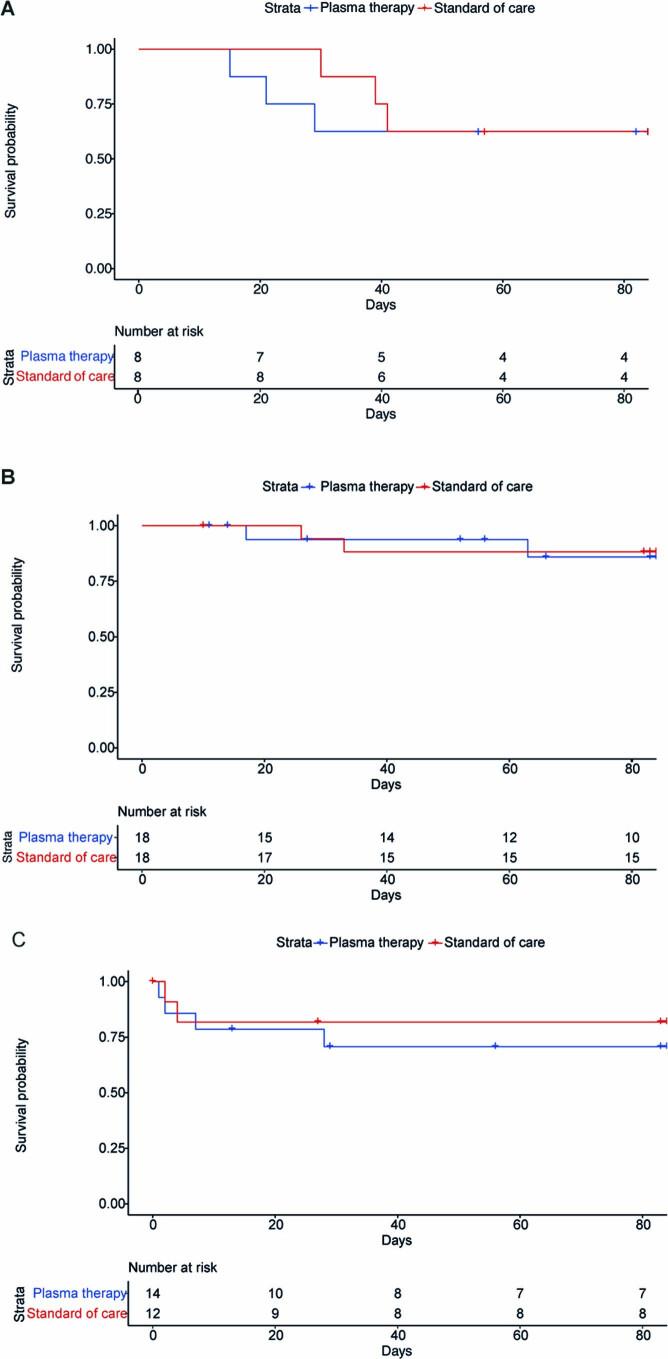
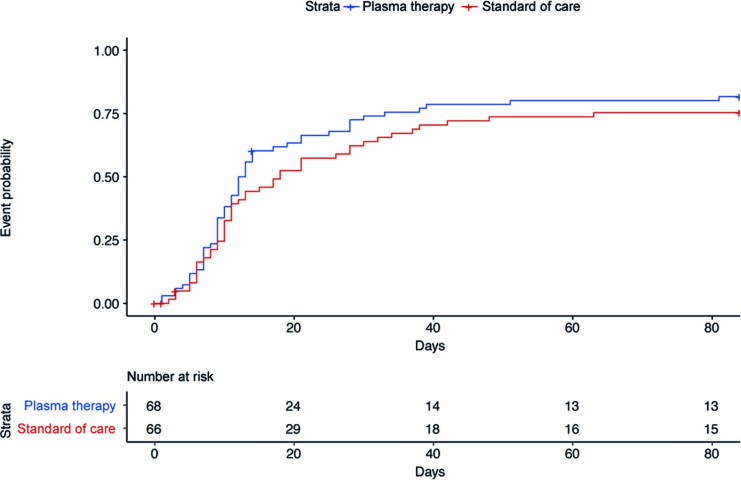
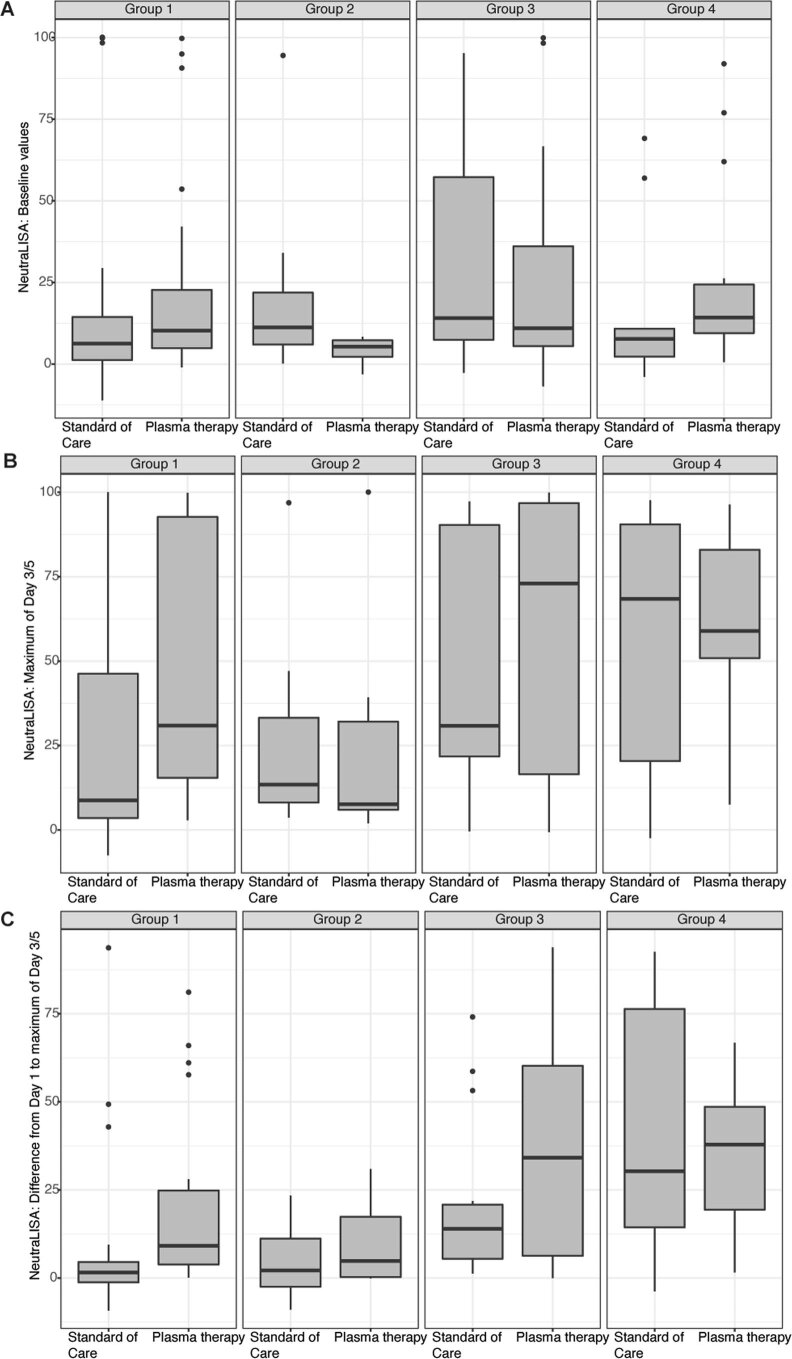
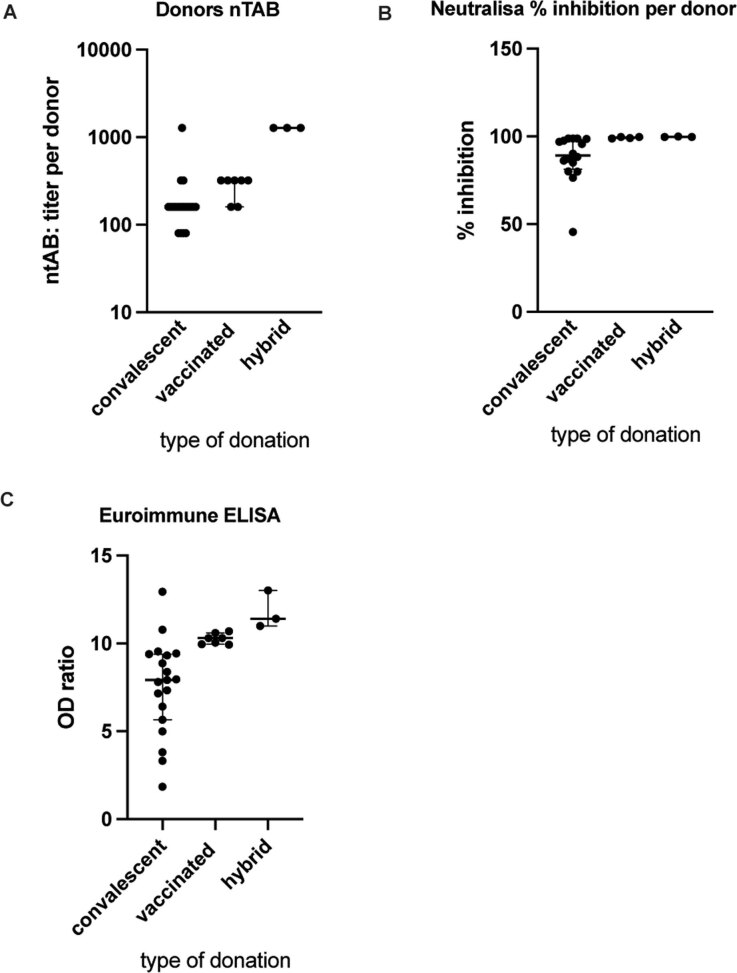
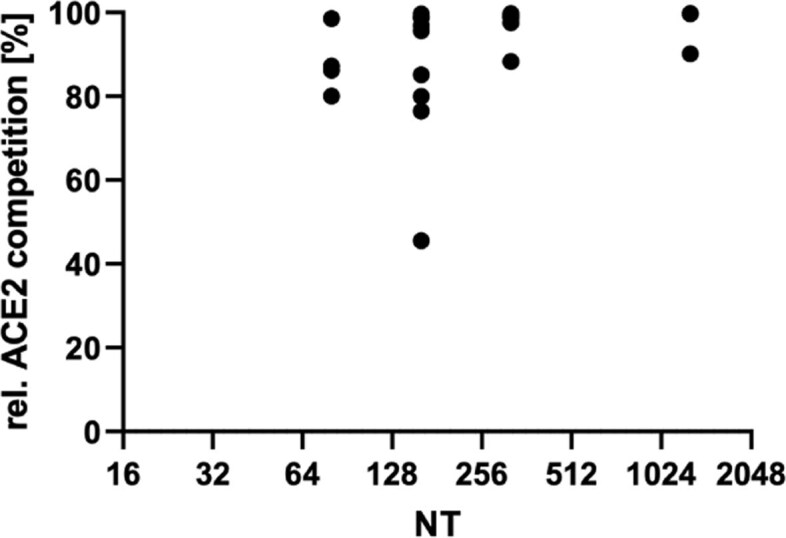
Patients with cancer are at high risk of severe coronavirus disease 2019 (COVID-19), with high morbidity and mortality. Furthermore, impaired humoral response renders severe acute respiratory syndrome coronavirus 2 (SARS-CoV-2) vaccines less effective and treatment options are scarce. Randomized trials using convalescent plasma are missing for high-risk patients. Here, we performed a randomized, open-label, multicenter trial ( https://www.clinicaltrialsregister.eu/ctr-search/trial/2020-001632-10/DE ) in hospitalized patients with severe COVID-19 (n = 134) within four risk groups ((1) cancer (n = 56); (2) immunosuppression (n = 16); (3) laboratory-based risk factors (n = 36); and (4) advanced age (n = 26)) randomized to standard of care (control arm) or standard of care plus convalescent/vaccinated anti-SARS-CoV-2 plasma (plasma arm). No serious adverse events were observed related to the plasma treatment. Clinical improvement as the primary outcome was assessed using a seven-point ordinal scale. Secondary outcomes were time to discharge and overall survival. For the four groups combined, those receiving plasma did not improve clinically compared with those in the control arm (hazard ratio (HR) = 1.29; P = 0.205). However, patients with cancer experienced a shortened median time to improvement (HR = 2.50; P = 0.003) and superior survival with plasma treatment versus the control arm (HR = 0.28; P = 0.042). Neutralizing antibody activity increased in the plasma cohort but not in the control cohort of patients with cancer (P = 0.001). Taken together, convalescent/vaccinated plasma may improve COVID-19 outcomes in patients with cancer who are unable to intrinsically generate an adequate immune response.


Conflict of interest statement

The authors declare no competing interests.

Figures

Fig. 1
Fig. 1. Consort diagram.
Patient flow within the RECOVER trial. aTwo more patients were initially randomized but were later removed from the randomization tool and database. For one patient, informed consent was lost. The other patient withdrew consent and requested the deletion of all data. bAll patients lost to follow-up reached the primary endpoint, as lost to follow up occurred after discharge.
Fig. 2
Fig. 2. Primary endpoint (time to improvement of two points on the 7POS or live hospital discharge).
a, Kaplan–Meier curve for the primary endpoint of a two-point improvement on the 7POS or live hospital discharge for the overall study cohort (groups 1–4) by plasma arm (blue) and control arm (red). The median time to improvement was 12.5 d (95% CI = 10–17) for the plasma arm and 18 d (95% CI = 11–28) for the control arm (log-rank P = 0.205). b, Forest plot with HRs for the primary endpoint overall (full analysis set) and by predefined subgroups. 95% CIs are provided in parentheses. The HRs are presented as the centers of the error bars. The error bars range from the lower to the upper 95% confidence limit. CP, convalescent plasma. c, Kaplan–Meier curve for the primary endpoint for group 1 by plasma arm (blue) and control arm (red). The median time to improvement was 13 d (95% CI = 7–14) for the plasma arm and 31 d (95% CI = 15–NA) for the control arm (log-rank P = 0.003). d, Kaplan–Meier curve for the primary endpoint for combined groups 2–4 by plasma arm (blue) and control arm (red). The median time to improvement was 12 d (95% CI = 10–28) for the plasma arm and 11 d (95% CI = 8–21) for the control arm (log-rank P = 0.3902). In a, c and d, the numbers of participants at risk are detailed below the Kaplan–Meier plot. See Extended Data Fig. 3 for separate data for groups 2–4. Source data
Fig. 3
Fig. 3. Secondary endpoint (overall survival).
a, Kaplan–Meier curve for survival probability for the overall study cohort (groups 1–4) by plasma arm (blue) and control arm (red) (log-rank P = 0.403). b, Forest plot with HRs for survival probability overall and by predefined subgroups. 95% CIs are provided in parentheses. The HRs are presented as the centers of the error bars. The error bars range from the lower to the upper 95% confidence limit. c, Kaplan–Meier curve for survival probability for group 1 by plasma arm (blue) and control arm (red) (log-rank P = 0.042). d, Kaplan–Meier curve for survival probability for combined groups 2–4 by plasma arm (blue) and control arm (red) (log-rank P = 0.555). In a, c and d, the numbers of participants at risk are detailed below the Kaplan–Meier plot. See Extended Data Fig. 4 for separate data for groups 2–4. Source data
Fig. 4
Fig. 4. SARS-CoV-2 neutralizing activity in patient plasma.
a, Baseline neutralizing activity in the overall analysis set (n = 56 for the control arm and n = 63 for the plasma arm), group 1 (n = 24 for the control arm and n = 25 for the plasma arm) and groups 2–4 (n = 32 for the control arm and n = 38 for the plasma arm), as measured by a surrogate inhibition assay on day 1 (after randomization and before plasma treatment). b, Highest levels of neutralizing activity on day 3/5 in the overall analysis set (n = 58 for the control arm and n = 64 for the plasma arm), group 1 (n = 25 for the control arm and n = 26 for the plasma arm) and groups 2–4 (n = 33 for the control arm and n = 38 for the plasma arm), as measured by a surrogate inhibition assay. c, Increase in neutralizing activity, analyzed as the percentage difference in neutralizing activity as measured by a surrogate inhibition assay on day 1 (after randomization and before plasma treatment) compared with the highest level from day 3/5, in the overall analysis set (n = 55 for the control arm and n = 62 for the plasma arm; *P = 0.012, two-sided van Elteren test stratified for patient group), group 1 (n = 24 for the control arm and n = 25 for the plasma arm; **P = 0.001, two-sided Wilcoxon signed-rank test) and groups 2–4 (n = 31 for the control arm and n = 37 for the plasma arm; P = 0.724 (not significant (NS)), two-sided van Elteren test stratified for patient group). In all panels, the boxplots indicate the IQR and the whisker length is limited to 1.5 times the IQR. Medians are indicated as horizontal lines within the boxes. Source data
Extended Data Fig. 1
Extended Data Fig. 1. Consort diagram for group-1 (hematological and solid cancer).
Consort diagram for group 1 (hematological and solid cancer).
Extended Data Fig. 2
Extended Data Fig. 2. Kaplan Meier curves for time to improvement on 7-point ordinal scale or live hospital discharge for group-2 to −4.
Kaplan Meier curves for cumulative probability of endpoint 2-point improvement on the 7-point ordinal scale or discharge by PLASMA (blue) and CONTROL (red) with number of subjects at risk below. (a) group 2; log-rank p = 0.860; (b) group 3; log-rank p = 0.472; (c) group 4; log-rank p = 0.452. Source data
Extended Data Fig. 3
Extended Data Fig. 3. Kaplan Meier curves for Survival for group-2 to −4.
Kaplan Meier curves for endpoint event survival by PLASMA (blue) and CONTROL (red) with number of subjects at risk. (a) group 2; log-rank p = 0.774; (b) group 3; log-rank p = 0.892 ; (c) group 4; log-rank p = 0.571. Source data
Extended Data Fig. 4
Extended Data Fig. 4. Kaplan Meier curves for Time to discharge overall.
Kaplan Meier curves for cumulative endpoint event discharge from hospital by PLASMA (blue) and CONTROL (red) with number of subjects at risk ; log-rank p = 0.217. Source data
Extended Data Fig. 5
Extended Data Fig. 5. NeutraLISA measurement in the four subgroups.
(a) Baseline neutralizing activity in group-1 (CONTROL: n = 24, PLASMA: n = 25), group-2 (CONTROL: n = 8, PLASMA: n = 6), group-3 (CONTROL: n = 14, PLASMA: n = 18) and group-4 (CONTROL: n = 9, PLASMA: n = 14) measured by a surrogate inhibition assay on day 1 (after randomization and prior to plasma treatment). Boxplots indicate the interquartile range and whisker length is limited to 1.5 times the interquartile range. Medians are indicated within the boxes. (b) Highest levels of neutralizing activity on day 3/5 in group-1 (CONTROL: n = 25, PLASMA: n = 26), group-2 (CONTROL: n = 8, PLASMA: n = 7), group-3 (CONTROL: n = 15, PLASMA: n = = 18) and group-4 (CONTROL: n = 10, PLASMA: n = 13) measured by a surrogate inhibition assay on day 1 (after randomization and prior to plasma treatment). Boxplots indicate the interquartile range and whisker length is limited to 1.5 times the interquartile range. Medians are indicated within the boxes. (c) Increase in neutralizing activity analyzed as the percent difference in neutralizing activity as measured by a surrogate inhibition assay on day 1 (after randomization and prior to plasma treatment) and compared to the highest level of day 3/5 in group-1 (CONTROL: n = 24, PLASMA: n = 25), group-2 (CONTROL: n = 8, PLASMA: n = 6), group-3 (CONTROL: n = 14, PLASMA: n = 18) and group-4 (CONTROL: n = 9, PLASMA: n = 13) measured by a surrogate inhibition assay on day 1 (after randomization and prior to plasma treatment). Boxplots indicate the interquartile range and whisker length is limited to 1.5 times the interquartile range. Medians are indicated within the boxes.
Extended Data Fig. 6
Extended Data Fig. 6. Column scatter plots for neutralization characteristics of donated plasma.
(a) ntAB titers per plasma donor; convalescent donors (n = 19, median = 160 (IQR: 160-160)); vaccinated donors (n = 7, median = 320 (IQR: 160-320)); hybrid donors (n = 3, median = 1280 (IQR: 1280-1280)). (b) NeutraLISA assay result as % inhibition; convalescent donors (n = 19, median = 89.23 (IQR: 81.32-98.33)); vaccinated donors (n = 4, median = 99.38 (IQR:98.85-99.68)); hybrid donors (n = 3, median = 99.69 (IQR: 99.69-99.91)). (c) OD ratio determined by antibody values measured with the Euroimmune ELISA; convalescent donors (n = 19, median = 7.92 (IQR: 5.65-9.39)); vaccinated donors (n = 7, median = 10.30 (IQR: 9.96-10.60)); hybrid donors (n = 3, median = 11.40 (IQR:10.99-13.02)). Abbreviations: ntAB neutralizing Antibodies.
Extended Data Fig. 7
Extended Data Fig. 7. Correlation between live virus neutralization assay and NeutraLISA.
NeutraLISA results on y-axis and live virus neutralization assay (as described in text S3) on the x-axis. Results show saturation of ACE2 competition in the NeutraLISA with titers of 1:80 and above.

Comment in

References

    1. Vijenthira A, et al. Outcomes of patients with hematologic malignancies and COVID-19: a systematic review and meta-analysis of 3377 patients. Blood. 2020;136:2881–2892. doi: 10.1182/blood.2020008824. - DOI - PMC - PubMed
    1. Pagano L, et al. COVID-19 infection in adult patients with hematological malignancies: a European Hematology Association Survey (EPICOVIDEHA) J. Hematol. Oncol. 2021;14:168. doi: 10.1186/s13045-021-01177-0. - DOI - PMC - PubMed
    1. Robilotti EV, et al. Determinants of COVID-19 disease severity in patients with cancer. Nat. Med. 2020;26:1218–1223. doi: 10.1038/s41591-020-0979-0. - DOI - PMC - PubMed
    1. Katzenschlager S, et al. Can we predict the severe course of COVID-19—a systematic review and meta-analysis of indicators of clinical outcome? PLoS ONE. 2021;16:e0255154. doi: 10.1371/journal.pone.0255154. - DOI - PMC - PubMed
    1. Levin AT, et al. Assessing the age specificity of infection fatality rates for COVID-19: systematic review, meta-analysis, and public policy implications. Eur. J. Epidemiol. 2020;35:1123–1138. doi: 10.1007/s10654-020-00698-1. - DOI - PMC - PubMed

Publication types

Substances