. 2023 Jan;4(1):27-42.
doi: 10.1038/s43018-022-00480-0. Epub 2022 Dec 29.

An inflammatory state remodels the immune microenvironment and improves risk stratification in acute myeloid leukemia

Affiliations

An inflammatory state remodels the immune microenvironment and improves risk stratification in acute myeloid leukemia

Audrey Lasry et al. Nat Cancer. 2023 Jan.

Erratum in

Abstract

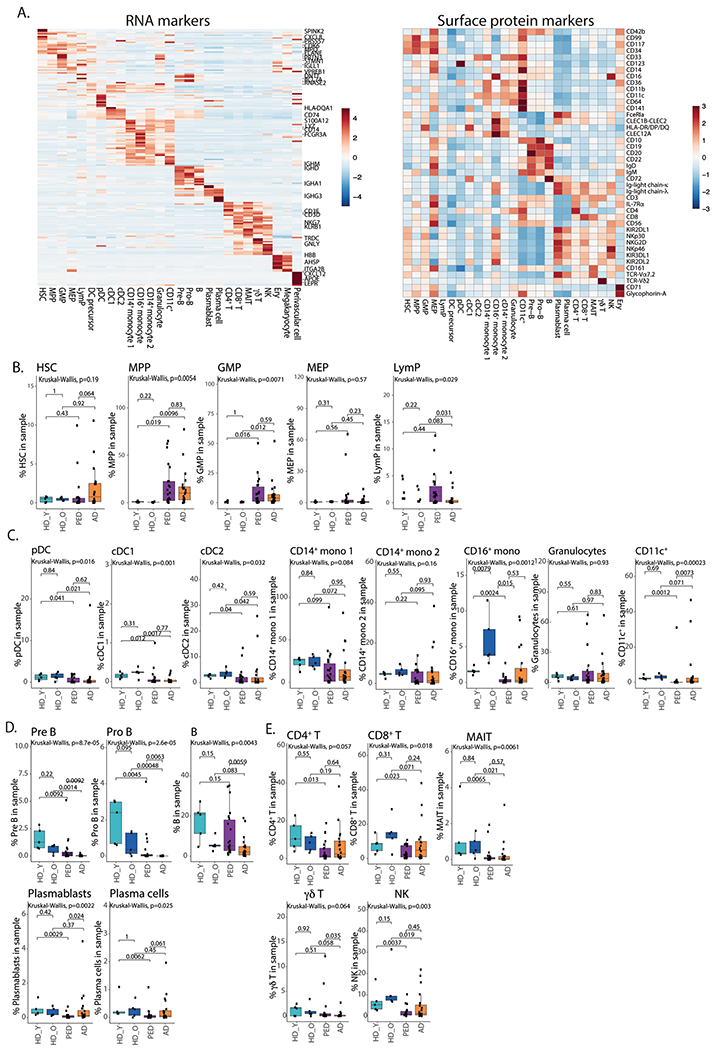
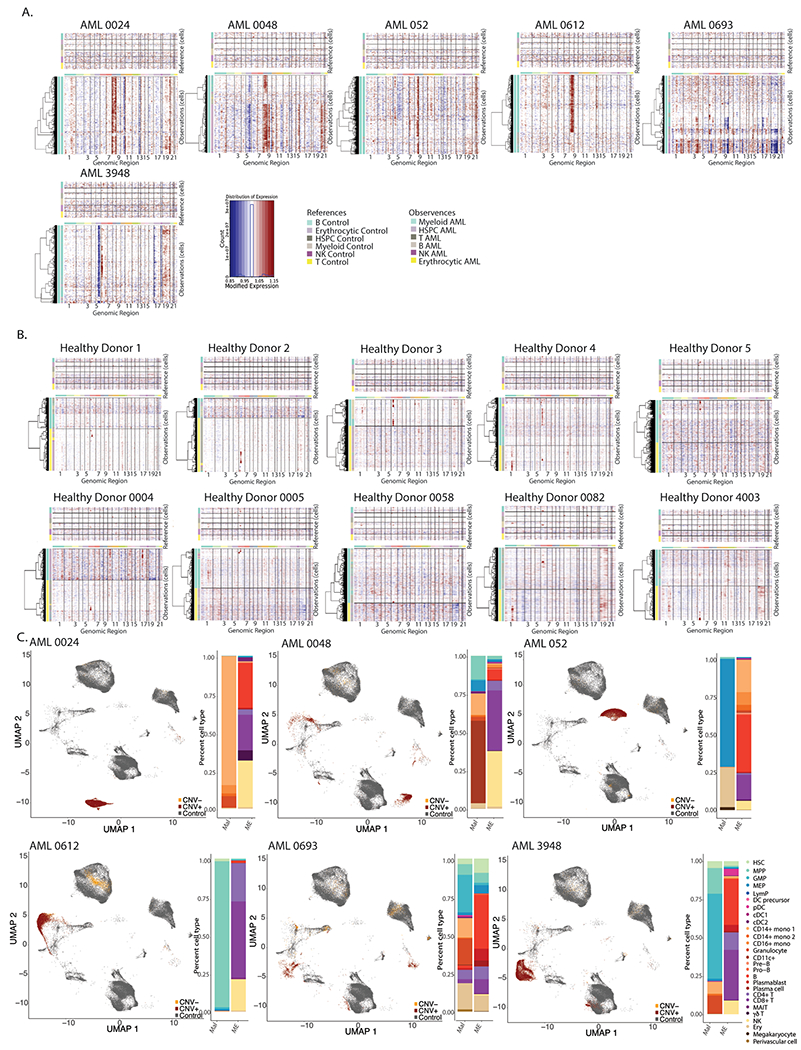
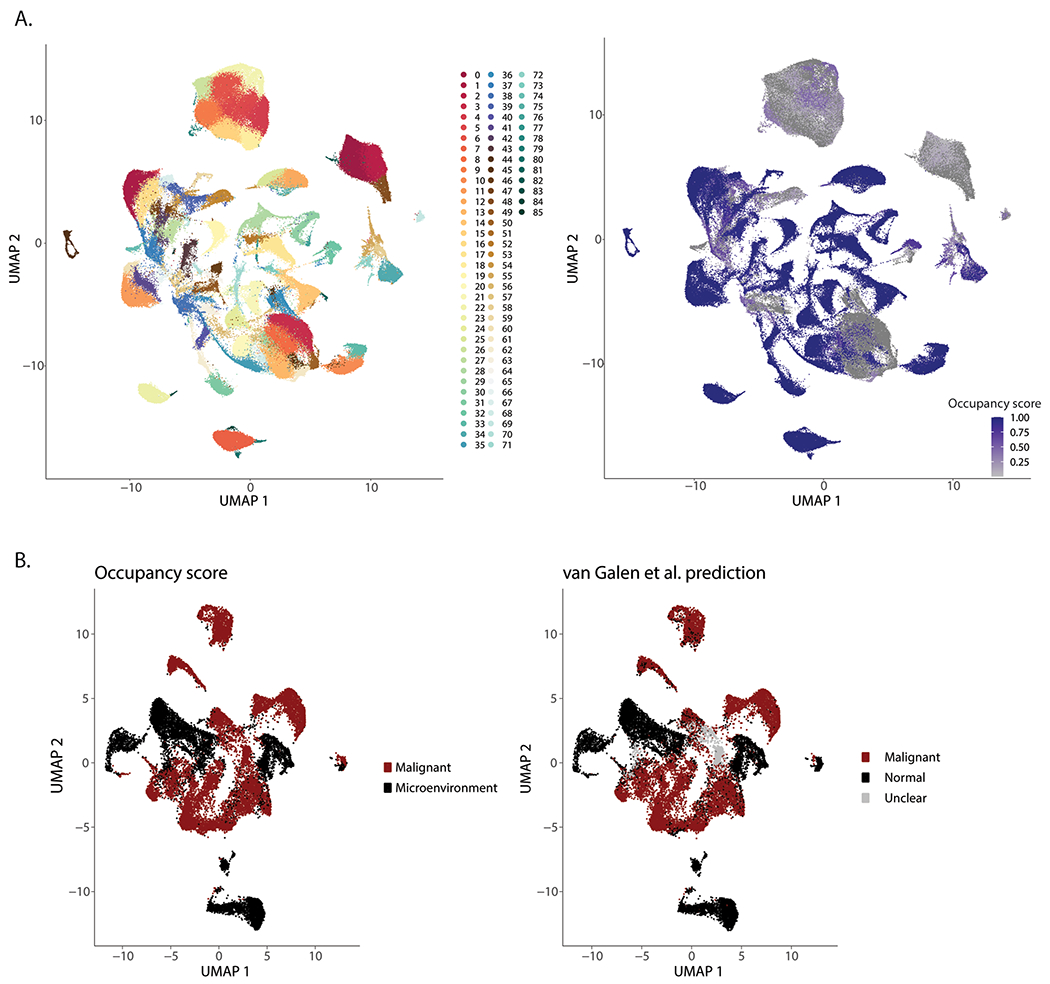
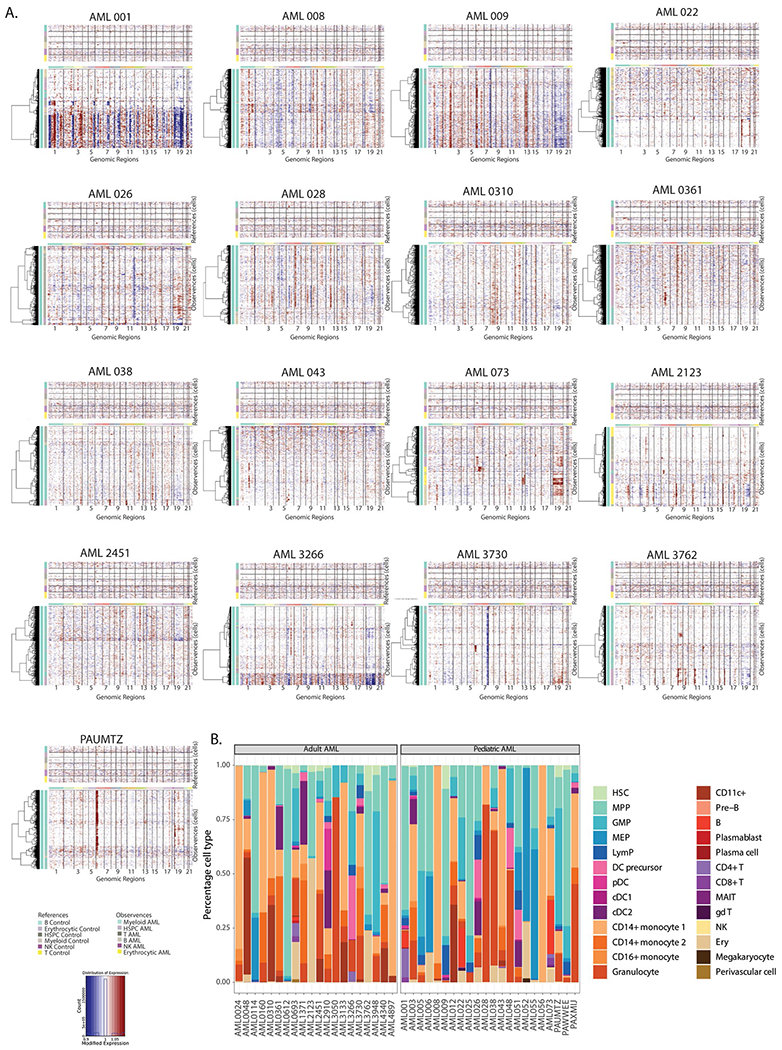
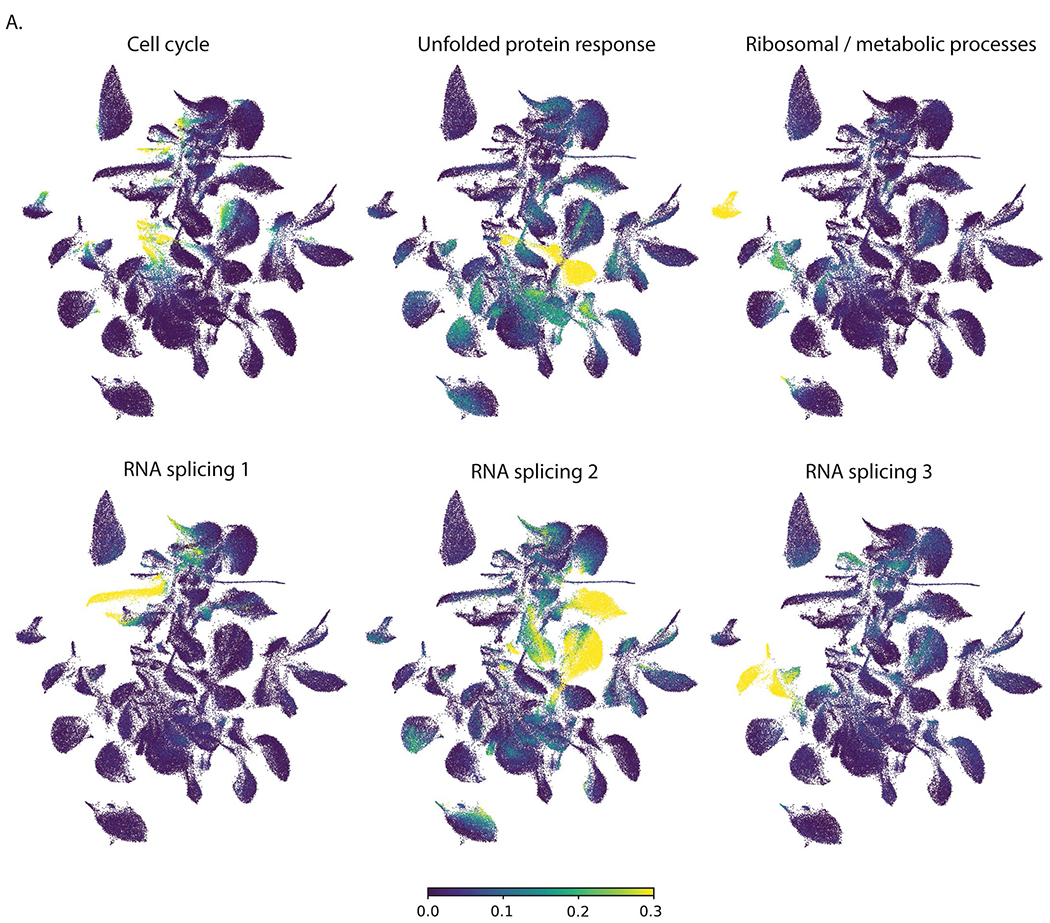
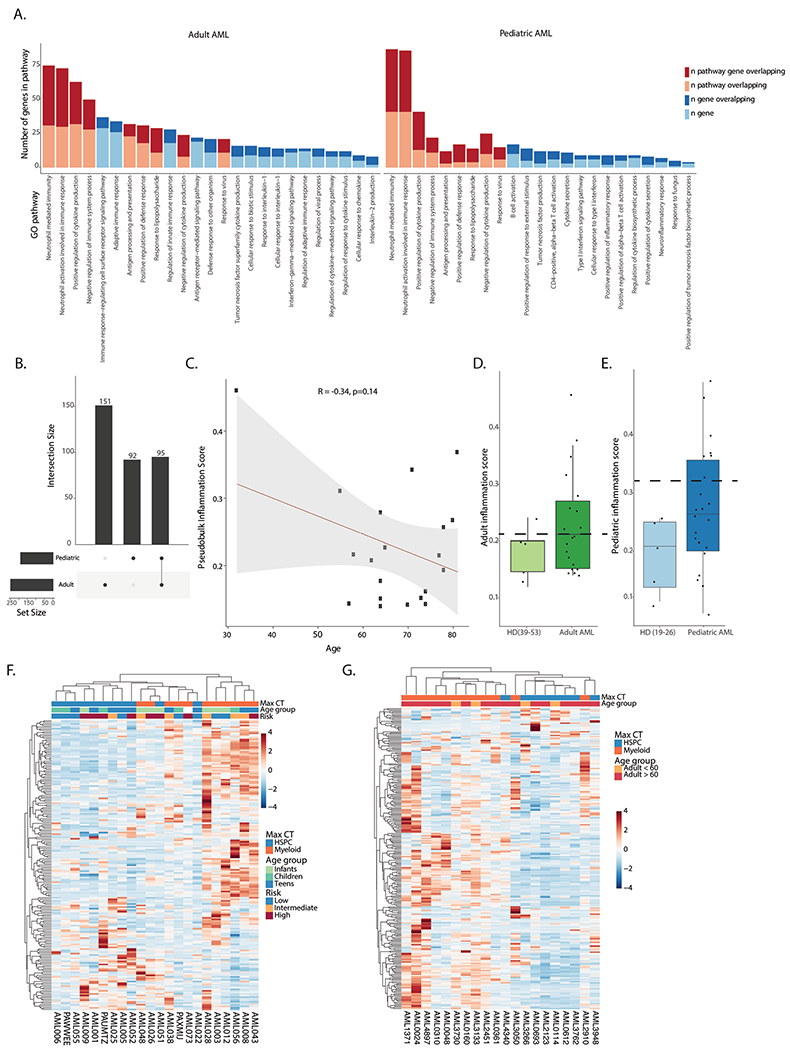
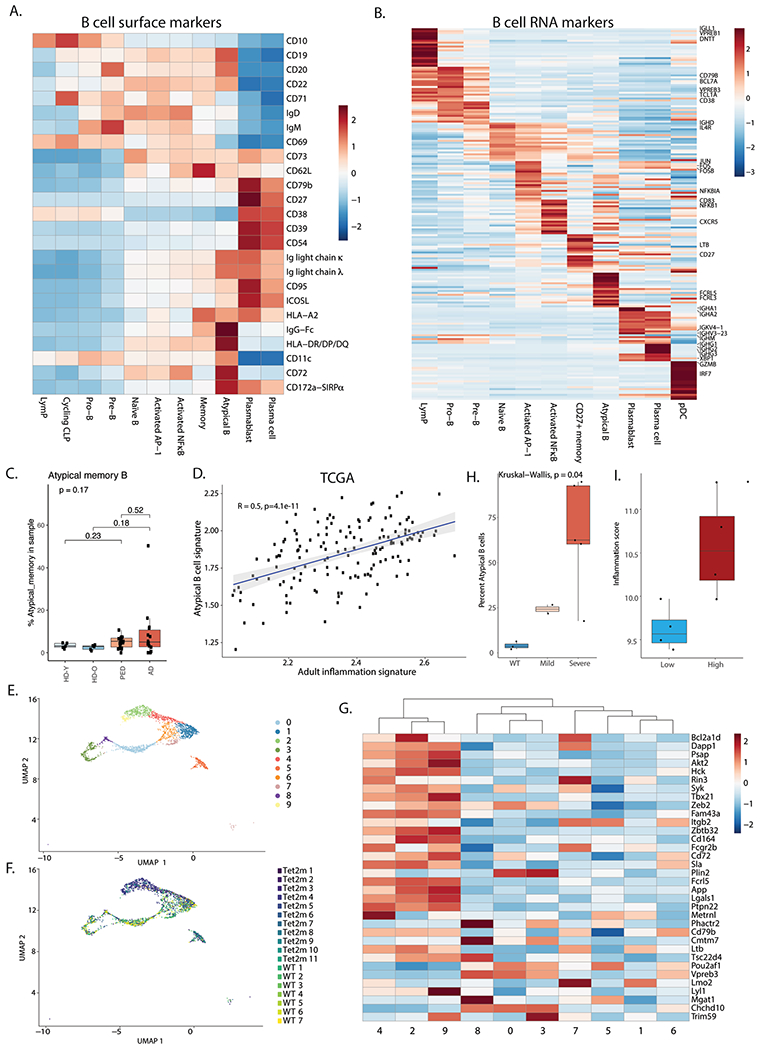
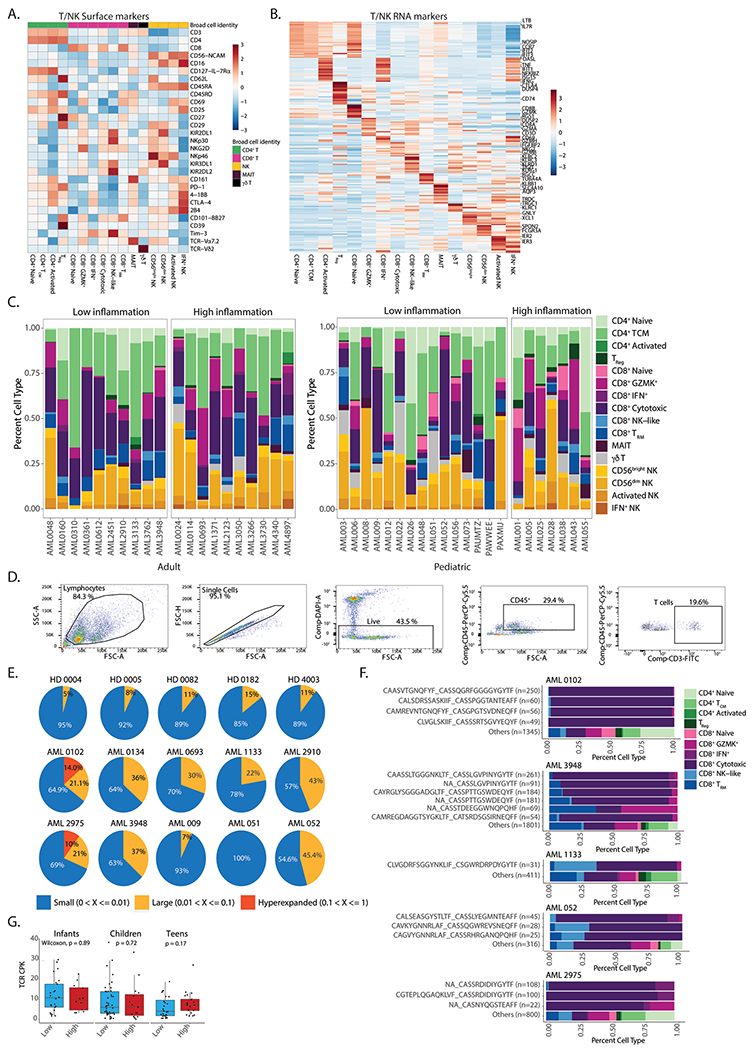
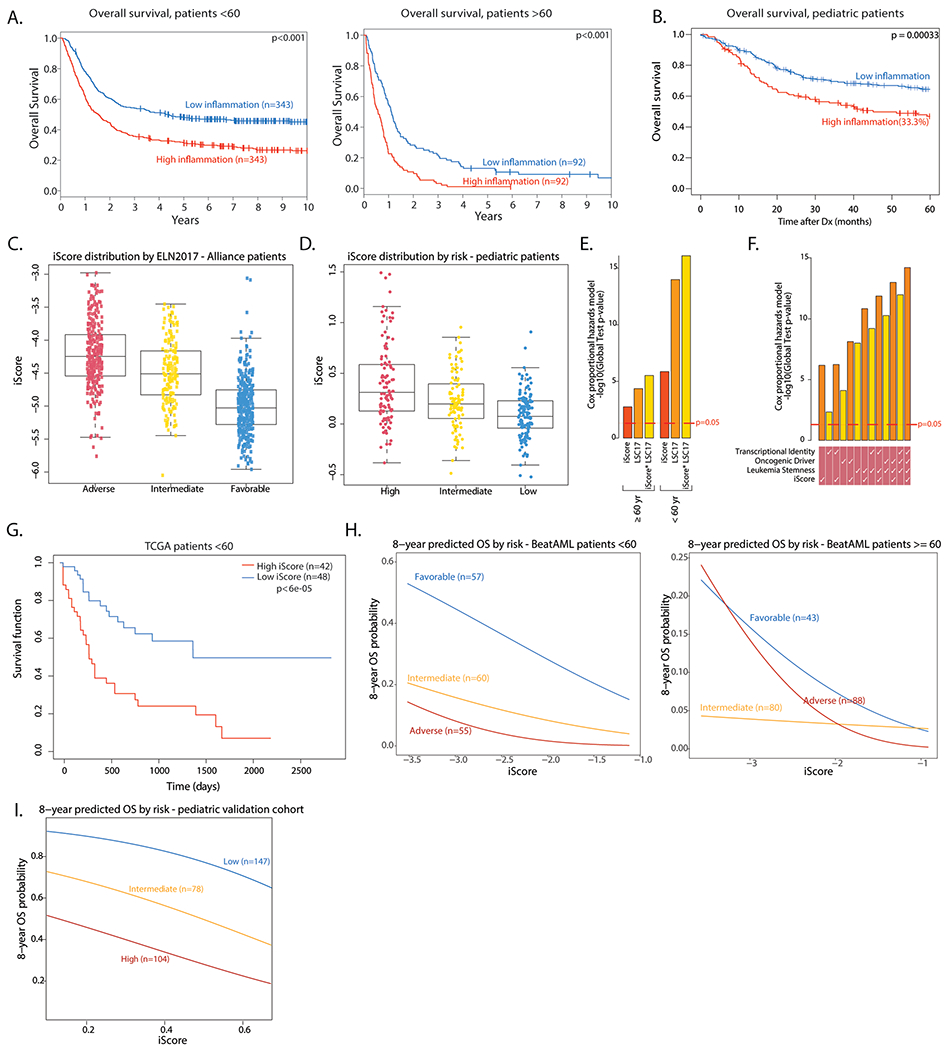
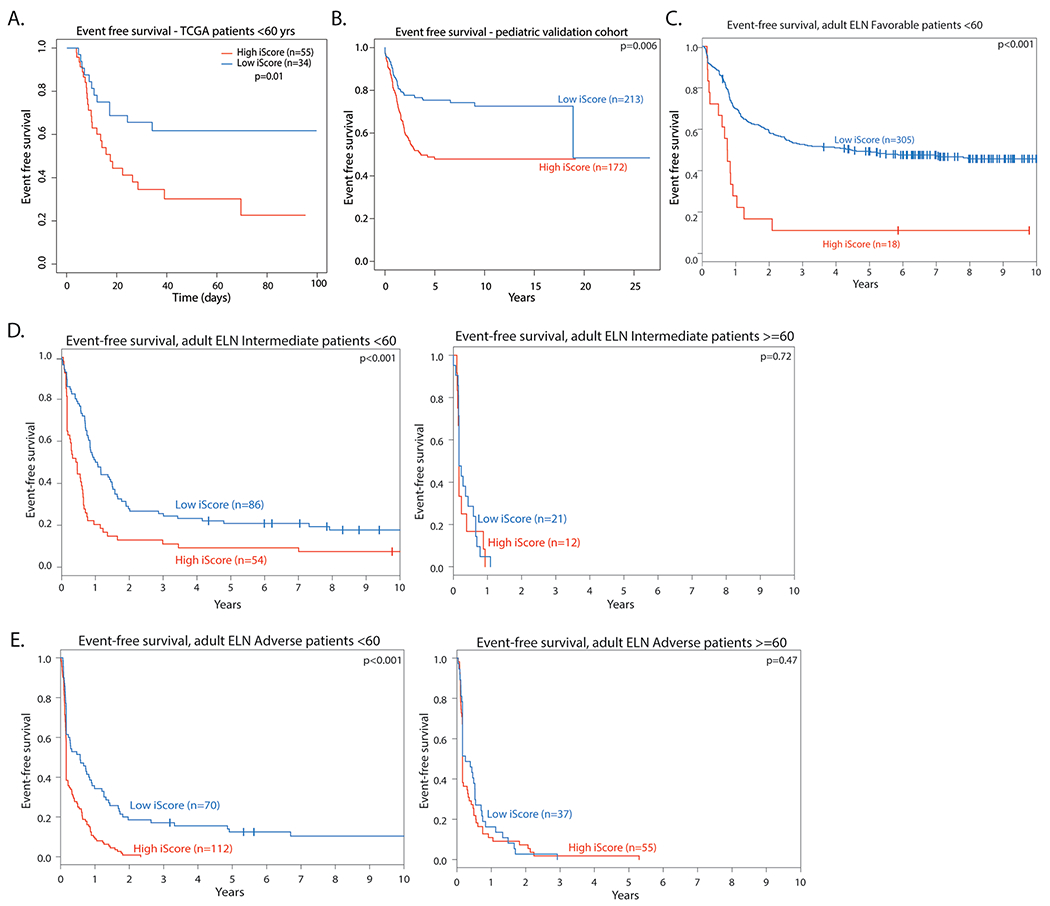
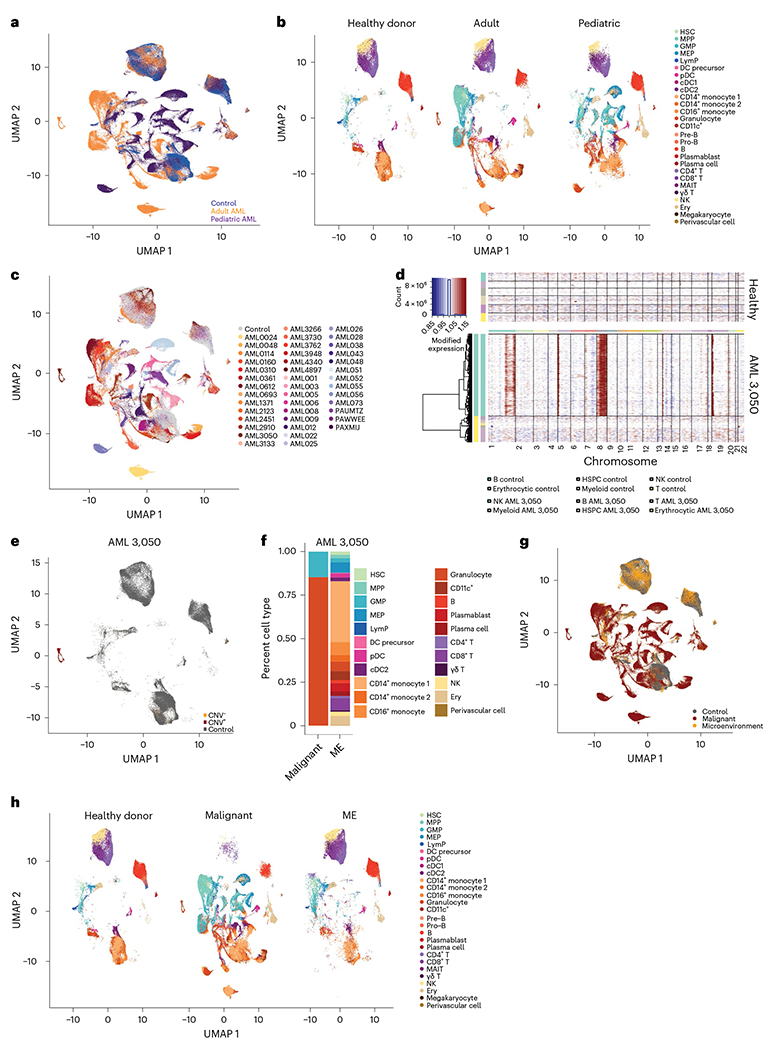
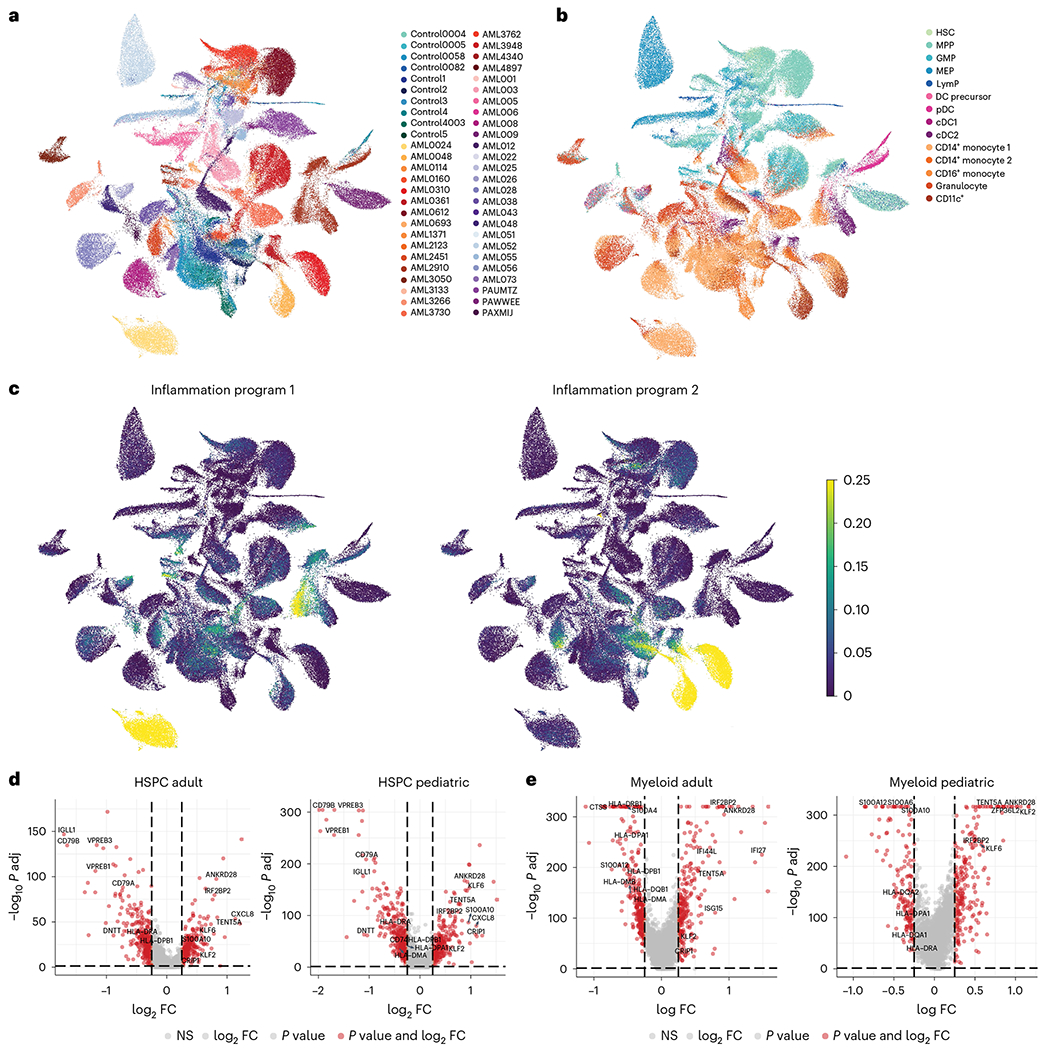
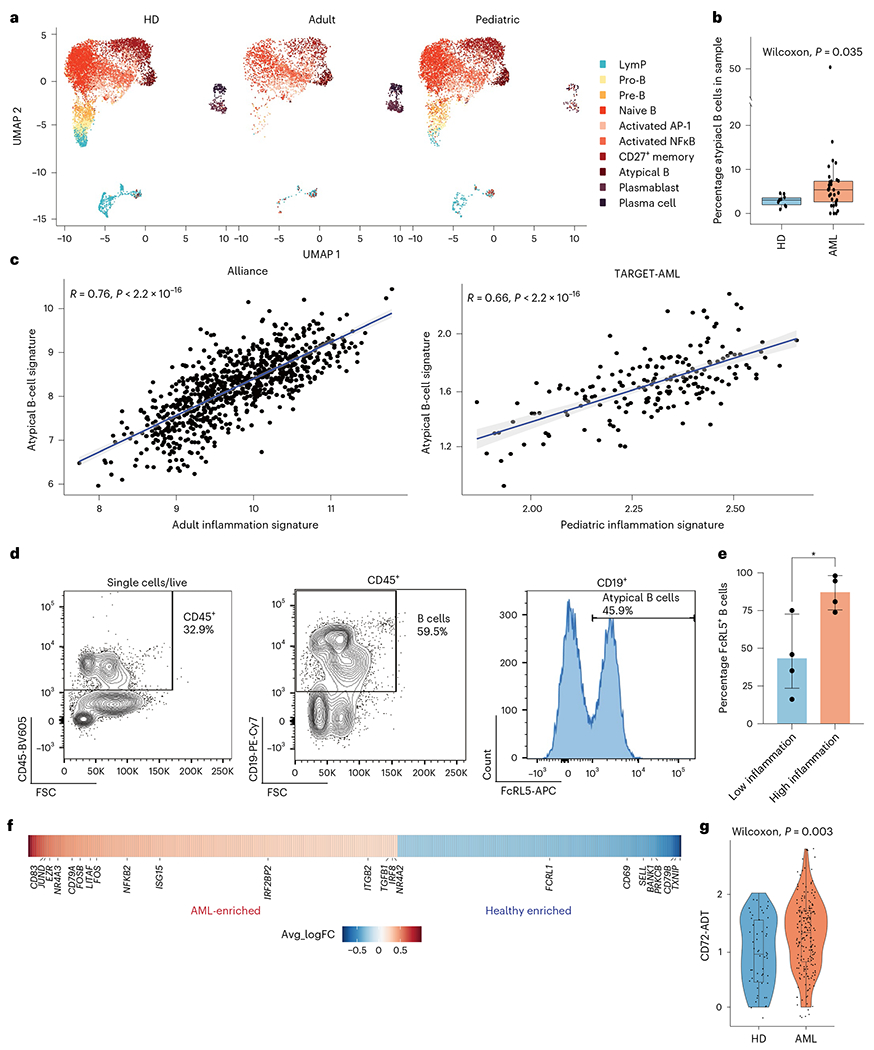
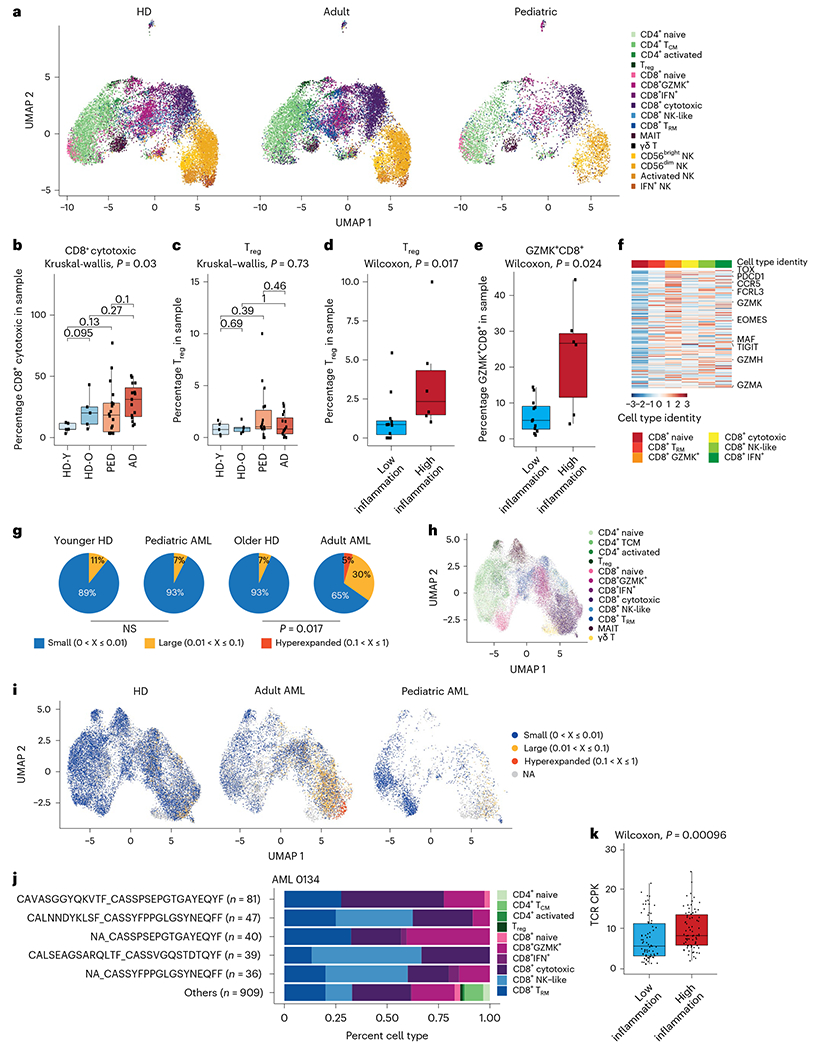
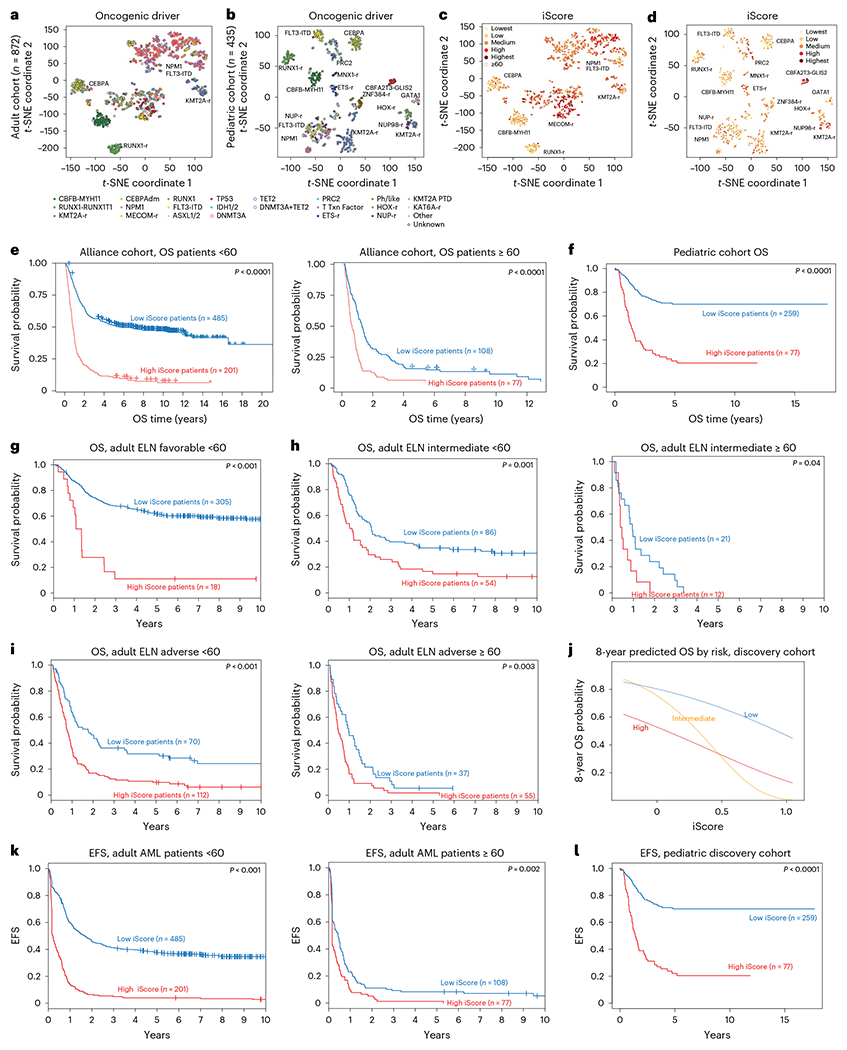
Acute myeloid leukemia (AML) is a hematopoietic malignancy with poor prognosis and limited treatment options. Here we provide a comprehensive census of the bone marrow immune microenvironment in adult and pediatric patients with AML. We characterize unique inflammation signatures in a subset of AML patients, associated with inferior outcomes. We identify atypical B cells, a dysfunctional B-cell subtype enriched in patients with high-inflammation AML, as well as an increase in CD8+GZMK+ and regulatory T cells, accompanied by a reduction in T-cell clonal expansion. We derive an inflammation-associated gene score (iScore) that associates with poor survival outcomes in patients with AML. Addition of the iScore refines current risk stratifications for patients with AML and may enable identification of patients in need of more aggressive treatment. This work provides a framework for classifying patients with AML based on their immune microenvironment and a rationale for consideration of the inflammatory state in clinical settings.


Conflict of interest statement

Competing interests

A.L., B.N., S.P., A.K.E., T.A.G. and A.I. submitted a patent application for the iScore patient risk stratification. I.A. is a consultant for Forsite Labs. T.A.G. is a consultant for Kura Oncology and Janssen. A.T. is a scientific advisor to Intelligencia AI.

Figures

Extended Data Fig. 1 |
Extended Data Fig. 1 |. Cell populations in the bone marrow.
a. Heatmap of average expression of top RNA cluster markers for different cell subsets in the BM (left), heatmap of average expression of surface protein markers for different cell subsets in the BM (right). HSC – hematopoietic stem cells, MPP – multipotent progenitors, GMP – granulocyte-monocyte progenitors, MEP – megakaryocyte progenitors, LymP – lymphoid progenitors, DC – dendritic cells, Ery – erythrocytes. b. Quantification of HSPC subsets in the BM. Box plots represent the median with the box bounding the interquartile range (IQR) and whiskers showing the most extreme points within 1.5 × IQR. c. Quantification of myeloid subsets in the BM. Box plots represent the median with the box bounding the interquartile range (IQR) and whiskers showing the most extreme points within 1.5 × IQR. d. Quantification of B cell subsets in the BM. e. Quantification of conventional (CD4+, CD8+), non-conventional (MAIT, γδ) and NK cells in the BM. Box plots represent the median with the box bounding the interquartile range (IQR) and whiskers showing the most extreme points within 1.5× IQR. All statistical tests shown in this figure are two-sided. Pair-wise comparisons were evaluated using Wilcoxon test, multi-group comparisons were evaluated using Kruskal-Wallis test. For panels B-E, HD_Y – Healthy donors 19-26 years old (n = 5), HD_O – healthy donors 39-55 years old (n = 5), PED – pediatric patients with AML (n = 22), AD – adult AML patients (n = 20).
Extended Data Fig. 2 |
Extended Data Fig. 2 |. Separation of malignant and microenvironment cells in AML samples.
a. InferCNV heatmaps for patients with clinically annotated chromosome gains or losses. b. InferCNV heatmaps for healthy donor BM samples. c. UMAP projection of Healthy donors, CNV+ and CNV− cells from patients with annotated chromosome gains or losses (left), quantification of malignant and microenvironment cells for each sample (right).
Extended Data Fig. 3 |
Extended Data Fig. 3 |. Validation of occupancy score method.
a. UMAP projection depicting cell clustering for calculation of occupancy scores. b. UMAP projection of occupancy score. c. UMAP projection of malignant and microenvironment cells based on occupancy scores (left) or single cell genotyping (right).
Extended Data Fig. 4 |
Extended Data Fig. 4 |. Non-annotated karyotype aberrations detected by InferCNV.
a. InferCNV heatmaps for patient samples with non-annotated karyotype aberrations. b. Patient-by-patient quantification of broad cell types in malignant cells.
Extended Data Fig. 5 |
Extended Data Fig. 5 |. Pathogenic programs in AML.
a. UMAP projections of cells expressing different gene expression programs identified by NMF.
Extended Data Fig. 6 |
Extended Data Fig. 6 |. Inflammatory signatures in AML.
a. Pathway analysis for genes in the adult (left) and pediatric (right) inflammation signatures. b. Overlap between genes in the adult and pediatric inflammation signatures. c. Pearson correlation between age and inflammation score in the adult AML cohort. d. Inflammation score in older controls (n = 5) and adult AML patients (n = 20) in the single cell cohort. Dashed line represents cutoff for high or low inflammation. Box plots represent the median with the box bounding the interquartile range (IQR) and whiskers showing the most extreme points within 1.5× IQR. e. Inflammation score in younger controls (n = 5) and pediatric AML patients (n = 22). Dashed line represents cutoff for high or low inflammation. Box plots represent the median with the box bounding the interquartile range (IQR) and whiskers showing the most extreme points within 1.5× IQR. f. Heatmap of average expression of the pediatric inflammation signature in malignant cells from pediatric patients. Max CT – maximum cell count. Infants – 0–3 years old (n = 6), children – 3–12 years old (n = 9), teens − 12–21 years old (n = 7). g. Heatmap of average expression of the adult inflammation signature in malignant cells from adult patients. Max CT – maximum cell type.
Extended Data Fig. 7 |
Extended Data Fig. 7 |. Inflammatory B cells in AML.
a. Heatmap of average expression of surface protein markers in different B cell subsets. CLP – common lymphoid progenitor. b. Heatmap of average expression of RNA markers in different B cell subsets. c. Quantification of Atypical B cells split by young healthy donor (n = 5), older healthy donors (n = 5) adult (n = 14) and pediatric (n = 19) AML patients. Note the reduction in patient numbers due to exclusion of patients with less than 50 B cells in the BM. Box plots represent the median with the box bounding the interquartile range (IQR) and whiskers showing the most extreme points within 1.5 × IQR. d. Pearson correlation between the atypical B cell gene signature and the adult inflammation signature in the TCGA cohort (n = 152). e. UMAP representation of B cells from wild type (WT, n = 7) and Tet2 mutant (n = 11) mouse BM. f. UMAP representation of wild type (WT, n = 7) and Tet2 mutant (n = 11) cell distribution in B cell clusters. g. Heatmap showing expression of the mouse atypical B cell gene signature in B cell clusters in wild type (WT, n = 7) and Tet2 (n = 11) mutant mouse BM. h. Quantification of atypical B cells in aged wild type (WT, n = 3) or Tet2 mutant mice (n = 7). Mild – mild disease (n = 2), severe – severe disease (n = 5). Statistical tests in this panel are two-sided. Box plots represent the median with the box bounding the interquartile range (IQR) and whiskers showing the most extreme points within 1.5 × IQR. i. Inflammation scores of samples used for FACS validation of atypical B cell expansion in high inflammation AML BM (high inflammation n = 4, low inflammation n = 4). Box plots represent the median with the box bounding the interquartile range (IQR) and whiskers showing the most extreme points within 1.5× IQR. All pair-wise comparisons were evaluated using Wilcoxon test, multi-group comparisons were evaluated using Kruskal-Wallis test.
Extended Data Fig. 8 |
Extended Data Fig. 8 |. T cell responses in AML.
a. Heatmap of average expression of surface protein markers in different T cell subsets. TCM – central memory T cells; TReg – regulatory T cells; TRM – resident memory T cells. b. Heatmap of average expression of RNA markers in different T cell subsets. c. Quantification of T cell subsets in high and low inflammation AML patients. d. Gating strategy for sorting of T cells from AML or healthy donor BM aspirates. e. Pie charts representing the fraction of small (0-1%), large (1-10%) and hyperexpanded (10–100%) clones in individual samples. f. Quantification of CD8+ subsets from expanded clones in AML patients. g. Clonal diversity in infants (0-3 years old, n = 37), children (3-12 years old, n = 59) and teens (12-21 years old, n = 49) from the TARGET-AML bulk RNA-Seq cohort. All statistical tests shown in this figure are two-sided. All box plots represent the median with the box bounding the interquartile range (IQR) and whiskers showing the most extreme points within 1.5× IQR. All pair-wise comparisons were evaluated using Wilcoxon test.
Extended Data Fig. 9 |
Extended Data Fig. 9 |. Clinical implications of inflammation in AML.
a. Overall survival of high and low inflammation adult AML patients in the Alliance cohort (n = 686 < 60 years old, n = 184 > =60 years old). Log rank test was used to evaluate significance. b. Overall survival of high and low inflammation pediatric AML patients in the TARGET-AML cohort (n = 336). Log rank test was used to evaluate significance. c. Distribution of the iScore in adult AML patients in the Alliance cohort, by risk (Adverse risk - n = 274, Intermediate risk - n = 176, Favorable - n = 359). Box plots represent the median with the box bounding the interquartile range (IQR) and whiskers showing the most extreme points within 1.5× IQR. d. Distribution of the iScore in pediatric AML patients in the TARGET cohort, by risk (High risk - n = 105, intermediate risk - n = 95, low risk - n = 136). Box plots represent the median with the box bounding the interquartile range (IQR) and whiskers showing the most extreme points within 1.5× IQR. e. Overall survival association of iScore and LSC17 in adult AML patients (n = 686 < 60 years old, n = 184 > =60 years old) assessed by global test. f. Overall survival association of iScore and other prognostic predictors in pediatric AML patients (n = 336) assessed by global test. g. Overall survival in high and low iScore patients in the TCGA AML cohort (<60 yrs, n = 90). h. 8-year predicted overall survival (OS) in favorable, intermediate and adverse risk adult AML patients in the BeatAML cohort (n = 172 < 60 years old, n = 211 > =60 years old), based on iScore. H. 8-year predicted OS in low, intermediate and high risk pediatric patients in a pediatric microarray cohort (n = 329), based on iScore.
Extended Data Fig. 10 |
Extended Data Fig. 10 |. Effect of iScore on event free survival in AML.
a. Event free survival in high and low iScore Favorable risk patients in adult patients in the TCGA AML cohort (<60 yrs, n = 89). Log rank test was used to evaluate significance. b. Event free survival in pediatric patients in a microarray cohort (n = 372). Log rank test was used to evaluate significance. c. Event Free survival in high and low iScore favorable risk patients in the Alliance AML cohort (n = 323 < 60 years old). Log rank test was used to evaluate significance. d. Event free survival in high and low iScore intermediate risk patients in the Alliance AML cohort (n = 140 < 60 years old, n = 33 > =60 years old). Log rank test was used to evaluate significance. e. Event free survival in high and low iScore adverse risk patients in the Alliance AML cohort (n = 182 < 60 years old, n = 92 > =60 years old). Log rank test was used to evaluate significance.
Fig. 1 |
Fig. 1 |. The single-cell landscape of adult and pediatric AML.
a, UMAP projection of healthy donors (n = 10), adult (n = 20) and pediatric (n = 22) AML BM cells. b, Split UMAP projection of healthy donors (n = 10), adult (n = 20) and pediatric (n = 22) AML cells, annotated by cell type based on transcriptome and surface protein expression. MEP, megakaryocyte progenitor; LymP, lymphoid progenitor; DC, dendritic cell; Ery, erythrocyte. c, UMAP representation of cells from healthy donors (n = 10, gray) or patients with AML (n = 42, colored), highlighting patient-specific clusters in AML. d, InferCNV heat map demonstrating copy gains in chromosomes 1, 5, 8 and 19 for sample AML 3050. e, UMAP projection of control, CNV+and CNV cells from sample AML 3050.Gray indicates healthy donor cells (n = 10). f, Quantification of malignant and microenvironment (ME) cells from sample AML 3050. g, UMAP projection of healthy donors (n = 10), malignant and microenvironment cells from patients with AML (n = 37), following inferCNV and occupancy score analysis. h, Split UMAP projection of annotated cells from healthy donors (n = 10), malignant and microenvironment populations (n = 37 patients with AML) in the BM. All UMAP projections are based on the same coordinates.
Fig. 2 |
Fig. 2 |. Inflammatory pathways in malignant AML cells.
a, UMAP representation of healthy donor HSPCs and myeloid cells and malignant cells from adult and pediatric patients with AML. b, UMAP representation of healthy donor and malignant cells annotated by cell type. c, UMAP representation of cells expressing inflammation-related features identified by NMF. d, Volcano plots depicting genes enriched (right) or depleted (left) in malignant HSPCs from adult and pediatric patients with AML. FC, fold change; NS, not significant. e, Volcano plots depicting genes enriched (right) or depleted (left) in malignant myeloid cells from adult and pediatric patients with AML. For all panels, healthy donor n = 10 and patients with AML n = 37 (n = 18 adult, n = 19 pediatric)
Fig. 3 |
Fig. 3 |. Atypical B cells are associated with high inflammation in AML.
a, Split UMAP projection of B cells from healthy donors (HDs) (n = 10), adult (n = 20) and pediatric (n = 22) AML BM, annotated based on transcriptome and surface protein expression. b, Quantification of atypical B cells in healthy donors (n = 10) and AML (n = 30) BM. Wilcoxon test was used to evaluate statistical significance. Box plots represent the median with the box bounding the interquartile range (IQR) and whiskers showing the most extreme points within 1.5 × IQR. c, Correlation between the atypical B-cell signature and the inflammation signature in the Alliance cohort (adult patients, n = 872) and the TARGET-AML cohort (pediatric patients, n = 157). d, Representative FACS plot showing gating strategy for atypical B cells in BM aspirates. e, Quantification of FACS analysis of atypical B cells in BM aspirates from low-inflammation (blue, n = 4) and high-inflammation (red, n = 4) patients with AML. Error bars represent s.d. A t-test was used to evaluate statistical significance. f, Heat map of genes upregulated (red) or downregulated in atypical B cells from patients with AML compared to control. g, CD72 surface protein expression on atypical B cells from control (blue, n = 2) and patients with AML (red, n = 10). Wilcoxon test was used to evaluate statistical significance. Box plots represent the median with the box bounding the IQR and whiskers showing the most extreme points within 1.5 × IQR. All statistical tests shown in this figure are two-sided.
Fig. 4 |
Fig. 4 |. T-cell responses in human AML.
a, Split UMAP projection of T and NK cells from healthy donors (n = 10) and adult (n = 20) and pediatric (n = 22) patients with AML. b, Quantification of cytotoxic CD8+ T cells in healthy donors and pediatric and adult patients with AML. HD_Y, healthy donors 19–26 years old (n = 5); HD_O, healthy donors 39–55 years old (n = 5); PED, pediatric AML (n = 22); AD, adult AML (n = 20). Box plots represent the median with the box bounding the IQR and whiskers showing the most extreme points within 1.5 × IQR. A Kruskal–Wallis test was used to evaluate statistical significance in multigroup comparison, whereas a Wilcoxon test was used for two-group comparisons. c, Quantification of Treg cells in healthy donors, and pediatric and adult patients with AML. Box plots represent the median with the box bounding the IQR and whiskers showing the most extreme points within 1.5 × IQR. A Kruskal–Wallis test was used to evaluate statistical significance in multigroup comparison, whereas a Wilcoxon test was used for two-group comparisons. d, Quantification of Treg cells in low- (n = 12) or high-inflammation (n = 6) pediatric patients with AML. Box plots represent the median with the box bounding the IQR and whiskers showing the most extreme points within 1.5 × IQR. A Wilcoxon test was used to evaluate statistical significance. e, Quantification of GZMK+ CD8+ T cells in low- (n = 12) or high-inflammation (n = 6) pediatric patients with AML. Box plots represent the median with the box bounding the IQR and whiskers showing the most extreme points within 1.5 × IQR. A Wilcoxon test was used to evaluate statistical significance. f, Heat map of expression of the Tpex cell gene signature in CD8+ T cells in the BM. g, Pie charts representing the fraction of small (0–1%), large (1–10%) or hyperexpanded (10–100%) T-cell clones in controls and patients with AML (adult, n = 7; pediatric, n = 3). Younger HD, healthy donors 19–22 years old (n = 3); older HD, healthy donors 43–55 years old (n = 2). NS, not significant. h, UMAP projection of T cells from healthy donors (n = 5) and adult (n = 7) and pediatric (n = 3) patients with AML, annotated based on transcriptome. i, UMAP projection of T-cell clones from healthy donors (n = 5) and adult (n = 7) and pediatric (n = 3) patients with AML. NA, not available. j, Quantification of CD8+ subsets from expanded clones for sample AML 0134. A full list of expanded clonotypes is in Supplementary Table 10. k, Clonal diversity in low-inflammation (n = 75) and high-inflammation (n = 76) patients with AML from the TCGA cohort. Box plots represent the median with the box bounding the IQR and whiskers showing the most extreme points within 1.5 × IQR. A Wilcoxon test was used to evaluate statistical significance. All statistical tests shown in this figure were two-sided.
Fig. 5 |
Fig. 5 |. iScore associates with distinct subsets of human AML.
a, t-SNE representation of bulk RNA-seq data of adult patients with AML in the Alliance cohort (n = 872). b, t-SNE representation of bulk RNA-seq data of pediatric patients with AML in a large bulk RNA-seq cohort (n = 435). c, Adult iScore in bulk RNA-seq data of patients in the Alliance cohort (n = 872). d, Pediatric iScore in bulk RNA-seq data of patients in a pediatric bulk RNA-seq cohort (n = 435). e, OS of high and low iScore adult patients with AML in the Alliance cohort (n = 872). Log-rank test was used to evaluate significance. f, OS of high and low iScore pediatric patients with AML in the TARGET-AML cohort (n = 336). Log-rank test was used to evaluate significance. g, OS of adult ELN favorable high and low iScore patients in the Alliance cohort (n = 323). Log-rank test was used to evaluate significance. h, OS of adult ELN intermediate high and low iScore patients in the Alliance cohort (n = 140, <60 years old; n = 33, ≥60 years old). Log-rank test was used to evaluate significance. i, OS of adult ELN adverse high and low iScore patients in the Alliance cohort (n = 182, <60 years old; n = 92, ≥60 years old). Log-rank test was used to evaluate significance. j, Eight-year predicted OS in low-, intermediate- and high-risk patients in a pediatric cohort (n = 336). k, EFS in high and low iScore patients in the Alliance AML cohort (n = 686, <60 years old; n = 185, ≥60 years old). Log-rank test was used to evaluate significance. l, EFS in high and low iScore pediatric patients (n = 336). Log-rank test was used to evaluate significance.

Comment in

References

    1. Shallis RM, Wang R, Davidoff A, Ma X & Zeidan AM Epidemiology of acute myeloid leukemia: Recent progress and enduring challenges. Blood Rev. 36, 70–87 (2019). - PubMed
    1. Baryawno N. et al. A cellular taxonomy of the bone marrow stroma in homeostasis and leukemia. Cell 177, 1915–1932 (2019). - PMC - PubMed
    1. Hanahan D & Weinberg RA Hallmarks of cancer: the next generation. Cell 144, 646–674 (2011). - PubMed
    1. Greten FR & Grivennikov SI Inflammation and cancer: triggers, mechanisms, and consequences. Immunity 51, 27–41 (2019). - PMC - PubMed
    1. Barreyro L, Chlon TM & Starczynowski DT Chronic immune response dysregulation in MDS pathogenesis. Blood 132, 1553–1560 (2018). - PMC - PubMed

Publication types