. 2023 Jan;4(1):108-127.
doi: 10.1038/s43018-022-00486-8. Epub 2022 Dec 29.

DUSP6 mediates resistance to JAK2 inhibition and drives leukemic progression

Affiliations

DUSP6 mediates resistance to JAK2 inhibition and drives leukemic progression

Tim Kong et al. Nat Cancer. 2023 Jan.

Abstract

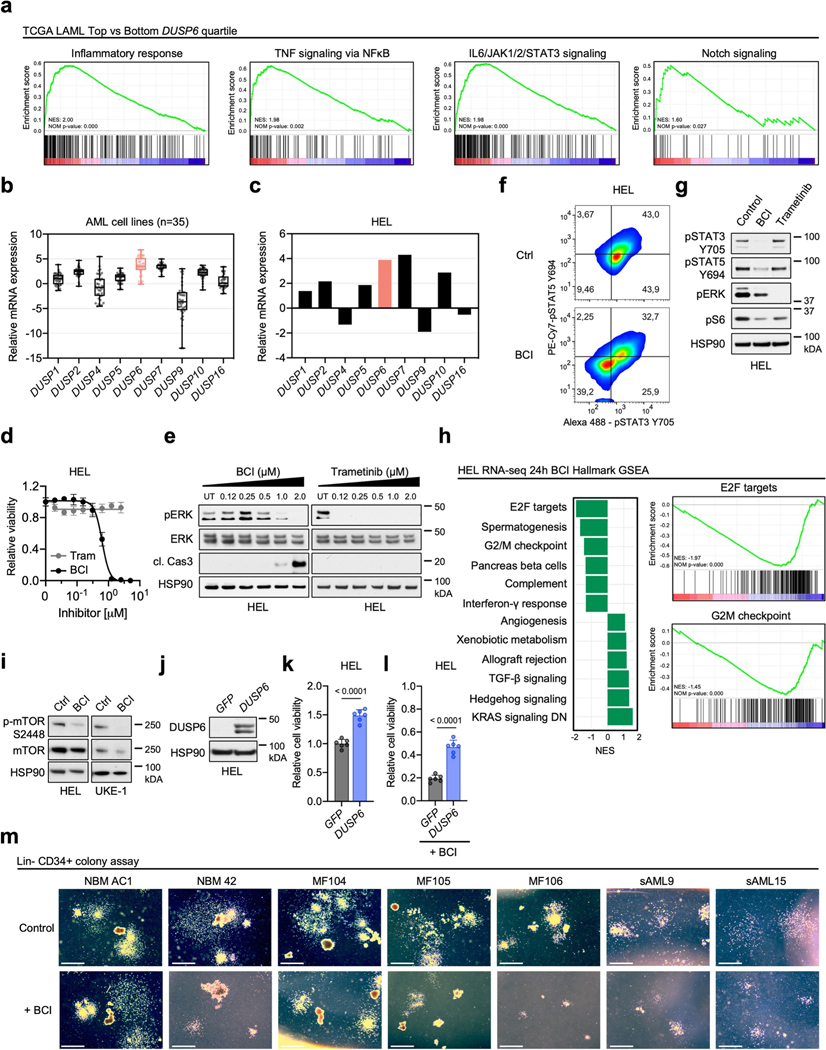
Myeloproliferative neoplasms (MPNs) exhibit a propensity for transformation to secondary acute myeloid leukemia (sAML), for which the underlying mechanisms remain poorly understood, resulting in limited treatment options and dismal clinical outcomes. Here, we performed single-cell RNA sequencing on serial MPN and sAML patient stem and progenitor cells, identifying aberrantly increased expression of DUSP6 underlying disease transformation. Pharmacologic dual-specificity phosphatase (DUSP)6 targeting led to inhibition of S6 and Janus kinase (JAK)-signal transducer and activator of transcription (STAT) signaling while also reducing inflammatory cytokine production. DUSP6 perturbation further inhibited ribosomal S6 kinase (RSK)1, which we identified as a second indispensable candidate associated with poor clinical outcome. Ectopic expression of DUSP6 mediated JAK2-inhibitor resistance and exacerbated disease severity in patient-derived xenograft (PDX) models. Contrastingly, DUSP6 inhibition potently suppressed disease development across Jak2V617F and MPLW515L MPN mouse models and sAML PDXs without inducing toxicity in healthy controls. These findings underscore DUSP6 in driving disease transformation and highlight the DUSP6-RSK1 axis as a vulnerable, druggable pathway in myeloid malignancies.


Figures

Extended Data Fig. 1 |
Extended Data Fig. 1 |. Elevated DUSP6 expression in patients with sAML compared to MPN.
a) Heatmap of top differentially expressed genes from microarray analysis in lin- CD34 + cells from sAML patients (n = 14) compared to MF patients (n = 6), and reference expression in healthy donor bone marrow (NBM; n = 5). b) DUSP6 expression from CD34 + cells from NBM (n = 31 patients), AML bone marrow CD34 + subfraction (n = 46 patients), and AML bone marrow CD34- subfraction (n = 44 patients) from GSE30029. DUSP6 values represent quartile normalized, log-transformed values. Statistics were assessed by two-tailed Student’s t test. Data are presented as mean values + /− s.d. c) Immunofluorescence of bone marrow from additional MF and sAML patients, and healthy donors. White arrows denote DUSP6-positive cell staining. IF image acquired from one section. Scale bar: 50 μM. d) Imaging mass cytometry analysis of PBMC cell pellets from normal donor peripheral blood (LRS2), MF (MF20), or sAML (sAML1) patients. Individual images show overlap of indicated channels as denoted, acquired from one section. Scale bar = 16 μM.
Extended Data Fig. 2 |
Extended Data Fig. 2 |. Serial patient CD34 + scRNA sequencing shows elevated DUSP6 along MPN to sAML progression.
a) Gene set enrichment analysis of top altered Hallmark pathways in serial CD34 + samples at the sAML stage compared to MPN stage of three patients. b) Violin plots showing relative expression of top shared differentiate expressed genes in sAML vs MPN disease states from three patients, and healthy donors (N34, N39). c) Venn diagram showing shared candidates identified in the top 1000 differentially expressed genes from two sAML stages relative to their chronic MF stage(s) with violin plots highlighting gene expression of shared transcription factors at sAML vs MF stage(s). d) ChIP tracks of key transcription factors identified from scRNA-seq showing occupancy at the Mus musculus Dusp6 locus across various tissue samples. e) Heatmap of pearson correlations between DUSP6 and top, shared candidates across five databases. *P < 0.05; **P < 0.01; ***P < 0.001; ****P < 0.0001. f) KLF2 identified as the top correlating gene, and KLF1 identified among the bottom 10 correlating genes, with DUSP6 in patient 381812 (MF and sAML) scRNA-seq.
Extended Data Fig. 3 |
Extended Data Fig. 3 |. Identification of distinct subpopulations from CD34+ scRNA-seq.
a) TotalSeq surface protein detection and mRNA features to guide distinct subpopulation identification. MEP (n = 235 cells); GMP/MKP (n = 651 cells); MLP (n = 867 cells); HSC (n = 1803 cells); CMP/ERP (n = 287 cells); ERP (n = 969 cells); ERYTHROID (n = 611 cells); GMP (n = 2352 cells); GMPgran (n = 532 cells); GMPmono (n = 507 cells); CLP (n = 420 cells). b) Schematic and relative quantification of distinct subpopulations identified from 381812. c) UMAP analysis and violin plot of DUSP6, KLF2, and KLF1 of subpopulations from N34, N39, 374024, and 145790. Additional trajectory analysis of patients 374024 and 145790 along disease progression from MPN to sAML.
Extended Data Fig. 4 |
Extended Data Fig. 4 |. Exploration of DUSP6 regulation by KLF1 and KLF2 across additional models.
a) Schematic of a separate serial CD34 + scRNA-seq dataset of a primary MF patient at multiple timepoints along transformation to sAML. As per source publication by Parental et al., sample T1 (PMF) was collected at chronic MPN phase, after which the patient was treated with ruxolitinib for 8 months at which sample T2 (treatment PMF) was collected, and then after 11 months of ruxolitinib treatment at sAML diagnosis (T3; sAML). Dataset investigated: GSE153319. b) Violin plots of DUSP6, KLF2, and KLF1 expression at different disease timepoints from Parenti et al. CD34 + scRNA-seq in (a). c) Relative fold change of DUSP6, KLF2, and KLF1 expression at sAML timepoint (T3) compared to PMF (T1) in across identified cell populations from Parenti et al. CD34 + scRNA-seq in (a). d) KLF2 (left) and KLF1 (right) expression from CD34 + cells from NBM (n = 5), MF (n = 14), and sAML (n = 6) patient samples. DUSP6 values represent RMA from microarray. Statistics were assessed by two-tailed Student’s t test. Data are presented as mean values + /− s.d. e) qRT-PCR of DUSP6 after KLF2 knockdown in HEL cells. DUSP6 mRNA expression normalized to ACTB for each group and then normalized to pLKO vector control. n = 3 independent experiments in each group. Statistics were assessed by two-tailed Student’s t test. Data are presented as mean values + /− SD. f) Immunoblot of DUSP6 expression after KLF2 knockdown in HEL cells utilizing shRNA or pLKO control vector. Immunoblot representative of 3 independent experiments. g) Cell viability assay of HEL cells after KLF2 knockdown relative to control vector. Cells were grown for 96 hours and viability was normalized to the pLKO control vector. n = 6 independently treated cell cultures pooled from two independent experiments per condition. Mean and standard deviation presented. Statistics were assessed by two-tailed Student’s t test. h) DUSP6 expression in KLF1 inducible iPSC-derived macrophages relative to control. Dataset investigated: GSE125150. i) Klf2 expression in myeloid-specific Klf2 knockout murine bone marrow derived macrophages with Mann-Whitney U comparison. Dataset investigated: GSE149119. j) Multi-Chip Significance score (S-score) of Dusp6 in Klf2 knockout murine embryonic yolk sac erythroid cells. Multi-Chip Significance score (S-score) and expression comparison p-value of Dusp6 (probe 1415834_at) between WT and Klf2−/− samples were identified. Per source publication, probe with absolute S-score values greater or equal to 2.00 were considered to be significant. Dataset investigated: GSE27602.
Extended Data Fig. 5 |
Extended Data Fig. 5 |. Functional characterization of DUSP6 in MPN/AML.
a) Enrichment plots of top upregulated Hallmark pathways in DUSP6high vs DUSP6low patients by GSEA. b) Relative mRNA expression of DUSP family genes across 35 AML cell lines from the Cancer Cell Line Encyclopedia. Boxplots represent min to max ranges with median, 25th, and 75th percentiles. c) Relative mRNA expression of DUSP family genes in HEL cells from the Cancer Cell Line Encyclopedia. d) Cell viability curves of HEL cells treated with BCI or trametinib across multiple drug doses. Cells were treated for 72 hours and viability was normalized to control. N = 6 independently treated cell cultures pooled from two independent experiments at each drug dose. Mean and standard deviation presented. e) Immunoblot of HEL cells treated with increasing doses of BCI or the MEK inhibitor trametinib. Cells were treated at their indicated drug dose for 24 hours. Immunoblot representative of two experiments. f) Phospho-STAT3 and phospho-STAT5 flow cytometry of HEL cells treated with 1 μM of BCI or control for 24 hours. n = 1 independently treated cell culture. g) Immunoblot profiling of different signaling pathways altered by BCI and trametinib. HEL cells were treated with 1 μM BCI or 1 μM trametinib for 24 hours. Immunoblot representative of 2 independent experiments. h) Hallmark gene set enrichment analysis showing top altered pathways by normalized enrichment score (NES) and enrichment plots of E2F targets and G2M checkpoint from RNA-seq of HEL cells treated with 1 μM of BCI, or DMSO control for 24 hours. i) Immunblot of HEL and UKE-1 cells treated with 1 μM BCI for 24 hours. Immunoblot representative of 3 independent experiments. j) Immunoblot of HEL cells ectopically expressing DUSP6 or GFP control vector. Immunoblot representative of 3 independent experiments. k) Cell viability assay of HEL cells ectopically expressing DUSP6 or GFP control vector. n = 6 independently treated cell cultures pooled from two independent experiments for each condition and grown for 96 hours with viability normalized to the control vector. Mean and standard deviation presented. Statistics were assessed by two-tailed Student’s t test. l) Cell viability assay of HEL cells ectopically expressing DUSP6 or GFP control vector treated with 300 nM BCI. Cells were plated at n = 6 independently treated cell cultures pooled from two independent experiments grown for 96 hours with viability from normalized to control treatment from each group. Mean and standard deviation presented. Statistics were assessed by two-tailed Student’s t test. m) Representative images of lin- CD34 + colonies grown in MethoCult H4034 Optimum for 12 days in 0.5 μM BCI or RPMI control. Samples plated in duplicate. Images acquired from one field of view representative of two plates/condition. Scale bar: 1000 μM.
Extended Data Fig. 6 |
Extended Data Fig. 6 |. Suppression of signaling and cytokine production in primary samples by BCI assessed by mass cytometry.
a) tSNE dimensional reduction clustering of distinct subpopulations from sAML4 and altered signaling upon BCI, TPO induction, or combination treatment post mass cytometry analysis. Samples were treated with 1 μM BCI for 4 hours, 20 ng/mL TPO for 1 hour, or combination. tSNE plots of sAML4 representative of plots from 2 MF, 3 sAML, and 2 normal patient samples. b) TPO-induced signaling across different subpopulations from sAML4. Patient samples were treated with 20 ng/mL TPO for 1 hour. Signals were normalized to the control treatment and reported as median Arcsinh ratio. tSNE plots of sAML4 representative of plots from 3 sAML patients. c) TPO-induced cytokine production across different subpopulations from sAML5. Patient samples were treated with 20 ng/mL TPO for 4 hour. Signals were normalized to the control treatment and reported as 90 percentile Arcsinh ratio. tSNE plots of sAML5 representative of plots from 3 sAML patients. d) Heatmap and dot plots of altered cytokine production of CD14 + monocytes from bone marrow (NBM40) and peripheral blood (NPB LRS2) of healthy donors, and PBMCs from MF and sAML patients by mass cytometry. Unique patient samples were treated with 1 μM BCI for 4 hours, 20 ng/mL TPO for 4 hour, or combination. Signals were normalized to the control treatment of each individual patient sample and reported as 90th percentile Arcsinh ratio. Basal cytokine expression in CD14 + cells from MF and sAML are also presented (left panel) and are normalized to the NBM/NPB within each individual CyTOF run to control for batch effect: run 1 - sAML4 and sAML6 normalized to NBM40; run 2 - MF20 and MF102 normalized to NPB LRS2; run 3- MF40 and sAML5 normalized to NBM40. e) Dot plot of MIP-1β/CCL4 in CD123 + and CD16 + monocyte populations from sAML5. Samples were treated with 1 μM BCI for 4 hours, 20 ng/mL TPO for 4 hours, or combination. Signals were normalized to the control treatment and reported as 90 percentile Arcsinh ratio. n = 1 independent experiment with sample sAML5.
Extended Data Fig. 7 |
Extended Data Fig. 7 |. Functional characterization of RSK1 in MPN/AML.
a) Heatmap of inhibitors of upstream regulators of S6 activity and the pearson correlation of their area under curve (AUC) with DUSP6 expression in AML cell lines. b) CRISPR dropout screen showing RPS6KA1 as an essential gene in AML. Candidates were identified if meeting criteria of FDR < 10% and whose inhibition affected # of AML lines but neither of non-AML lines. Data retrieved from Tzelepis et al. c) RPS6KA1 expression across 10,071 patient samples representing 31 distinct cancer subtypes from the TCGA Pan-Cancer cohort. Expression values provided as log2 (value +1). See additional information in methods. Boxplots represent min to max ranges with median, 25th, and 75th percentiles. d) Immunoblot analysis of RPS6KA1 knockdown by shRNA or control vector in HEL cells. Immunoblot representative of 5 independent experiments. e) Cell viability assay of HEL cells after RPS6KA1 knockdown relative to control vector. Cells were grown for 96 hours and viability was normalized to the pLKO control vector. n = 6 independently treated cell cultures pooled from two independent experiments per construct. Mean and standard deviation presented. Statistics were assessed by two-tailed Student’s t test. f) Heatmap of altered signaling pathways of lin- CD34 + cells from unique normal bone marrow donors and peripheral blood of MF patients by mass cytometry. Patient samples were treated with 5 μM BI-D1870 for 4 hours, 20 ng/mL TPO for 1 hour, or combination. Signals were normalized to the control treatment of each individual patient sample and reported as 90th percentile Arcsinh ratio. g) Ridge plot of RPS6KA1 expression from CD34 + scRNA-seq of N34, N39, and 381812 at MF and sAML stages. h) RPS6KA1 expression from CD34 + cells from NBM (n = 5), MF (n = 14), and sAML (n = 6) patient samples. RPS6KA1 values represent RMA from microarray. Statistics were assessed by two-tailed Student’s t test. i) Downregulation of HES1 expression from RNA sequencing of HEL cells treated for 4 hours with 1 μM BCI vs DMSO control. n = 2 independently treated cell cultures. j) qRT-PCR of HES1 in HEL cells treated with 1 μM BCI for 24 hours. HES1 mRNA expression normalized to ACTB. n = 3 independent experiments. Statistics were assessed by two-tailed Student’s t test. Data are presented as mean values + /− s.d. k) Immunoblot of HES1 in HEL cells after DUSP6 knockdown by shRNA or control vector. Immunoblot representative of 3 independent experiments. l) qRT-PCR of HES1 in HEL cells after DUSP6 knockdown by shRNA or control vector. HES1 mRNA expression normalized to ACTB for each group and then normalized to pLKO vector. n = 3 independent experiments. Statistics were assessed by two-tailed Student’s t test. Data are presented as mean values + /− s.d. m) Immunoblot of HEL cells after HES1 knockdown by shRNA or control vector. Immunoblot representative of 2 independent experiments. n) Cell viability curve of HEL cells after ectopic expression of RPS6KA1 or GFP control treated with increasing concentrations of BI-D1870. Cells were treated for 96 hours and viability was normalized to the control treatment from each group. n = 6 independently treated cell cultures pooled from two independent experiments per construct. Mean and standard deviation presented. o) Cell viability assay of HEL cells treated with 1 μM BI-D1870, 300 μM BCI or combination, and UKE-1 cells treated with 2 μM BI-D1870, 200 μM BCI, or combination. Cells were treated for 72 hours and viability was normalized to the control treatment. n = 6 independently treated cell cultures pooled from two independent experiments at each drug dose. Mean and standard deviation presented. p) Hallmark gene set enrichment analysis showing top altered pathways from RNA-seq of HEL cells treated for 24 hours with 10 μM BI-D1870 + 1 μM BCI compared to DMSO control (left) and 10 μM BI-D1870 + 1 μM BCI compared to 10 μM BI-D1870 alone (right). q) Dot plot of mass cytometry analysis of lin- CD34 + cells from MF103 treated with 1 μM BCI for 4 hours, 5 μM BI-D1870 for 4 hours, 20 ng/mL TPO for 1 hour, or combination. Signals of key phosphorylated proteins were normalized to the control treatment and reported as 90th percentile Arcsinh ratio.
Extended Data Fig. 8 |
Extended Data Fig. 8 |. DUSP6 mediates response to JAK2 inhibitors.
a) Correlation of DUSP6 expression and fedratinib IC50 in 18 AML cell lines. DUSP6 expression obtained from the CCLE database and fedratinib IC50 obtained from the GDSC1 collection. b) Cell viability assay of HEL parental or HEL Fed-P cells treated with BCI at the indicated doses. Cells were treated for 72 hours and viability was normalized to the control treatment from each group. n = 6 independently treated cell cultures pooled from two independent experiments at each drug dose. Mean and standard deviation presented. c) Cell viability assay of HEL cells treated with BCI, fedratinib, or combination. Cells were treated for 72 hours at the indicated drug doses and viability was normalized to the control treatment. n = 6 independently treated cell cultures pooled from two independent experiments at each drug dose. Mean and standard deviation presented.
Extended Data Fig. 9 |
Extended Data Fig. 9 |. BCI alleviates disease burden across MPN and sAML mouse models.
a) WBC subpopulation counts, platelet counts, and body weight from Jak2 transplanted mice treated with vehicle (n = 9) or BCI (n = 10) across multiple timepoints. Statistics were assessed by two-way ANOVA comparing vehicle to BCI. Data are presented as mean values + /− s.d.. b) Representative gross spleen of Jak2 mice treated with vehicle or BCI at endpoint. c) Hematocrit, white blood cell (WBC) counts and differentials, and platelets counts of wildtype primary mice treated with vehicle (n = 4) or 25 mg/kg BCI (n = 5) following weekly schedule of 5 days on, 2 days off treatment across multiple timepoints. Liver, spleen, and body weights collected at endpoint. Two-way ANOVA and two-tailed Student’s t test statistical analysis resulted in non-significant values across all comparisons between vehicle and BCI treatment. Data are presented as mean values + /− s.d. d) Representative flow cytometry analysis of peripheral blood from CD45.1 mice showing engraftment of MPL W515 GFP + CD45.2 cells. e) WBC subpopulation counts, platelet counts, and normalized spleen weight from MPL W515 MF model of transplanted mice treated with vehicle (n = 8) or BCI (n = 8) across multiple timepoints. Statistics were assessed by two-way ANOVA for white count differential comparisons between vehicle and BCI and two-tailed Student’s t test for normalized spleen weight. Data are presented as mean values + /− s.d.
Extended Data Fig. 10 |
Extended Data Fig. 10 |. Humanized PDX models of MF and sAML.
a) Percentage of myeloid cells from hCD45+ PB (left) and CD71 + CD235a + from hCD45- BM (right) from NSGS mice transplanted with CD34 + cells ectopically expressing control (n = 9 mice) and DUSP6 (n = 10 mice) at endpoint. Both statistics assessed by two-tailed non-parametric Mann-Whitney U test after testing for normality by Shapiro-Wilk test. b) DUSP6 overexpression PDX with CD34 + cells from a second MF patient (MF106). Plots show percentage of human CD45 (hCD45) in peripheral blood and bone marrow of transplanted mice ectopically expressing control (n = 5) or DUSP6 (n = 5) across multiple timepoints, and spleen and liver weights of mice at endpoint normalized by mouse weight. %hCD45 in PB statistics assessed by two-way ANOVA incorporating weeks 4–8 post transplant. %hCD45 in BM, and normalized spleen and liver weights statistics were assessed by two-tailed Student’s t test. Data are presented as mean values + /− s.d. c) Kaplan-Meier survival analysis of mice from control or DUSP6 cohorts assessed by log-rank test. d) Colony assay of CD34 + cells from sAML15 after transduction with shRNAs targeting DUSP6 or control vector. Sorted cells were grown in MethoCult H4034 Optimum for 12 days. Samples were plated in triplicate (n = 3 replicates). Statistics were assessed by Two-tailed Student’s t test. Data are presented as mean values + /− s.d. e) CD34 + healthy donor normal bone marrow (NBM) PDX model. Cells were transduced with 2 independent shRNAs targeting DUSP6 or control and transplanted into NSGS mice. Plots show percentage of human CD45 (hCD45) in peripheral blood and bone marrow of transplanted mice treated ectopically expressing control (n = 5), shDUSP6 #1 (n = 5), or shDUSP6 #2 (n = 5) across multiple timepoints, and spleen and liver weights of mice at endpoint normalized by mouse weight. %hCD45 in PB statistics assessed by two-way ANOVA with Dunnett’s multiple comparisons test with control. %hCD45 in BM, and normalized spleen and liver weights statistics were assessed by two-tailed Student’s t test with Dunnett’s multiple comparisons test with control. f) Normalized spleen and liver weights from mice at end-point from sAML14 CD34 + PDX. Mice were treated with vehicle (n = 7), 25 mg/kg BCI (n = 8), 90 mg/kg ruxolitinib (n = 7), or combination (n = 7). Data are presented as mean values + /− s.d. g) tSNE dimensional reduction clustering of mouse and human CD45 + cells from bone marrow of sAML14 PDX mice. h) sAML PDX14 mass cytometry analysis showing percentage of CD123 + CD33 + leukemic cells gated from hCD45+ cells from 3 mice in each treatment group. Statistics were assessed by one-way ANOVA with Dunnett’s multiple comparison test. i) Erythroblast progenitors gated from hCD45+ cells. Statistics were assessed by one-way ANOVA with Dunnett’s multiple comparison test. j) SPADE tree cluster algorithm showing CD123 + and CD71 + populations from vehicle and BCI treated groups. k) UMAP clustering showing CD123 + and CD71 + populations. l) Schematic of the CD34 + healthy donor PDX model. CD34 + cells were isolated from BMMCs from normal donors, pooled, and transplanted into NSGS mice. Mice were treated with vehicle (n = 6), 25 mg/kg BCI (n = 6), 90 mg/kg ruxolitinib (n = 6), or combination (n = 6) following weekly schedule of 5 days on, 2 days off treatment starting on day 38. m) Plots show % hCD45 in peripheral blood and bone marrow of transplanted mice treated with vehicle or BCI across multiple timepoints and spleen weights of mice at endpoint normalized by mouse weight %hCD45 in PB statistics were assessed by two-way ANOVA comparing vehicle vs each individual treatment group with Dunnett’s multiple comparison test. %hCD45 in BM, and spleen and liver weights statistics were assessed by one-way ANOVA with Dunnett’s multiple comparison test. Data are presented as mean values + /− s.d.
Fig. 1 |
Fig. 1 |. Elevated DUSP6 expression in patients with sAML compared to those with MPN.
a, GSEA of top hallmark pathways enriched and diminished in linCD34+ cells from sAML patient samples (n = 6) compared to MF samples (n = 14) from microarray analysis. IFN, interferon. b, Volcano plot showing top elevated candidates in linCD34+ cells from patients with sAML compared to MF from limma microarray analysis. Dashed vertical lines denote boundaries of genes having at least one log2 (fold change). The dashed horizontal line denotes the P value at 0.05 (−log10 (P) = 1.3). c, DUSP6 expression from CD34+ cells isolated from NBM (n = 5), MF (n = 14) and sAML (n = 6) patient samples. DUSP6 values represent robust multi-array average (RMA) values from the microarray. Statistics were assessed by two-tailed Student’s t-test. Data are presented as mean values ± s.d. d, DUSP6 expression from healthy, individual BM mononuclear cells (NBM MNCs, n = 19 samples), prior-MPN sAML MNCs (n = 24 samples), prior-myelodysplastic syndrome (MDS) sAML MNCs (n = 45 samples) and de novo AML MNCs (n = 375 samples) from the OHSU BeatAML cohort. DUSP6 values represent normalized reads per kilobase of transcript, per million mapped reads. Statistics were assessed by two-tailed Student’s t-test. Data are presented as mean values ± s.d. e, Immunofluorescence of BM from healthy (NBM) donors, patients with MF and patients with sAML. White arrows denote DUSP6-positive cell staining. Immunofluorescence images acquired are representative of one field from each unique patient tissue section. Scale bar, 50 μM. DAPI, 4′,6-diamidino-2-phenylindole.
Fig. 2 |
Fig. 2 |. Serial patient CD34+ scRNA-seq reveals elevated DUSP6 expression along the MPN to sAML progression.
a, Schematic of scRNA-seq with TotalSeqA protein detection of 34,898 sorted CD34+ cells of serial samples from three patients progressing from MPN to sAML and two healthy BM donors (N34, N39) after quality-control filtering. Timeline shows disease stage and time (months) at which the sample was collected relative to early or first MPN stage. b, UMAP clustering of CD34+ cells from patients with chronic MPN and sAML and healthy donors. Sample 145780, early MF (n = 4,944 cells); 145780, late MF (n = 2,694 cells); 145790, sAML (n = 4,281 cells); 374024, PV (n = 1,532 cells); 374024, sAML (n = 3,361 cells); 381812, MF (n = 4,329 cells); 381812, sAML (n = 4,905 cells); N34 (n = 5,049 cells); N39 (n = 3,803 cells). c, Venn diagram showing overlapping genes from the top 1,000 DEGs in serial CD34+ samples at the sAML stage compared to the MPN stage of three patients (381812 (sAML) versus 381812 (chronic MF), 145790 (sAML) versus 145790 (early and late MF), 374024 (sAML) versus 374024 (chronic PV)). d, Violin plot showing elevated DUSP6 expression at the sAML stage compared to the prior-MPN stage. BM from two healthy donors (N34, N39) are included as a reference. e, UMAP analysis of MF and sAML disease states (top) and identified cell populations (bottom) in patient 381812. ERP, erythroid progenitor; CMP, common myeloid progenitor; MEP, megakaryocyte/erythroid progenitor; GMP, granulocyte/monocyte progenitor; MLP, multipotent lymphoid progenitor; CLP, common lymphoid progenitor; MKP, megakaryocyte progenitor. f, Violin plots of DUSP6, KLF1 and KLF2 across identified subpopulations in patient 381812. g, Trajectory analysis showing differentially expressed effector-encoding genes DUSP6, KLF1 and KLF2 at identified branch points in MF and sAML disease states (top) and identified cell populations (bottom) from patient 381812. Mega, megakaryocyte. h, Pseudotime analysis of dynamic DUSP6, KLF1 and KLF2 expression across disease progression from MF to sAML in patient 381812.
Fig. 3 |
Fig. 3 |. DUSP6 inhibition suppresses signaling from driver pathways and proliferation in MPN and AML.
a, Heatmap of the top 50 DEGs of the top (n = 43) and bottom (n = 43) quartiles of acute myeloid leukemia (LAML) TCGA patients stratified by DUSP6 expression. b, Hallmark GSEA comparing stratified patients from a. NES, normalized enrichment score. c, Immunoblot profiling in HEL cells treated with increasing doses of BCI for 24 h. The immunoblot is representative of at least three experiments. HSP90, heat shock protein 90. d, Cell cycle assay of HEL cells treated with 1 μM BCI or control for 12 h. Cells were treated in triplicate (n = 3 independent experiments). e, Annexin V assay of HEL cells treated with 1 μM BCI or control for 48 h and 72 h. Cells were treated in triplicate (n = 3 independent experiments). f, Hallmark GSEA of top altered pathways from RNA-seq data of HEL cells treated with 1 μM BCI or dimethyl sulfoxide (DMSO) for 4 h and 24 h. n = 2 independently treated cell cultures. g, Immunoblot upon knockdown of DUSP6 with two shRNA species or the pLKO control vector. The immunoblot is representative of at least three experiments. h, Cell viability assay upon knockdown of DUSP6. Cells were plated at n = 6 for each condition and grown for 96 h with viability normalized to the control. Mean and s.d. are presented. Statistics were assessed by two-tailed Student’s t-test. i, Cell viability assay of healthy donor BM (NBM BM mononuclear cells (BMMCs); n = 5) and PBMCs from patients with MPN (n = 8) and patients with sAML (n = 11). All primary cells were from unique patients and were treated for 72 h with 150 nM BCI. Statistics were assessed by two-tailed Student’s t-test. Data are presented as mean values ± s.d. j, Cleaved caspase-3 (cl. cas 3) signal from CD34+ cells by CyTOF. Unique sAML PBMCs (n = 7 patient samples) and NBM BMMCs (n = 3 patient samples) were treated for 4 h with 1 μM BCI. Arcsinh ratios indicate relative change in the BCI-treated condition compared to the control. Statistics were assessed by two-tailed Mann–Whitney U-test. Data are presented as mean values ± s.d. k, Colony assay of linCD34+ cells (n = 3 unique patients for each group). Cells were grown for 12 d in 0.5 μM BCI or an RPMI control and plated in duplicate. Statistics were assessed by two-tailed Student’s t-test. Data are presented as mean values ± s.d. l, Heatmap and dot plots of altered signaling pathways of linCD34+ cells from two unique NBM BMMCs, two PBMCs from patients with MF and three patients with sAML, assayed by CyTOF. Patient samples were treated with 1 μM BCI for 4 h, 20 ng ml−1 TPO for 1 h or the combination. Signals were normalized to those from the control treatment of each individual sample and were reported as a 90th-percentile arcsinh ratio. BTK, Bruton’s tyrosine kinase; CREB, cAMP-response element-binding protein; MAPKAPK2, MAPK-activated protein kinase 2; TBK1, TANK-binding kinase 1.
Fig. 4 |
Fig. 4 |. DUSP6 regulates S6 signaling through indispensable RSK1.
a, Relative RPS6KA1 expression across 804 pan-cancer cell lines from the CCLE (Source data). Box plots represent minimum to maximum ranges with the median and 25th and 75th percentiles. b, Gene dependency score for RPS6KA1 CRISPR knockout across 804 pan-cancer cell lines from DepMap (Source data). Box plots represent minimum to maximum ranges with the median and 25th and 75th percentiles. KO, knockout. c, Kaplan–Meier event-free survival curve of patients stratified by RPS6KA1 expression from the TCGA LAML cohort (n = 173). d, Kaplan–Meier overall survival curve of patients from c. e, HEL and UKE-1 cells were treated with increasing concentrations of BI-D1870 for 72 h, and viability was normalized to the control treatment. n = 6 independently treated cell cultures at each dose. Mean and s.d. are presented. f, Immunoblot of HEL and UKE-1 cells treated with BI-D1870 for 24 h. The immunoblot is representative of at least three experiments. g, Cell cycle assay of HEL cells treated with 5 μM BI-D1870 (BI-D) or control for 12 h and 24 h. Cells were treated in triplicate (n = 3 independent experiments). Data are presented as mean values ± s.d. h, Annexin V apoptosis assay of HEL cells treated with 5 μM BI-D1870 for 48 h and 72 h (n = 3 independent experiments). Data are presented as mean values ± s.d. i, GSEA showing top altered pathways from the Kyoto Encyclopedia of Genes and Genomes (KEGG) signaling and metabolism gene set from RNA-seq of HEL cells treated with 10 μM BI-D1870 or control for 24 h. n = 2 independently treated cell cultures. ECM, extracellular matrix; NK, natural killer. j, Top 50 DEGs from the KEGG PI3K–AKT signaling pathway of RNA-seq from HEL cells treated with 10 μM BI-D1870 for 24 h versus control treatment. k, Dot plots of linCD34+ cells from one unique NBM donor and PB of two patients with MF by CyTOF. Samples were treated with 5 μM BI-D1870 for 4 h, 20 ng ml−1 TPO for 1 h or the combination. Signals were normalized to the control treatment of each individual sample and reported as a 90th-percentile arcsinh ratio. l, Colony assays of linCD34+ cells from one unique NBM donor, two patients with MF and one patient with sAML. Cells were grown for 12 d in 1.5 μM BI-D1870 or an RPMI control and plated in duplicate. m, Pearson correlation of DUSP6 and RPS6KA1 expression from linCD34+ cells from MF (n = 14) and sAML (n = 6) patient samples. Expression values represent RMA from the microarray. n, Immunoblot of cells treated with 1 μM BCI for 24 h. The immunoblot is representative of at least three experiments. o, Immunoblot after knockdown with two shDUSP6 species or a non-targeting pLKO control. The immunoblot is representative of at least three experiments.
Fig. 5 |
Fig. 5 |. DUSP6 inhibition overcomes persistence to JAK inhibitors.
a, Parental HEL, Rux-P and Fed-P cells were treated with ruxolitinib and fedratinib for 72 h, and viability was normalized to that of the control. n = 6 independently treated cell cultures were pooled from two independent experiments. Mean and s.d. are presented. b, DUSP6 mRNA fold change in persistent cells relative to parental cells from RNA-seq analysis. c, Upregulation of ‘DUSP6 target genes up’ from RNA-seq data. d, HEL parental cells were treated with fedratinib (Fed) and ruxolitinib (Rux) after ectopic expression of DUSP6 or a control vector. Cells were treated with 0.625 μM JAK2 inhibitors for 96 h, and viability was normalized to that of the control group from each population. n = 6 independently treated cell cultures were pooled from two independent experiments. e, Immunoblot of HEL cells ectopically expressing DUSP6 or the GFP control. Cells were treated with control, 1 μM BCI or 1 μM fedratinib for 24 h. The immunoblot is representative of two experiments. f, HEL cells were treated with fedratinib after two shRNA species targeting DUSP6 or control. n = 6 independent cell cultures pooled from two independent experiements at each drug dose. Cells were treated for 96 h and viability was normalized to the control treatment group from each population. g, HEL cells were treated with ruxolitinib after two shRNA species targeting DUSP6 or a control as described in f. n = 5 (control, shDUSP6 1) and n = 6 (shDUSP6 2) independent cell cultures were pooled from two independent experiments at each drug dose. h, CyTOF of HEL parental and Fed-P cells. Expression is denoted as median dual counts. n = 1 independent experiment. i, CyTOF of Fed-P cells treated with 1 μM BCI and/or 1 μM fedratinib for 1 h; signals were normalized to the control treatment and reported as a median arcsinh ratio. n = 1 independent experiment. SHP2, Src homology region 2-containing protein tyrosine phosphatase 2. j, Schematic of disease progression of patient 973039. k, Sorted cells from patient 973039 and NBM40 were grown for 14 d in the presence of inhibitors and plated in triplicate: fedratinib panel, 1 μM fedratinib; BCI panel, 0.5 μM BCI; t2 panel, 1 μM fedratinib, 1 μM BCI and 1 μM fedratinib + 1 μM BCI. Statistics were assessed by two-tailed Student’s t-test. Data are presented as mean values ± s.d. l, CyTOF of linCD34+ cells from t2 and NBM40. Cells were treated with 1 μM BCI for 1 h, 20 ng ml TPO for 15 min or a combination. n = 1 independent experiment.
Fig. 6 |
Fig. 6 |. BCI is efficacious in MPN mouse models.
a, Schematic of the Jak2 mouse model. c-KIT+ cells from CD45.2+ C57BL/6J mice were isolated and transplanted into CD45.1+ C57BL/6J mice. Mice were treated with vehicle (n = 9) or 25 mg per kg BCI (n = 10) daily for 5 d followed by 2 d off treatment starting on day 17. b, Efficacy of BCI in the Jak2 mouse model. Plots show hematocrit and WBC counts of transplanted mice treated with vehicle or BCI across multiple timepoints and spleen and liver weights at the endpoint. Hematocrit and WBC count statistics were assessed by two-way ANOVA comparing vehicle and BCI treatments. Spleen and liver weight statistics were assessed by two-tailed Student’s t-test. Data are presented as mean values ± s.d. c, Schematic of the MPL mouse model. Retroviral MPL was transduced into c-KIT+ cells from CD45.2+ C57BL/6J mice and transplanted into CD45.1+ C57BL/6J mice. Mice were treated with vehicle (n = 8) or 25 mg per kg BCI (n = 8) daily for 5 d followed by 2 d off treatment starting on day 17. d, Efficacy of BCI in the MPL mouse model. Plots show hematocrit, WBC and platelet counts of transplanted MPL mice treated with vehicle or BCI across multiple timepoints. WBC and platelet count statistics were assessed by two-way ANOVA comparing vehicle and BCI. Data are presented as mean values ± s.d. e, Kaplan–Meier survival analysis of transplanted mice treated with vehicle or BCI assessed by log-rank test. f, Images show representative H&E and reticulin staining of BM of tibias from vehicle- and BCI-treated MPL mice at the endpoint. Images are representative of sections from three mice per group. Scale bar, 50 μM.
Fig. 7 |
Fig. 7 |. DUSP6 modulates disease progression and severity in vivo.
a, Schematic of the CD34+ MF105 PDX mouse model. DUSP6 or the control vector were ectopically expressed in isolated CD34+ cells, after which transformed cells were transplanted into NSGS mice. b, Plots show percentages of hCD45+ cells in PB and BM of transplanted mice ectopically expressing the control vector (n = 9) or DUSP6 (n = 10) across multiple timepoints and spleen and liver weights of mice at the endpoint normalized by mouse weight. Percentages of hCD45+ cells in PB were assessed by two-way ANOVA. Percentages of hCD45+ cells in BM and normalized spleen and liver weight statistics were assessed by two-tailed Student’s t-test. Data are presented as mean values ± s.d. c, Kaplan–Meier survival analysis of mice from control or DUSP6 cohorts assessed by log-rank test. d, Schematic of the CD34+ sAML15 PDX mouse model. Cells were transduced with two independent shRNA species targeting DUSP6 or a control and transplanted into NSGS mice. e, Plots show percentages of hCD45+ cells in PB and BM of transplanted mice ectopically expressing control (n = 6), shDUSP6 1 (n = 7) or shDUSP6 2 (n = 7) across multiple timepoints and spleen and liver weights of mice at the endpoint normalized by mouse weight. Percentages of hCD45+ cells in PB were assessed by two-way ANOVA with Dunnett’s multiple-comparisons test with the control. Percentages of hCD45+ cells in BM and normalized spleen and liver weight statistics were assessed by two-tailed Student’s t-test with Dunnett’s multiple-comparisons test with the control. Data are presented as mean values ± s.d.
Fig. 8 |
Fig. 8 |. BCI alleviates disease burden across sAML PDX models.
a, Schematic of the CD34+ sAML PDX mouse models. CD34+ cells were isolated from patients sAML11 and sAML14 and transplanted into NSGS mice. For the sAML11 PDX, mice were treated with vehicle (n = 6) or 25 mg per kg BCI (n = 7) daily for 5 d followed by 2 d off treatment starting on day 24. For the sAML14 PDX, mice were treated with vehicle (n = 7), 25 mg per kg BCI (n = 8), 90 mg per kg ruxolitinib (n = 7) or the combination (n = 7) following a weekly schedule of 5 d on treatment and 2 d off treatment starting on day 31. b, Efficacy of BCI in the sAML11 PDX model. Plots show percentage of hCD45+ cells in PB and BM of transplanted mice treated with vehicle or BCI across multiple timepoints and spleen and liver weights of mice at the endpoint normalized by mouse weight. Percentages of hCD45+ cells in PB were assessed by two-way ANOVA comparing vehicle to BCI. Percentages of hCD45+ cells in BM and normalized spleen and liver weight statistics were assessed by two-tailed Student’s t-test. Data are presented as mean values ± s.d. c, Efficacy of treatment in the sAML14 PDX model. Plots show percentages of hCD45+ cells in PB and BM of transplanted mice treated with vehicle, BCI, ruxolitinib or the combination across multiple timepoints. Percentages of hCD45+ cells in PB were assessed by two-way ANOVA comparing vehicle versus each individual treatment group with Dunnett’s multiple-comparison test and by two-way ANOVA for ruxolitinib versus the combination. Percentages of hCD45+ cells in BM were assessed by one-way ANOVA with Dunnett’s multiple-comparison test. Right, mass cytometry of cells isolated from the BM of three sAML14 PDX mice from each treatment group at the endpoint. Heatmap denotes row z score calculated from the mean signal intensity of each marker. Data are presented as mean values ± s.d. mCD45, mouse CD45.

References

    1. Levine RL & Gilliland DG Myeloproliferative disorders. Blood 112, 2190–2198 (2008). - PMC - PubMed
    1. Oh ST & Gotlib J. JAK2 V617F and beyond: role of genetics and aberrant signaling in the pathogenesis of myeloproliferative neoplasms. Expert Rev. Hematol 3, 323–337 (2010). - PubMed
    1. Zoi K. & Cross NC Genomics of myeloproliferative neoplasms. J. Clin. Oncol 35, 947–954 (2017). - PubMed
    1. Tefferi A. Myelofibrosis with myeloid metaplasia. N. Engl. J. Med 342, 1255–1265 (2000). - PubMed
    1. Harrison C. et al. JAK inhibition with ruxolitinib versus best available therapy for myelofibrosis. N. Engl. J. Med 366, 787–798 (2012). - PubMed

Publication types

MeSH terms