. 2023 Jan;9(1):157-168.
doi: 10.1038/s41477-022-01306-8. Epub 2022 Dec 29.

Plant-specific features of respiratory supercomplex I + III2 from Vigna radiata

Affiliations

Plant-specific features of respiratory supercomplex I + III2 from Vigna radiata

M Maldonado et al. Nat Plants. 2023 Jan.

Erratum in

Abstract

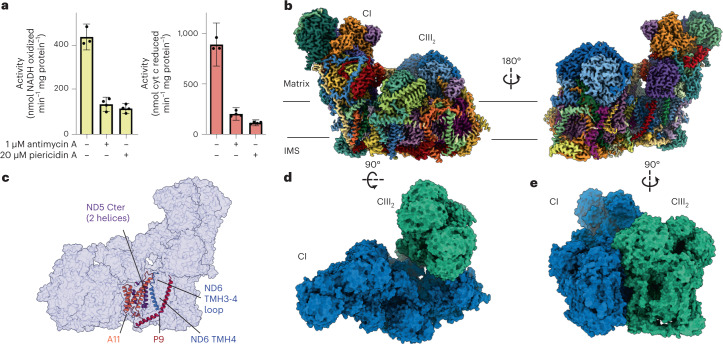
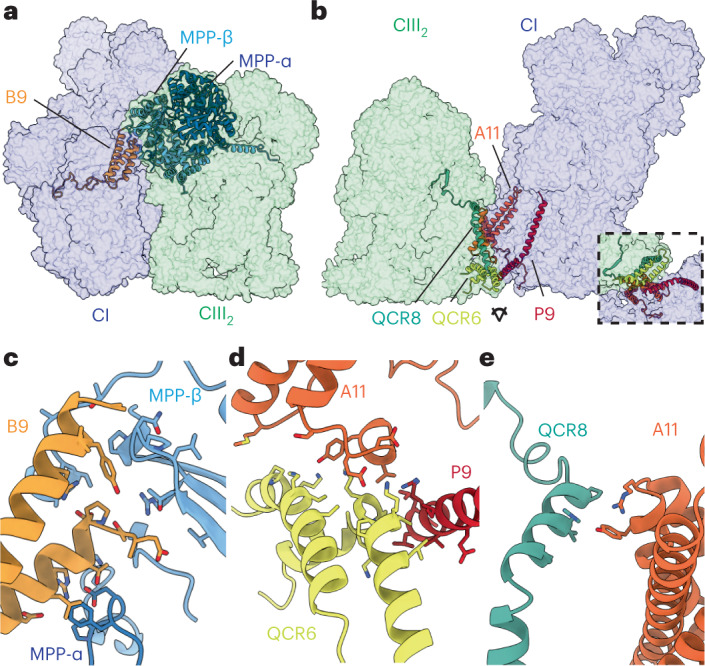
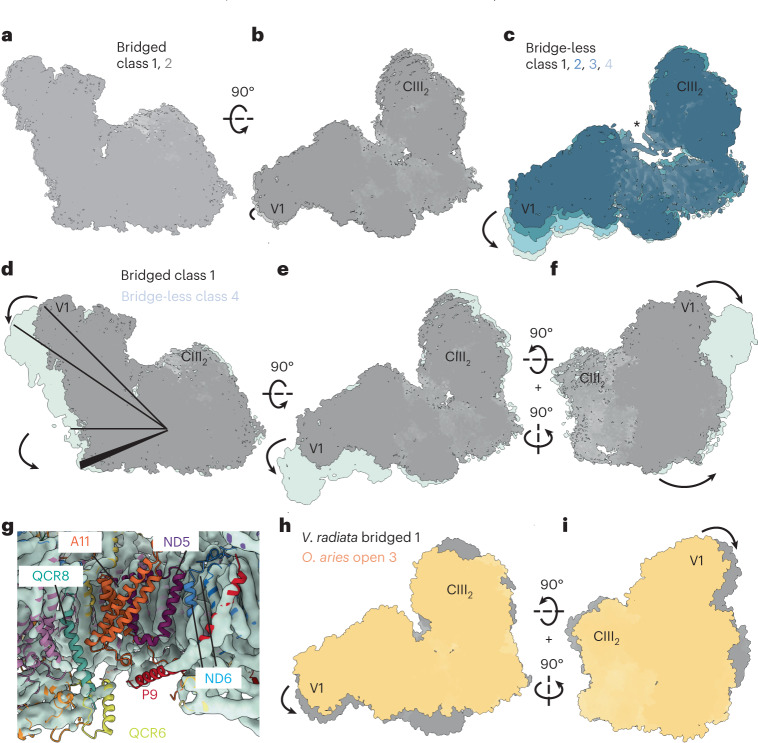
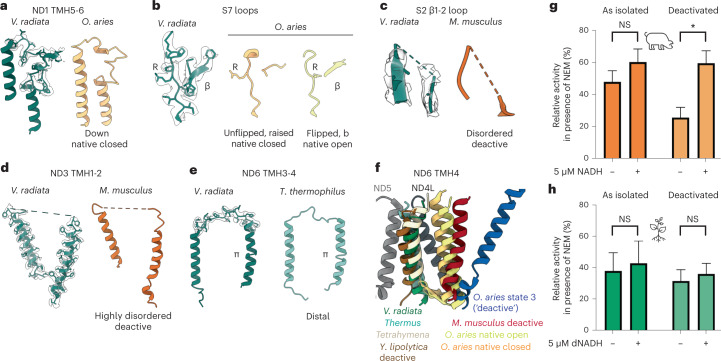
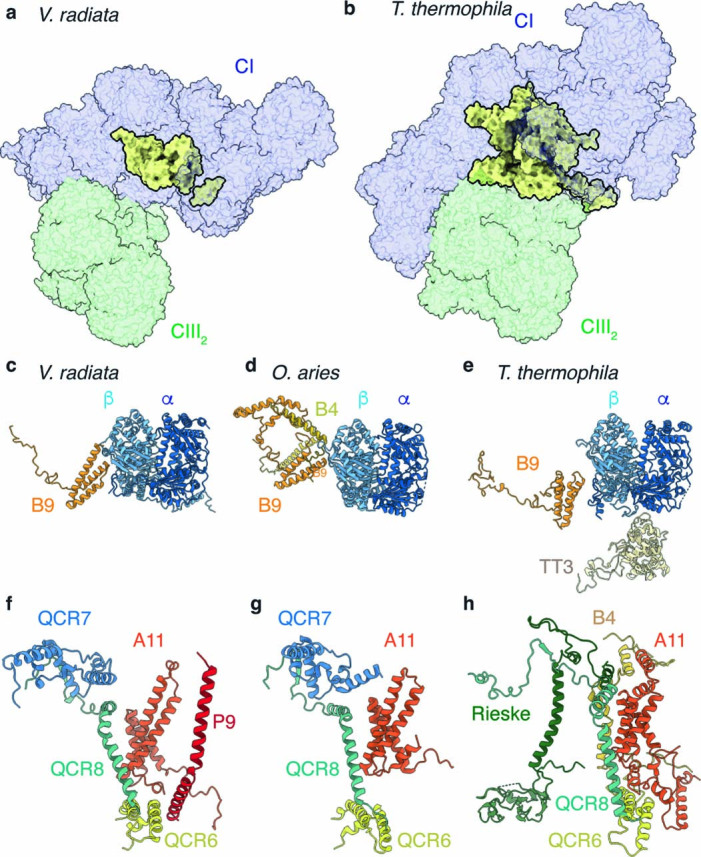
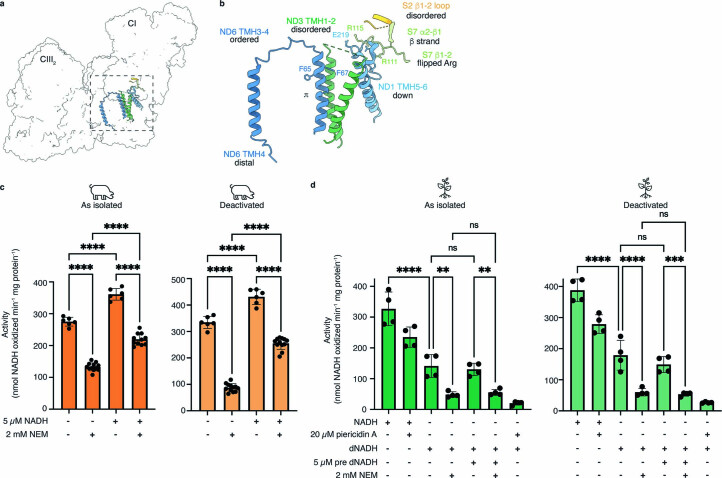
The last steps of cellular respiration-an essential metabolic process in plants-are carried out by mitochondrial oxidative phosphorylation. This process involves a chain of multi-subunit membrane protein complexes (complexes I-V) that form higher-order assemblies called supercomplexes. Although supercomplexes are the most physiologically relevant form of the oxidative phosphorylation complexes, their functions and structures remain mostly unknown. Here we present the cryogenic electron microscopy structure of the supercomplex I + III2 from Vigna radiata (mung bean). The structure contains the full subunit complement of complex I, including a newly assigned, plant-specific subunit. It also shows differences in the mitochondrial processing peptidase domain of complex III2 relative to a previously determined supercomplex with complex IV. The supercomplex interface, while reminiscent of that in other organisms, is plant specific, with a major interface involving complex III2's mitochondrial processing peptidase domain and no participation of complex I's bridge domain. The complex I structure suggests that the bridge domain sets the angle between the enzyme's two arms, limiting large-scale conformational changes. Moreover, complex I's catalytic loops and its response in active-to-deactive assays suggest that, in V. radiata, the resting complex adopts a non-canonical state and can sample deactive- or open-like conformations even in the presence of substrate. This study widens our understanding of the possible conformations and behaviour of complex I and supercomplex I + III2. Further studies of complex I and its supercomplexes in diverse organisms are needed to determine the universal and clade-specific mechanisms of respiration.


Conflict of interest statement

The authors declare no competing interests.

Figures

Fig. 1
Fig. 1. Structure of V. radiata’s SC I + III2.
a, NADH-cyt c oxidoreductase activity of amphipol-stabilized isolated SC I + III2 in the absence or presence of CI or CIII2 inhibitors (20 μM piericidin A and 1 μM antimycin A, respectively). Values are averages of three or four independent measurements from a single purified sample of SC I + III2; error bars display the coefficient of variance calculated as the sum of the coefficients of variation of each experimentally determined value (path length, extinction coefficient and activity) multiplied by the average. b, CryoEM density map of SC I + III2 coloured by subunit. The approximate locations of the mitochondrial matrix and intermembrane space (IMS) are shown with black lines. c, Atomic model improvement versus previously available structures of plant CI. Improved or new subunits shown in coloured cartoons over CI semi-transparent surface. Cter, C-terminus. d,e, SC I + III2 shown from the matrix (d) or the plane of the membrane (e). Complex I (CI) in blue surface, complex III2 (CIII2) in green surface.
Fig. 2
Fig. 2. SC I + III2 interfaces in V. radiata.
a,b, V. radiata SC I + III2 matrix (a), membrane and intermembrane space (IMS) interfaces (b). Interacting subunits shown as coloured cartoons over semi-transparent complex I (CI) surface (blue) or complex III2 surface (green). Inset in b shows interface viewed from the IMS. ce, V. radiata interaction details for matrix (c), IMS (d) and membrane (e) interfaces. Subunits shown as coloured cartoons with key residues as sticks coloured by atom. Some structural elements are hidden for clarity.
Fig. 3
Fig. 3. Large-scale conformational changes of complex I within V. radiata SC I + III2.
ac, Bridged (a,b) and bridge-less classes of SC I + III2 viewed from the side (a) or the matrix (b,c). Bridge class 1 in grey, class 2 in lighter grey. Bridge-less class 1 through class 4 in progressively lighter shades of blue. The asterisk indicates the presence of NDUA11 in bridge-less class 1. df, Differences between bridged and bridge-less classes of SC I + III2 viewed from the side (d), matrix (e) or the back of CI from the plane of the membrane (f). Bridged SC I + III2 class 1 shown in grey aligned with bridge-less class 4 in light blue. Rotations are indicated with respect to d. The opening of the peripheral arm and the straightening of the membrane arm are represented with lines and arrows. g, CI and CIII2 subunits and fragments that are lost in the bridge-less class 4 shown in coloured cartoons over light-blue surface of class 4 map. h,i, Comparison of V. radiata bridge class 1 (grey) and the most open SC I + III2 class from O. aries (PDB: 6QC4) (ref. 12) (light orange) viewed from the matrix (h) or the back (i). The positions of complex III2 (CIII2) and CI’s subunit NDUFV1 (V1) are shown for orientation.
Fig. 4
Fig. 4. Conformational state of complex I’s catalytic loops.
ae, Species comparison of CI’s loops associated with catalysis, showing the V. radiata model and associated density (green cartoon, transparent map) (left) and the model for the structure it most resembles, coloured by structure (right). a, Nad1 TMH5-6 loop; O. aries native closed (light orange), PDB: 6ZKO. b, NDUFS7 α1-2 loop (left) and α2-β1 loop (right). Key arginine residue (R) and β-strand are marked; O. aries native closed class with ‘unflipped’ arginine in β1-2 loop, β-strand for the α2-β1 loop (light orange, left), PDB: 6ZKO and O. aries native open with flipped arginine and β-strand (yellow, right), PDB: 6ZKP. c, NDUFS2 β1-2 loop; M. musculus deactive (dark orange), PDB: 6G72 (ref. 25). d, Nad3 TMH1-2 loop; M. musculus deactive (dark orange), PDB: 6G72 (ref. 25). e, Nad6 TMH3-4 loop; Thermus thermophilus native (light teal), PDB: 4HEA. f, Position of Nad6 TMH4 across organisms and conditions. Structures aligned by Nad6. The V. radiata Nad5 TMH16 and Nad4L TMH1 shown for orientation (grey cartoon). Structure: V. radiata (green, this study), T. thermophilus native (light teal, PDB: 4HEA), Tetrahymena thermophila native (cream, PDB: 7TGH), Yarrowia lipolytica deactive (brown, PDB: 7O71 (ref. 18)), O. aries native closed (light orange, PDB: 6ZKO), O. aries native open (yellow, PDB: 6ZKP), M. musculus deactive (red, PDB: 6G72 (ref. 25)), O. aries ‘deactive’ (blue, PDB: 6KZS). g,h, A/D transition in S. scrofa (g) and V. radiata (h) mitochondrial membranes. Membranes were treated with 2 mM NEM as isolated (orange, green) or after thermal deactivation (light orange, light green), in the presence or absence of pre-activation with 5 μM NADH (S. scrofa) or 5 μM dNADH (V. radiata). Values are the percentage of average activities (NEM/no NEM) determined from four to ten independent measurements on single samples of isolated S. scrofa or V. radiata mitochondrial membranes shown in Extended Data Fig. 7. Error bars equal the coefficient of variation for the ratio calculated as the sum of the coefficient of variation of the individual rates multiplied by the value of the ratio. Statistical significance of the difference between the ratios was determined using a two tailed z-test. *P < 0.05 (P = 0.02 for deactivated S. scrofa). NS, not statistically significant (P > 0.05).
Extended Data Fig. 1
Extended Data Fig. 1. Biochemical purification of V. radiata SC I + III2.
(a) Purification table detailing protein concentration (mg/ml), total activity (μmol/min), specific activity (μmol/(min*mg) and recovery (%, normalized to extracted protein) for each main purification step. (b) Complex I (CI) in-gel activity assay of fractions detailed in (a) using blue-native PAGE. Purple bands indicate CI activity. (c-d) Sucrose gradient fractionation of post-concentration fraction (7 in panel a) after ultracentrifugation. (c) Sucrose gradient chromatogram (blue line, absorbance at 280 nm) and total activity (μmol/min) (green triangles, determined with spectroscopic ferricyanide assay) for each sucrose-gradient fraction. Dashed box indicates pooled fractions for size exclusion column (SEC). (d) CI in-gel activity assay of selected fractions from (c). (e-f) SEC purification of fractions pooled from (c-d). (e) Chromatogram at 280 nm and 420 nm. (f) CI in-gel activity assay of fractions collected from (e). Fractions corresponding to SC I + III2 marked with dashed box. C, post-SEC concentrated sample; L, load. These results are representative of 26 SC I + III2 preparations. Source data
Extended Data Fig. 2
Extended Data Fig. 2. Micrograph and initial processing.
(a) Representative micrograph of 21,815 collected. Scale bar is 100 nm. (b) Representative 2D classes of SC I + III2 particles. (c) Initial 3D classification and refinement pipeline. Fourier shell correlation (FSC) curves for the individual class refinements are shown for no (orange), loose (green) and tight (blue) masking. The resolution at which the tight masked FSC crosses the 0.143 gold-standard limit (dashed line) is indicated.
Extended Data Fig. 3
Extended Data Fig. 3. Focused refinements for SC I + III2 bridged class 1.
Individual masked refinements using the masks shown in magenta were performed to improve the map quality. Fourier shell correlation (FSC) curves for the individual focused refinements are shown for no (orange), loose (green) and tight (blue) masking. The resolution at which the tight mask FSC crosses the 0.143 gold-standard limit (dashed line) is indicated. The focused maps highlighted with green boxes were combined into the final composite map of the bridged SC I + III2 (top left).
Extended Data Fig. 4
Extended Data Fig. 4. Density for the CI subunits or subunit fragments that were improved in this atomic model compared to previous structures of plant CI.
Subunits shown in coloured cartoons over semi-transparent density in grey.
Extended Data Fig. 5
Extended Data Fig. 5. MPP-α isoform in V. radiata SC I + III2.
(a) Sequence alignment of MPP-α isoforms annotated in V. radiata proteome. Isoform modelled into SC I + III2 (LOC106765382) in blue, Isoform modelled into SC III2 + IV (corresponding to LOC106774328) in gray. Transparent brown box, signal sequence. Transparent orange box, interface residues with CI’s NDUB9. Residues that differ marked in red font. Transparent yellow box, gly-rich loop involved in MPP substrate recognition. (b) Key regions of map-to-model fit of the MPP-α subunits modelled for SC I + III2 and SC III2 + IV, fit into the SC I + III2 map. LOC106765382 (SC I + III2) in blue, LOC106774328 (SC III2 + IV) in gray. (c) MPP-α interface with CI’s NDUB9. Protein corresponding to LOC106765382 (SC I + III2) in blue and LOC106774328 (SC III2 + IV) in gray. (d-e) MPP-β catalytic triad in protomer proximal to CI (d) and distal to CI (e). Note the lack of density for a putative Zn2+.
Extended Data Fig. 6
Extended Data Fig. 6. Inter-species comparison of SC I + III2.
(a-b) Comparison of ferredoxin bridge (yellow surface) in V. radiata (a) and T. thermophila (b) (PDB 7TGH,). Supercomplexes aligned by CIII2. CI and CIII2 coloured as in (a). (c-h) Inter-species comparison of SC I + III2 interfaces in V. radiata (c,f), O. aries (d,g PDB 6QC5,) and T. thermophila (e,h). The main interacting subunits are shown in cartoon. (c-e) Matrix interfaces involving MPP-α (α) and MPP-β (β), aligned by MPP-β. (f-h) Membrane and inter-membrane space interfaces, aligned by NDUA11. Note that V. radiata QCR7 is shown for comparison but does not participate in the interface.
Extended Data Fig. 7
Extended Data Fig. 7. Further detail on V. radiata CI loops and active-to-deactive (A/D) transition.
(a-b) Summary of CI loop conformations. (a) Key loops, helices and β-strands discussed in text shown in coloured cartoon over SC I + III2 transparent surface. The inset (dashed square) is shown in detail in (b). Configuration of each loop, as well as key residues and features are marked. (c-d) Activity rates for the A/D transition in porcine (S. scrofa, pig symbol) (c) and V. radiata (plant symbol) membranes (d). Activity in the presence or absence of 2 mM NEM, 20 μM piericidin A, pre-activation with 5 μM NADH or 5 μM dNADH, and thermal deactivation is shown for 4-12 repeats. Data are shown as individual values and mean ± standard deviation. Statistical analysis with one-way ANOVA with Šídák’s multiple comparisons test. **, p < 0.01; ****, p < 0.0001. Data is representative of two fully characterized (NADH and dNADH) V. radiata mitochondrial membrane isolations.

Comment in

  • Super-complex supercomplex.
    Møller IM. Møller IM. Nat Plants. 2023 Jan;9(1):5-6. doi: 10.1038/s41477-022-01329-1. Nat Plants. 2023. PMID: 36639556 No abstract available.

References

    1. Nicholls, D. G. & Ferguson, S. J. Bioenergetics 4th edn (Academic Press, 2013).
    1. Fernandez-Vizarra E, Ugalde C. Cooperative assembly of the mitochondrial respiratory chain. Trends Biochem. Sci. 2022;47:999–1008. doi: 10.1016/j.tibs.2022.07.005. - DOI - PubMed
    1. Meyer EH, Letts JA, Maldonado M. Structural insights into the assembly and the function of the plant oxidative phosphorylation system. N. Phytol. 2022;235:1315–1329. doi: 10.1111/nph.18259. - DOI - PubMed
    1. Letts JA, Sazanov LA. Clarifying the supercomplex: the higher-order organization of the mitochondrial electron transport chain. Nat. Struct. Mol. Biol. 2017;24:800–808. doi: 10.1038/nsmb.3460. - DOI - PubMed
    1. Brzezinski P, Moe A, Adelroth P. Structure and mechanism of respiratory III–IV supercomplexes in bioenergetic membranes. Chem. Rev. 2021;121:9644–9673. doi: 10.1021/acs.chemrev.1c00140. - DOI - PMC - PubMed

Publication types

MeSH terms

Substances