Development of diagnostic algorithm using machine learning for distinguishing between active tuberculosis and latent tuberculosis infection
- PMID: 36581808
- PMCID: PMC9798640
- DOI: 10.1186/s12879-022-07954-7
Development of diagnostic algorithm using machine learning for distinguishing between active tuberculosis and latent tuberculosis infection
Abstract
Background: The discrimination between active tuberculosis (ATB) and latent tuberculosis infection (LTBI) remains challenging. The present study aims to investigate the value of diagnostic models established by machine learning based on multiple laboratory data for distinguishing Mycobacterium tuberculosis (Mtb) infection status.
Methods: T-SPOT, lymphocyte characteristic detection, and routine laboratory tests were performed on participants. Diagnostic models were built according to various algorithms.
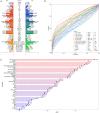
Results: A total of 892 participants (468 ATB and 424 LTBI) and another 263 participants (125 ATB and 138 LTBI), were respectively enrolled at Tongji Hospital (discovery cohort) and Sino-French New City Hospital (validation cohort). Receiver operating characteristic (ROC) curve analysis showed that the value of individual indicator for differentiating ATB from LTBI was limited (area under the ROC curve (AUC) < 0.8). A total of 28 models were successfully established using machine learning. Among them, the AUCs of 25 models were more than 0.9 in test set. It was found that conditional random forests (cforest) model, based on the implementation of the random forest and bagging ensemble algorithms utilizing conditional inference trees as base learners, presented best discriminative power in segregating ATB from LTBI. Specially, cforest model presented an AUC of 0.978, with the sensitivity of 93.39% and the specificity of 91.18%. Mtb-specific response represented by early secreted antigenic target 6 (ESAT-6) and culture filtrate protein 10 (CFP-10) spot-forming cell (SFC) in T-SPOT assay, as well as global adaptive immunity assessed by CD4 cell IFN-γ secretion, CD8 cell IFN-γ secretion, and CD4 cell number, were found to contribute greatly to the cforest model. Superior performance obtained in the discovery cohort was further confirmed in the validation cohort. The sensitivity and specificity of cforest model in validation set were 92.80% and 89.86%, respectively.
Conclusions: Cforest model developed upon machine learning could serve as a valuable and prospective tool for identifying Mtb infection status. The present study provided a novel and viable idea for realizing the clinical diagnostic application of the combination of machine learning and laboratory findings.
Keywords: Active tuberculosis; Diagnostic algorithm; Discrimination; Latent tuberculosis infection; Machine learning.
© 2022. The Author(s).
Conflict of interest statement
The authors declare that they have no competing interests.
Figures


Similar articles
-
From immunology to artificial intelligence: revolutionizing latent tuberculosis infection diagnosis with machine learning.Mil Med Res. 2023 Nov 28;10(1):58. doi: 10.1186/s40779-023-00490-8. Mil Med Res. 2023. PMID: 38017571 Free PMC article. Review.
-
Combination of Blood Routine Examination and T-SPOT.TB Assay for Distinguishing Between Active Tuberculosis and Latent Tuberculosis Infection.Front Cell Infect Microbiol. 2021 Jun 29;11:575650. doi: 10.3389/fcimb.2021.575650. eCollection 2021. Front Cell Infect Microbiol. 2021. PMID: 34277462 Free PMC article.
-
Combination of HLA-DR on Mycobacterium tuberculosis-Specific Cells and Tuberculosis Antigen/Phytohemagglutinin Ratio for Discriminating Active Tuberculosis From Latent Tuberculosis Infection.Front Immunol. 2021 Nov 11;12:761209. doi: 10.3389/fimmu.2021.761209. eCollection 2021. Front Immunol. 2021. PMID: 34858413 Free PMC article.
-
Activation Phenotype of Mycobacterium tuberculosis-Specific CD4+ T Cells Promoting the Discrimination Between Active Tuberculosis and Latent Tuberculosis Infection.Front Immunol. 2021 Aug 26;12:721013. doi: 10.3389/fimmu.2021.721013. eCollection 2021. Front Immunol. 2021. PMID: 34512645 Free PMC article.
-
[Evolution of IGRA researches].Kekkaku. 2008 Sep;83(9):641-52. Kekkaku. 2008. PMID: 18979999 Review. Japanese.
Cited by
-
From immunology to artificial intelligence: revolutionizing latent tuberculosis infection diagnosis with machine learning.Mil Med Res. 2023 Nov 28;10(1):58. doi: 10.1186/s40779-023-00490-8. Mil Med Res. 2023. PMID: 38017571 Free PMC article. Review.
-
Using an Artificial Intelligence Approach to Predict the Adverse Effects and Prognosis of Tuberculosis.Diagnostics (Basel). 2023 Mar 13;13(6):1075. doi: 10.3390/diagnostics13061075. Diagnostics (Basel). 2023. PMID: 36980382 Free PMC article.
-
Artificial intelligence for tuberculosis control: a scoping review of applications in public health.J Glob Health. 2025 Jul 25;15:04192. doi: 10.7189/jogh.15.04192. J Glob Health. 2025. PMID: 40709592 Free PMC article.
-
Diagnostic performance of biomarkers for differentiating active tuberculosis from latent tuberculosis: a systematic review and Bayesian network meta-analysis.Front Microbiol. 2024 Dec 20;15:1506127. doi: 10.3389/fmicb.2024.1506127. eCollection 2024. Front Microbiol. 2024. PMID: 39760075 Free PMC article.
-
The role of ESAT-6 in tuberculosis immunopathology.Front Immunol. 2024 Apr 3;15:1383098. doi: 10.3389/fimmu.2024.1383098. eCollection 2024. Front Immunol. 2024. PMID: 38633252 Free PMC article. Review.
References
-
- World Health Organization: Global tuberculosis report 2022. https://www.appswhoint/iris/rest/bitstreams/1474924/retrieve 2022, 27 Oct 2022. Geneva, Switzerland.
-
- Luo Y, Suliman S, Asgari S, Amariuta T, Baglaenko Y, Martinez-Bonet M, Ishigaki K, Gutierrez-Arcelus M, Calderon R, Lecca L, et al. Early progression to active tuberculosis is a highly heritable trait driven by 3q23 in Peruvians. Nat Commun. 2019;10(1):3765. doi: 10.1038/s41467-019-11664-1. - DOI - PMC - PubMed
-
- World Health Organization: The end TB strategy. https://www.appswhoint/iris/rest/bitstreams/1271371/retrieve 2015, 16 Aug 2015. Geneva, Switzerland.
-
- World Health Organization: A Global Strategy for tuberculosis research and innovation. https://www.appswhoint/iris/rest/bitstreams/1312195/retrieve 2020, 19 Oct 2020. Geneva, Switzerland.
MeSH terms
Substances
Grants and funding
LinkOut - more resources
Full Text Sources
Medical
Research Materials
Miscellaneous

