. 2022 Dec 29;22(1):421.
doi: 10.1186/s12935-022-02818-1.

Targeting hyaluronic acid synthase-3 (HAS3) for the treatment of advanced renal cell carcinoma

Affiliations

Targeting hyaluronic acid synthase-3 (HAS3) for the treatment of advanced renal cell carcinoma

Jiaojiao Wang et al. Cancer Cell Int. .

Abstract

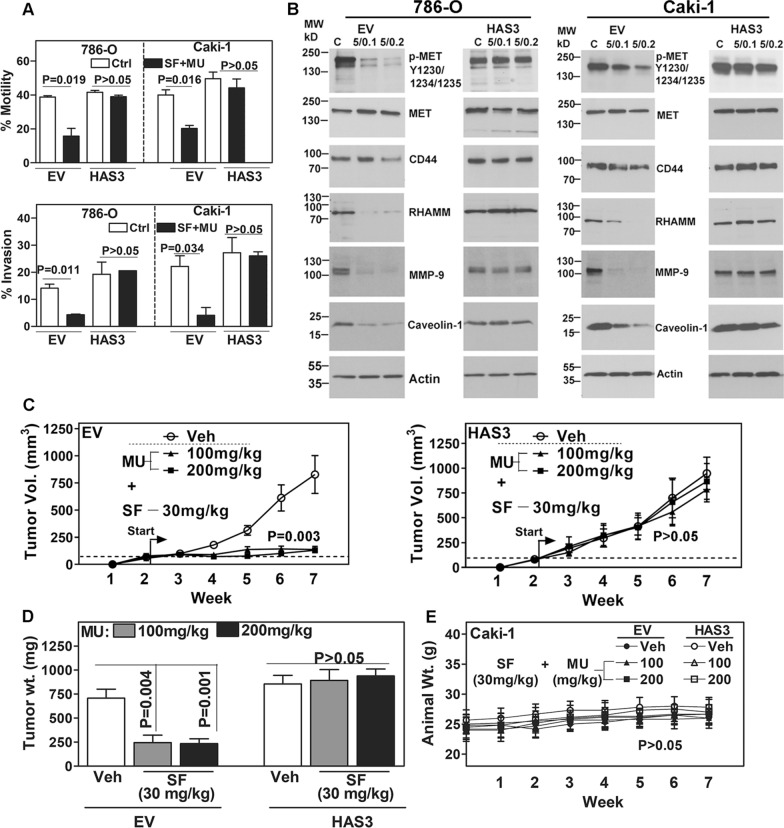
Background: Hyaluronic acid (HA) promotes cancer metastasis; however, the currently approved treatments do not target HA. Metastatic renal carcinoma (mRCC) is an incurable disease. Sorafenib (SF) is a modestly effective antiangiogenic drug for mRCC. Although only endothelial cells express known SF targets, SF is cytotoxic to RCC cells at concentrations higher than the pharmacological-dose (5-µM). Using patient cohorts, mRCC models, and SF combination with 4-methylumbelliferone (MU), we discovered an SF target in RCC cells and targeted it for treatment.

Methods: We analyzed HA-synthase (HAS1, HAS2, HAS3) expression in RCC cells and clinical (n = 129), TCGA-KIRC (n = 542), and TCGA-KIRP (n = 291) cohorts. We evaluated the efficacy of SF and SF plus MU combination in RCC cells, HAS3-transfectants, endothelial-RCC co-cultures, and xenografts.

Results: RCC cells showed increased HAS3 expression. In the clinical and TCGA-KIRC/TCGA-KIRP cohorts, higher HAS3 levels predicted metastasis and shorter survival. At > 10-µM dose, SF inhibited HAS3/HA-synthesis and RCC cell growth. However, at ≤ 5-µM dose SF in combination with MU inhibited HAS3/HA synthesis, growth of RCC cells and endothelial-RCC co-cultures, and induced apoptosis. The combination inhibited motility/invasion and an HA-signaling-related invasive-signature. We previously showed that MU inhibits SF inactivation in RCC cells. While HAS3-knockdown transfectants were sensitive to SF, ectopic-HAS3-expression induced resistance to the combination. In RCC models, the combination inhibited tumor growth and metastasis with little toxicity; however, ectopic-HAS3-expressing tumors were resistant.

Conclusion: HAS3 is the first known target of SF in RCC cells. In combination with MU (human equivalent-dose, 0.6-1.1-g/day), SF targets HAS3 and effectively abrogates mRCC.

Keywords: 4-methylumbelliferone; HAS3; Hyaluronic acid; Molecular targeting; Renal cell carcinoma; Sorafenib.


Conflict of interest statement

The authors declare no conflict of interest.

Figures

Fig. 1
Fig. 1
HA-synthase transcript levels and the effect of SF on HAS3 expression in RCC cells. A, B: HA-synthase transcript (A) and HAS3 protein (B) expression in HK-2 and RCC cells (786-O, Caki-1, 769-P). CF: RCC cells treated with SF for 48 h were analyzed for HAS3 transcript levels (C, D) or HAS3 protein expression (E, F) by RT-qPCR and immunoblotting, respectively. Panels A, C and D: HAS3 transcript levels were normalized to β-actin. The images are cropped for brevity. Uncropped images of the blots shown in panels B, E, and F are provided in the Additional file 1 (Appendix). Data: Mean ± SD (n = 3 or 4). Panel B, E, F: actin as the loading control
Fig. 2
Fig. 2
Measurement of HAS3 levels in normal and RCC tissues and their association with the clinical outcome. A, B: HAS3 transcript levels were measured in normal kidney (NK) and RCC tissues and normalized to TBP transcript levels. A: Data were stratified for NK, oncocytoma, clear cell (cc) and non-cc RCC (papillary, chromophobe, collecting duct, sarcomatoid) tissues. B: transcript data for RCC tissues were stratified based on the development of metastasis during follow-up. C, D: HAS3 protein expression (C) and HA levels in NK and RCC tissues based on the patients’ metastasis status during follow-up. Loading control: Actin. The images are cropped for brevity. Uncropped images of the blots shown in panel C are provided in the Additional file 1 (Appendix). Data: Mean ± SD (D). EG: Stratification of the cohorts for metastasis (clinical; panel E) and OS (TCGA-KIRC, TCGA-KIRP; panels F, G) based on HAS3 mRNA levels. P values based on the log-rank test
Fig. 3
Fig. 3
Effect of SF plus MU combination on HAS3 expression and HA levels in RCC cells. AF: RCC cells were treated with SF, MU or their combination for 48 h and analyzed for HAS3 transcript levels (A, B), and protein expression (C, D). HAS3 transcript levels were normalized to β-actin. Data: Mean ± SD (n = 3). C, D: actin as the loading control. The images are cropped for brevity. Uncropped images of the blots shown in panels C and D are provided in the Additional file 1 (Appendix). Cell CM were assayed for HA levels by HA test and normalized to cell number (E, F). Note: Data shown are for the EV transfectants of 786-O and Caki-1. HA levels in the HAS3 transfectants are shown in Fig. 4
Fig. 4
Fig. 4
Ectopic HAS3 expression attenuates the effect of SF and MU combination on RCC cell growth. A: Expression of Flag-tagged HAS3 protein in RCC cells. B, C: HAS3 protein expression in RCC cell transfectants following treatment with SF and MU combination for 48–60 h. The images are cropped for brevity. Uncropped images of the blots shown in panels A–C are provided in the Additional file 1 (Appendix). D, E: Measurement of HA levels in HAS3 transfectants’ CM using the HA test. FI: As indicated, RCC cells were treated with SF, MU, or the combination. Viable cells were counted at 72 h. Dose-responsive curves generated by variable slope equation and actual data points are shown. Data in panels FI: Mean ± SD (n = 6 to 8)
Fig. 5
Fig. 5
Clonogenic survival and proliferation of HAS3 and HAS3 knockdown transfectants treated with the combination. A: Clonogenic survival of Caki-1 EV and HAS3 transfectants following treatment (as indicated). Crystal violet staining (left panel) and quantification (right panel) of the colonies stained on day 7. B: HAS3 protein expression in HAS3 shRNA transfectants of RCC cells. Actin is the loading control. The images are cropped for brevity. Uncropped images of the blots shown in panel B are provided in the Additional file 1 (Appendix) C, D: Control and HAS3 shRNA transfectants of RCC cells were treated with SF and viable cells were counted after 72 h. 5E: Viability of endothelial cells (HMEC-1, HULEC-5a) exposed to SF + MU in the presence or absence of HA was measured by MTT assay was performed at 72 h. Percent viability was calculated from untreated control (100%). Data in panels A and C–E: Mean ± SD (n = 3 to 8)
Fig. 6
Fig. 6
Cell-cycle and apoptosis analyses of RCC cell transfectants treated with the combination. AF: Transfectants (EV, HAS3) were treated with SF and MU combination, as indicated. Treated cells were analyzed for cell cycle progression and cell-cycle phase markers (A, B, E, and F) and for apoptosis and related markers (CF). Data in A–D: Mean ± SD (n = 3). Please note that for brevity and clarity p values are shown for those pairs where the difference is statistically significant. In panels E and F actin is the loading control. The images are cropped for brevity. Uncropped images of the blots shown in panels E and F are provided in the Additional file 1 (Appendix)
Fig. 7
Fig. 7
Analyses of anti-invasive and anti-tumor activities of SF and MU combination in EV and HAS3 transfectants. A: RCC cell transfectants treated with the combination were analyzed for chemotactic motility (at 18 h; top panel) and for invasive activity (at 48 h; bottom panel), respectively. Data: Mean ± SD (n = 3). B: The transfectants were also analyzed for markers associated with RCC invasion/metastasis; actin serves as the loading control (B). The images are cropped for brevity. Uncropped images of the blots shown in panel B are provided in the Additional file 1 (Appendix). CE: In an athymic xenograft model, Caki-1 tumors (EV and HAS3) were established. Starting at two-weeks, mice were treated with vehicle or SF and MU combination, until week seven; six mice per group; 2 males and 4 females. Tumor volume and animal weight were measured weekly (C, E) and tumor weight was measured at endpoint (D). Data in panels C–E: Mean ± SEM
Fig. 8
Fig. 8
Analysis Caki-1 subcutaneous tumors. A: Caki-1 subcutaneous tumor histology images. Tumor photos were taken at necropsy. For these photos, tumor volume and weight data are shown in 7C and D. Three photos per group are shown. Caki-1 tumors in the vehicle (both EV and HAS3 tumors) and combination (HAS3 tumors only) show invasion into muscle and the fat layers. IHC shows HAS3, HA and Ki67 (proliferation) expression, microvessels (CD31 staining), and apoptosis indicator, cleaved caspase 3 staining; magnification: 400X. B, C: Microvessels and Ki67 positive nuclei were counted at 400X magnification to determine microvessel density (MVD) and proliferation index (Ki67 positive nuclei/high power field (HPF)), respectively. Data: Mean ± SD; n = 10. D: Extracts of two randomly chosen Caki-1 subcutaneous tumors from each treatment group were analyzed for indicated proteins; actin is the loading control. The images are cropped for brevity. Uncropped images of the blots shown in panel D are provided in the Additional file 1 (Appendix)
Fig. 9
Fig. 9
Effect of the combination on orthotopic kidney tumor growth and metastasis and a schematic model of the mechanism of SF and MU combination for mRCC. A, B: Orthotopic kidney tumors were established in athymic mice (n = 5; males) from Caki-1 (EV, HAS3) transfectants. From day nine, animals were treated with vehicle or SF (30 mg/kg) and MU (200 mg/kg) combination, until visible metastasis in the vehicle group of EV cells and in HAS3 groups (both vehicle and treatment). Tumor development as monitored by bioluminescence imaging. C: Tissue histology to evaluate kidney tumors, metastasis, and organ toxicity (treatment group). In mRCC, D: Schematic models: Tumor cells express high levels of both HAS3 and UGT-1A9. Elevated HAS3 expression drives RCC growth and metastasis. By downregulating HAS3 expression, SF can potentially halt mRCC. However, elevated UGT-1A9 levels inactivate SF, and therefore, at pharmacological dose, SF is ineffective against mRCC. Low dose MU downregulates UGT-1A9 and prevents the inactivation of SF by RCC cells. Therefore, SF + MU combination shows high efficacy in inhibiting/eliminating RCC growth and metastasis in preclinical models

References

    1. Hsieh JJ, Purdue MP, Signoretti S, Swanton C, Albiges L, Schmidinger M, Heng DY, Larkin J, Ficarra V. Renal cell carcinoma. Nat Rev Dis Primers. 2017;3:17009. doi: 10.1038/nrdp.2017.9. - DOI - PMC - PubMed
    1. Cimadamore A, Calio A, Marandino L, Marletta S, Franzese C, Schips L, Amparore D, Bertolo R, Muselaers S, Erdem S, et al. Hot topics in renal cancer pathology: implications for clinical management. Expert Rev Anticancer Ther. 2017;22:1275–1287. doi: 10.1080/14737140.2022.2145952. - DOI - PubMed
    1. Escudier B, Porta C, Schmidinger M, Rioux-Leclercq N, Bex A, Khoo V, Grunwald V, Gillessen S, Horwich A. Renal cell carcinoma: ESMO clinical practice guidelines for diagnosis, treatment and follow-updagger. Ann Oncol. 2019;30:706–720. doi: 10.1093/annonc/mdz056. - DOI - PubMed
    1. Ljungberg B, Albiges L, Abu-Ghanem Y, Bensalah K, Dabestani S, Fernandez-Pello S, Giles RH, Hofmann F, Hora M, Kuczyk MA, et al. European association of urology guidelines on renal cell carcinoma: the 2019 update. Eur Urol. 2019;75:799–810. doi: 10.1016/j.eururo.2019.02.011. - DOI - PubMed
    1. Abu-Ghanem Y, Fernandez-Pello S, Bex A, Ljungberg B, Albiges L, Dabestani S, Giles RH, Hofmann F, Hora M, Kuczyk MA, et al. Limitations of available studies prevent reliable comparison between tumour ablation and partial nephrectomy for patients with localised renal masses: a systematic review from the European association of urology renal cell cancer guideline panel. Eur Urol Oncol. 2020;3:433–452. doi: 10.1016/j.euo.2020.02.001. - DOI - PubMed