. 2022 Dec 29;24(1):100.
doi: 10.1186/s13058-022-01593-1.

Towards resolution of the intron retention paradox in breast cancer

Affiliations

Towards resolution of the intron retention paradox in breast cancer

Jaynish S Shah et al. Breast Cancer Res. .

Abstract

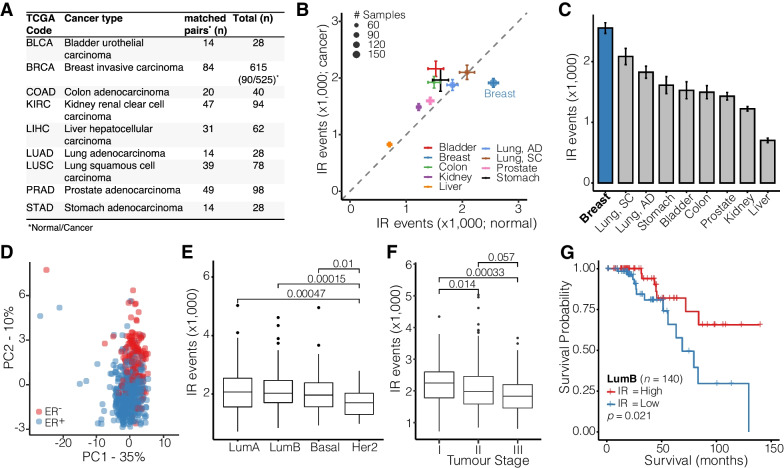
Background: After many years of neglect in the field of alternative splicing, the importance of intron retention (IR) in cancer has come into focus following landmark discoveries of aberrant IR patterns in cancer. Many solid and liquid tumours are associated with drastic increases in IR, and such patterns have been pursued as both biomarkers and therapeutic targets. Paradoxically, breast cancer (BrCa) is the only tumour type in which IR is reduced compared to adjacent normal breast tissue.

Methods: In this study, we have conducted a pan-cancer analysis of IR with emphasis on BrCa and its subtypes. We explored mechanisms that could cause aberrant and pathological IR and clarified why normal breast tissue has unusually high IR.

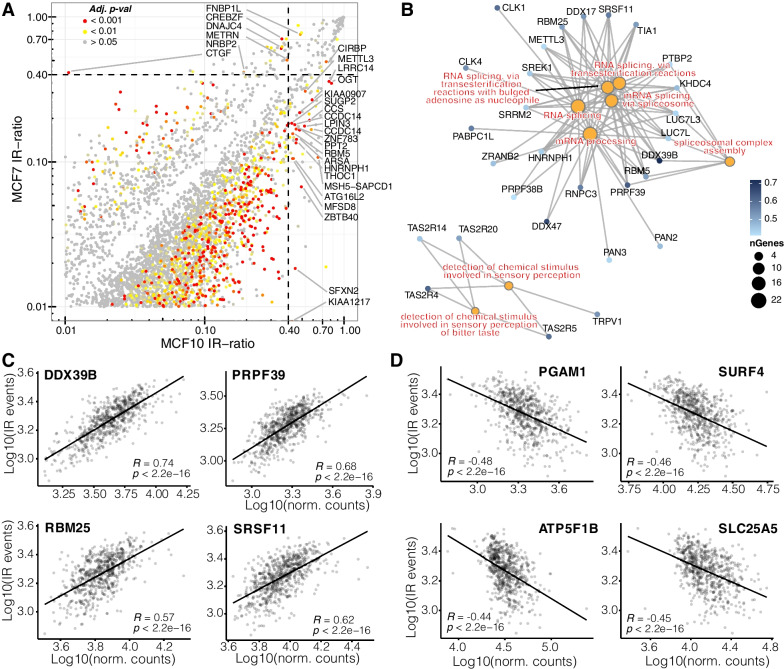
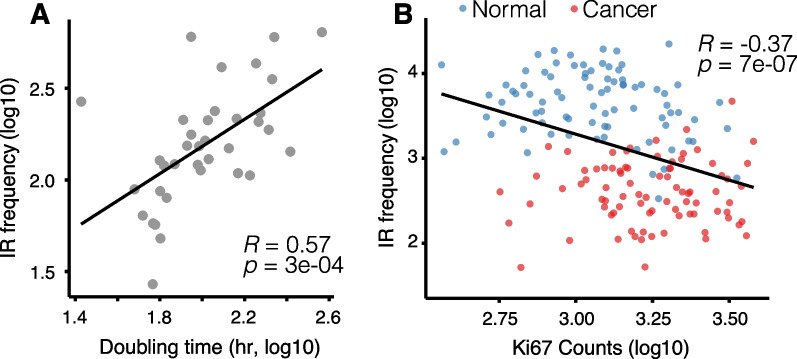
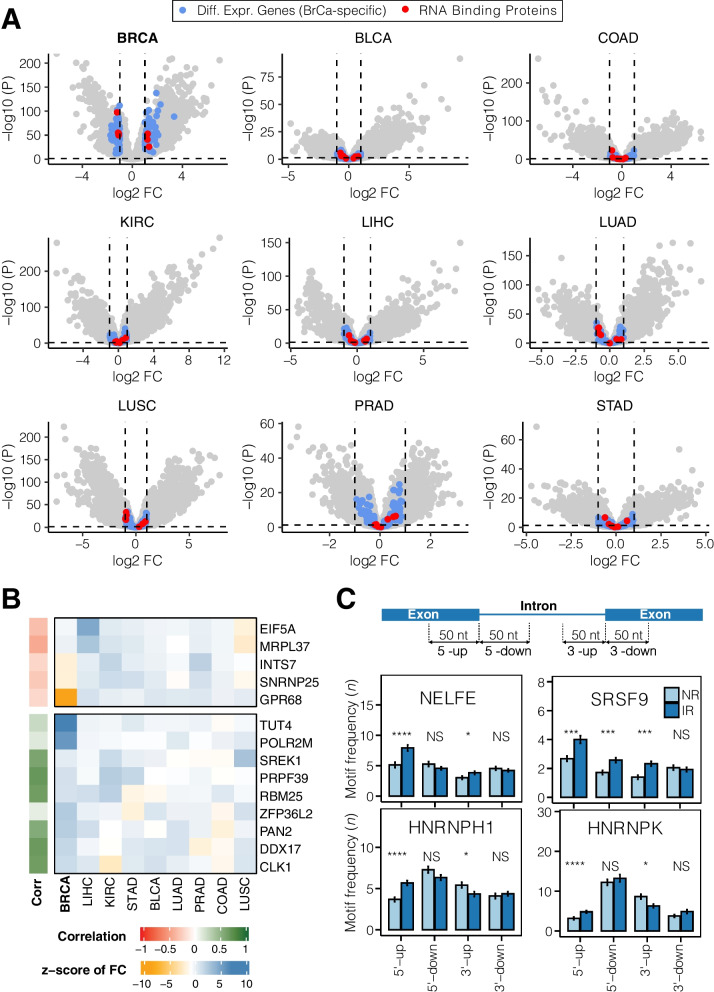
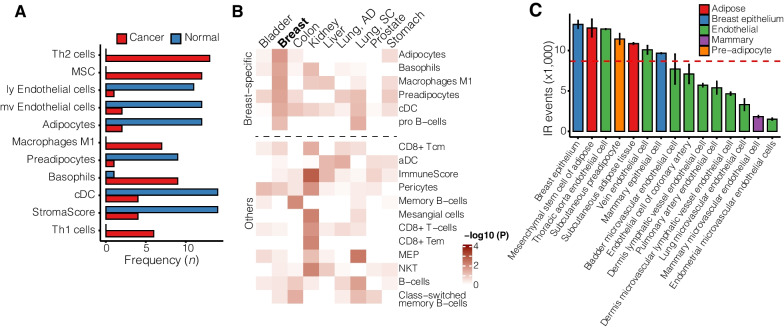
Results: Strikingly, we found that aberrantly decreasing IR in BrCa can be largely attributed to normal breast tissue having the highest occurrence of IR events compared to other healthy tissues. Our analyses suggest that low numbers of IR events in breast tumours are associated with poor prognosis, particularly in the luminal B subtype. Interestingly, we found that IR frequencies negatively correlate with cell proliferation in BrCa cells, i.e. rapidly dividing tumour cells have the lowest number of IR events. Aberrant RNA-binding protein expression and changes in tissue composition are among the causes of aberrantly decreasing IR in BrCa.

Conclusions: Our results suggest that IR should be considered for therapeutic manipulation in BrCa patients with aberrantly low IR levels and that further work is needed to understand the cause and impact of high IR in other tumour types.

Keywords: Adipocytes; Alternative splicing; Cancer transcriptomics; Luminal B breast cancer; Patient stratification.


Conflict of interest statement

J.E.J.R. has received honoraria or speaker fees (GSK, Miltenyi, Takeda, Gilead, Pfizer, Spark, Novartis, Celgene, bluebird bio); Director of Pathology (Genea); equity ownership (Genea, Rarecyte); consultant (Rarecyte, Imago); and chair, Gene Technology Technical Advisory, OGTR, Australian Government. The remaining authors declare no competing financial interests.

Figures

Fig. 1
Fig. 1
Breast cancer intron retention in the TCGA cohort. A Overview of TCGA samples analysed. B Scatter plot illustrating the average number of IR events in cancers vs adjacent normal tissues. Error bars indicate standard deviations. The size of the dots is proportional to the number of samples analysed. C Bar plot showing the average number of IR events in normal tissues in descending order. Error bars represent standard error of the mean. D PCA plot showing clusters of specific IR profiles in ER positive and ER negative tumour samples (n = 509). E Distributions of IR event frequencies in four major BrCa subtypes (LumA—Luminal A; LumB—Luminal B; Basal, HER2—human epidermal growth factor receptor 2 positive). F Distributions of IR event frequencies in tumour samples assigned to three tumour stages. G Kaplan–Meier plot illustrating the survival probabilities of Luminal B BrCa patients stratified by a high vs low number of IR events. Samples have been dichotomized based on the median number of IR events
Fig. 2
Fig. 2
Putative regulators of intron retention in breast cancer. A Scatterplot showing differentially retained introns (dIR) between MCF7 and MCF10A cells. Genes associated with significant dIR events (p-adj. < 0.001) and IR ratios > 0.4 are labelled. Given the low number of replicates (n = 2), we have applied the Audic and Claverie test [29] for significance testing. B Enriched GO terms in genes positively correlated with IR. Circle size of the GO terms (orange) is denoted by the number of genes associated with them. C RNA splicing associated genes that most highly correlate with the number of IR events in each sample. The scatterplots illustrate the log10 number of IR events against the log10 normalized read counts for each gene. D Genes that most strongly anti-correlate with the number of IR events in each sample
Fig. 3
Fig. 3
IR and cell proliferation. A Cancer Cell Line Encyclopedia (CCLE) cell doubling times (x-axis) correlate with number of IR events (y-axis). B Normalized read counts of proliferation marker Ki-67 anti-correlate with the number of IR events (y-axis). Red dots—tumour samples; blue dots—normal breast tissue
Fig. 4
Fig. 4
Breast cancer-specific gene expression and RBP analysis. A Volcano plots showing differentially expressed genes in nine tumour types vs adjacent healthy tissue. The dashed lines represent the p value cut-off (horizontal; p < 0.05) and fold change threshold (vertical |FC| ≥ 1). See Fig. 1A for cancer-type abbreviations. Highlighted in blue are genes that are exclusively differentially expressed in BrCa, while those in red represent RBPs within this subset. B Heatmap of genes specifically differently expressed in BrCa (represented by colour-coded z-score). Annotation bar (left) shows the colour-coded correlation coefficient between gene expression and number of IR events in each sample. C Bar plots show the frequencies with which known binding motifs occur around the splice sites (50 nt up-/downstream) of differentially retained (IR; dark blue) and non-differentially retained introns (NR; light blue). Differences in average frequencies were determined using Student’s t test. *p < 0.05, ***p < 0.001, ****p < 0.0001, NS—not significant
Fig. 5
Fig. 5
Breast tumour cell composition. A Frequently enriched cell types in breast tumours (red) and normal breast tissue (blue). B Heatmap illustrating cell-type enrichment in healthy adjacent tissue of nine TCGA cancer cohorts. C Abundance of IR events in purified cells. Colours indicate groups of cells belonging to the same family. Dashed red line represent mean number of IR events. Th1/2—T helper 1/2; MSC—mesenchymal stem cell; ly—lymphatic; mv—microvascular; a/cDC—activated/classical dendritic cell; Tcm—T central memory cell; Tem—T effector memory cell; NKT—natural killer T cell; MEP—megakaryocyte–erythroid progenitor cell. ImmuneScore quantifies the enrichment of an immune cell signature including B cells, T cells, DC, eosinophils, macrophages, monocytes, mast cells, neutrophils, and NK cells. StromaScore quantifies the enrichment of a stroma-type cell signature including adipocytes, endothelial cells, and fibroblasts

References

    1. Mercer TR, Gerhardt DJ, Dinger ME, Crawford J, Trapnell C, Jeddeloh JA, et al. Targeted RNA sequencing reveals the deep complexity of the human transcriptome. Nat Biotechnol. 2011;30(1):99–104. doi: 10.1038/nbt.2024. - DOI - PMC - PubMed
    1. Schmitz U, Pinello N, Jia F, Alasmari S, Ritchie W, Keightley MC, et al. Intron retention enhances gene regulatory complexity in vertebrates. Genome Biol. 2017;18(1):216. doi: 10.1186/s13059-017-1339-3. - DOI - PMC - PubMed
    1. Douglas AG, Wood MJ. RNA splicing: disease and therapy. Brief Funct Genomics. 2011;10(3):151–164. doi: 10.1093/bfgp/elr020. - DOI - PubMed
    1. Monteuuis G, Schmitz U, Petrova V, Kearney PS, Rasko JEJ. Holding on to junk bonds: intron retention in cancer and therapy. Can Res. 2021;81(4):779–789. doi: 10.1158/0008-5472.CAN-20-1943. - DOI - PubMed
    1. El Marabti E, Younis I. The cancer spliceome: reprograming of alternative splicing in cancer. Front Mol Biosci. 2018;5:80. doi: 10.3389/fmolb.2018.00080. - DOI - PMC - PubMed

Publication types