. 2022 Dec 1;25(12):105700.
doi: 10.1016/j.isci.2022.105700. eCollection 2022 Dec 22.

Regional specialization of the tongue revealed by gustatory ganglion imaging

Affiliations

Regional specialization of the tongue revealed by gustatory ganglion imaging

Bryan E Fowler et al. iScience. .

Abstract

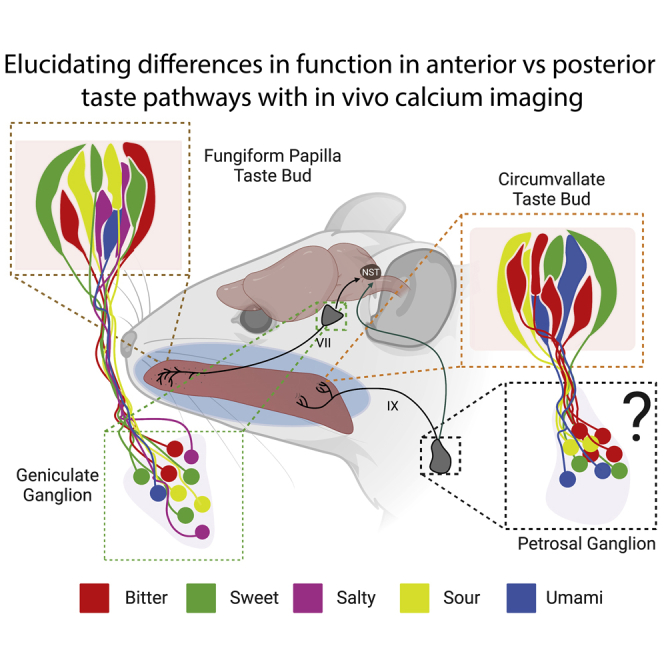
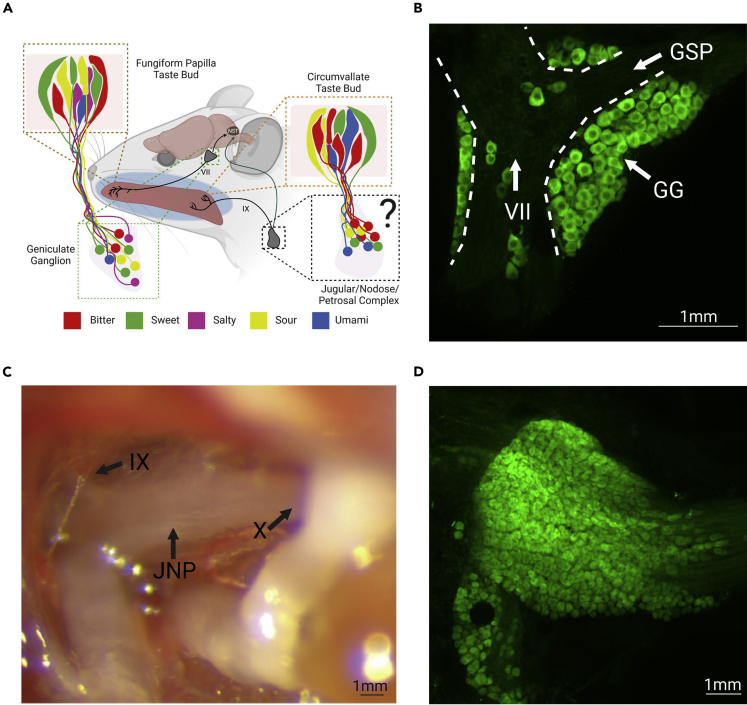
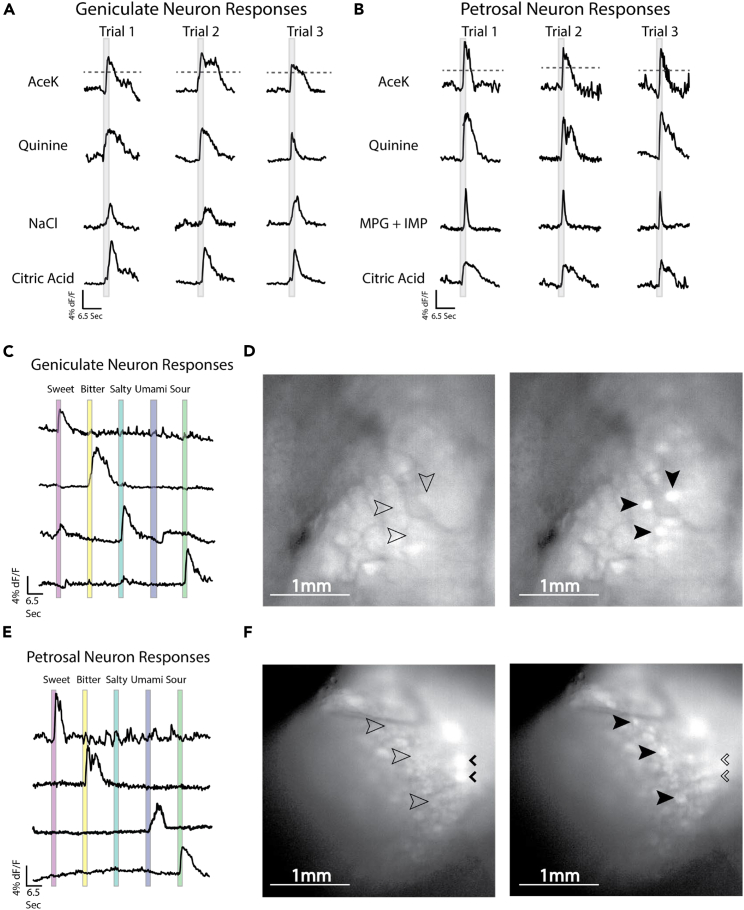
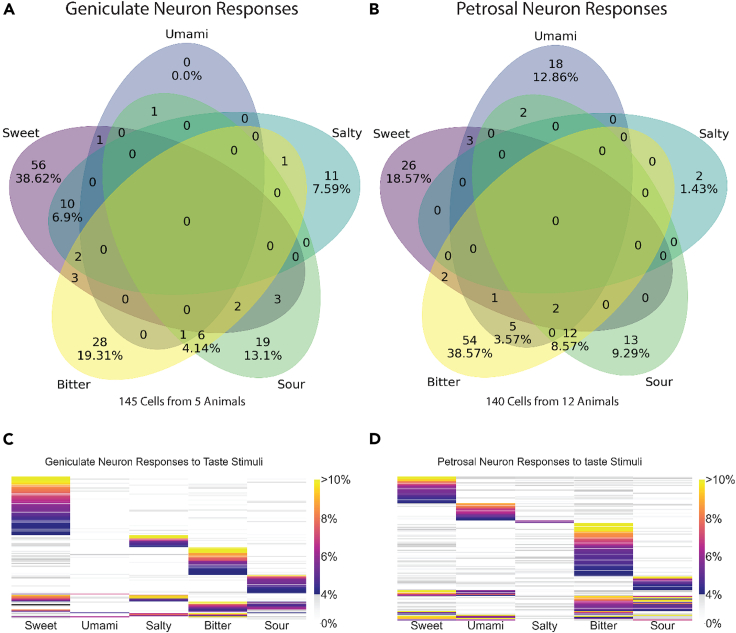
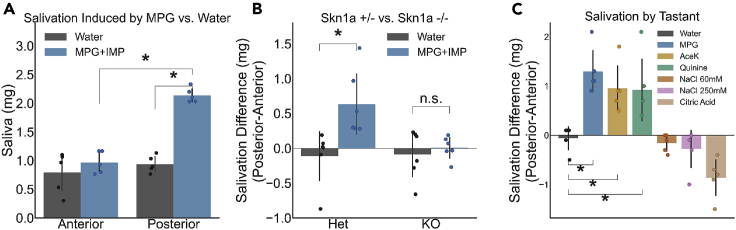
Gustatory information is relayed from the anterior tongue by geniculate ganglion neurons and from the posterior tongue by neurons of the petrosal portion of the jugular/nodose/petrosal ganglion complex. Here, we use in vivo calcium imaging in mice to compare the encoding of taste information in the geniculate and petrosal ganglia, at single-neuron resolution. Our data support an anterior/posterior specialization of taste information coding from the tongue to the ganglia, with petrosal neurons more responsive to umami or bitter and less responsive to sweet or salty stimuli than geniculate neurons. We found that umami (50 mM MPG + 1 mM IMP) promotes salivation when applied to the posterior, but not anterior, tongue. This suggests a functional taste map of the mammalian tongue where the anterior and posterior taste pathways are differentially responsive to specific taste qualities, and differentially regulate downstream physiological functions of taste, such as promoting salivation.

Keywords: Cellular neuroscience; sensory neuroscience.


Conflict of interest statement

The authors declare no competing interests.

Figures

None
Graphical abstract
Figure 1
Figure 1
The TRCs of the tongue are differentially innervated by the Chorda Tympani and Glossopharyngeal nerve in a topographical fashion (A) An image showing the two major taste pathways. TRCs in the fungiform papillae of the anterior tongue send information through the chorda tympani (CT) to the geniculate ganglion. TRCs in the circumvallate of the posterior tongue communicate through the glossopharyngeal nerve (CN IX) with petrosal neurons of the jugular/nodose/petrosal complex (JNP), but previous work has not characterized responses of petrosal neurons. (B) Geniculate ganglion (GG), seventh cranial nerve (VII), and greater superior petrosal nerve (GSP) from a Snap25-2A-GCaMP6s transgenic mouse. Robust expression of GCaMP can be seen throughout the geniculate ganglia. (C) The JNP during surgical exposure shows cranial nerve X innervating the nodose and hints of cranial nerve IX innervating the petrosal. (D) Expression of GCaMP6s in the JNP of a Snap25-2A-GCaMP6s mouse, demonstrating robust expression across the complex. Created with BioRender.com.
Figure 2
Figure 2
A direct comparison of geniculate and vagal neurons (A) Geniculate neurons show repeated responses to multiple applications of an individual taste stimulus. (B) Petrosal neurons show repeatable responses to multiple applications of taste stimuli. (C) Representative traces of geniculate neurons responding to taste stimuli. Most neurons show strong responses to a single taste stimulus. (D) An image showing changes of GCaMP fluorescence in geniculate neurons before (left) and after (right) taste delivery. Empty arrows indicate neuron location without fluorescence, filled arrows indicate fluorescing neurons. (E) Representative traces of petrosal neurons responding to taste stimuli. Again, most neurons respond to a single taste stimulus. (F) Images showing JNP complex neurons in changing states of GCaMP fluorescence. Note that JNP neurons innervate multiple peripheral organs and respond to non-taste stimuli such as respiration. Empty arrows indicate neuron position when not fluorescing, filled arrows indicate fluorescing neurons. Small arrowheads indicate neurons responding to a non–taste-related stimulus.
Figure 3
Figure 3
A comparison of geniculate and petrosal ganglion neuron responses to taste stimuli (A) Each panel in the Venn diagram shows the total number of geniculate neurons in the dataset responding to each taste quality or to multiple taste qualities. Percentages are shown for subpopulations exceeding 4 neurons. (B) Venn diagram showing a total number of petrosal neurons responding to each category of taste or to multiple categories of taste. Percentages are shown for subpopulations exceeding 4 neurons. (C) Heatmap showing responses of geniculate neurons to stimuli for different taste qualities. Results are shown as % DF/F. Subthreshold responses (<4% D/F) are on the gray scale. (D) Heatmap showing responses of petrosal neurons to stimuli for different taste qualities. Results are shown as % DF/F. Subthreshold responses (<4% D/F) are on the gray scale.
Figure 4
Figure 4
Differential taste-salivation responses in FP vs. CV (A) Salivation responses to water and 50 mM MPG + 1 mM IMP in wild-type C57/B6 mice. Significant differences (Tukey, p < 0.05) are indicated by “∗.” N = 5. (B) Salivation differences (saliva produced by posterior stimulation minus saliva produced by anterior stimulation) in Skn1a +/− mice and Skn1a −/−. 50 mM MPG + 1 mM IMP produces a significant salivation response in Skn1a +/−, but not in Skn1a −/−. T-test, p < 0.05 indicated by “∗.” N = 6 per group. (C) Salivation differences (saliva produced by posterior stimulation minus saliva produced by anterior stimulation) seen in C57/B6 mice to taste stimuli for the 5 canonical tastes and high salt (250 mM NaCl). The effect of tastant was significant (ANOVA, F(6,24) = 21.63, p < 0.001). Significant differences (Tukey, p < 0.05) are indicated by “∗.” N = 5. All data are presented as mean +/− SD. Where applicable, Bonferroni correction for multiple comparisons was applied.

References

    1. Bartoshuk L.M. The biological basis of food perception and acceptance. Food Qual. Prefer. 1993;4:21–32.
    1. Boring E. 1942. Sensation and Perception in the History of Psychology.
    1. Hanig D.P. Universitat Leipzig; 1901. Psychophysik des Geschmackssinnes. PhD.
    1. Rothova M., Thompson H., Lickert H., Tucker A.S. Lineage tracing of the endoderm during oral development. Dev. Dyn. 2012;241:1183–1191. - PubMed
    1. Frank M.E. Taste-responsive neurons of the glossopharyngeal nerve of the rat. J. Neurophysiol. 1991;65:1452–1463. - PubMed

LinkOut - more resources