

Biparametric MRI-based radiomics classifiers for the detection of prostate cancer in patients with PSA serum levels of 4∼10 ng/mL
- PMID: 36582803
- PMCID: PMC9793773
- DOI: 10.3389/fonc.2022.1020317
Biparametric MRI-based radiomics classifiers for the detection of prostate cancer in patients with PSA serum levels of 4∼10 ng/mL
Abstract
Purpose: To investigate the predictive performance of the combined model by integrating clinical variables and radiomic features for the accurate detection of prostate cancer (PCa) in patients with prostate-specific antigen (PSA) serum levels of 4-10 ng/mL.
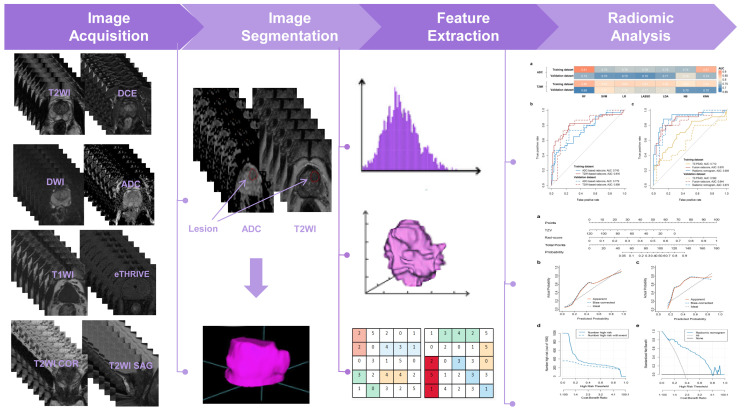
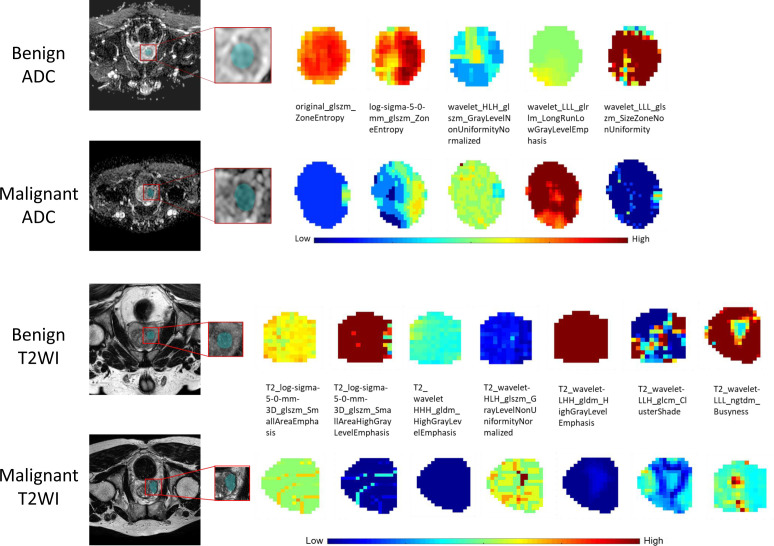
Methods: A retrospective study of 136 males (mean age, 67.3 ± 8.4 years) with Prostate Imaging-Reporting and Data System (PI-RADS) v2.1 category ≤3 lesions and PSA serum levels of 4-10 ng/mL were performed. All patients underwent multiparametric MRI at 3.0T and transrectal ultrasound-guided systematic prostate biopsy in their clinical workup. Radiomic features were extracted from axial T2-weighted images (T2WI) and apparent diffusion coefficient (ADC) maps of each patient using PyRadiomics. Pearson correlation coefficient (PCC) and recursive feature elimination (RFE) were implemented to identify the most significant radiomic features. Independent clinic-radiological factors were identified via univariate and multivariate regression analyses. Seven machine-learning algorithms were compared to construct a single-layered radiomic score (ie, radscore) and multivariate regression analysis was applied to construct the fusion radscore. Finally, the radiomic nomogram was further developed by integrating useful clinic-radiological factors and fusion radscore using multivariate regression analysis. The discriminative power of the nomogram was evaluated by area under the curve (AUC), DeLong test, calibration curve, decision curve analysis (DCA), and clinical impact curve (CIC).
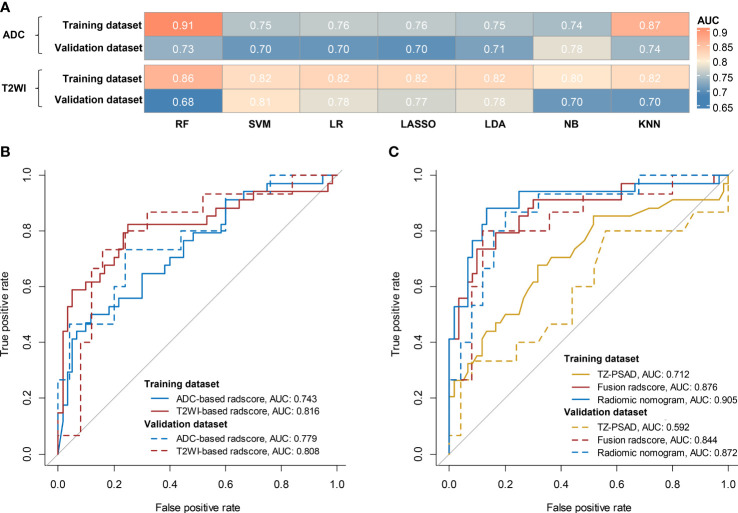
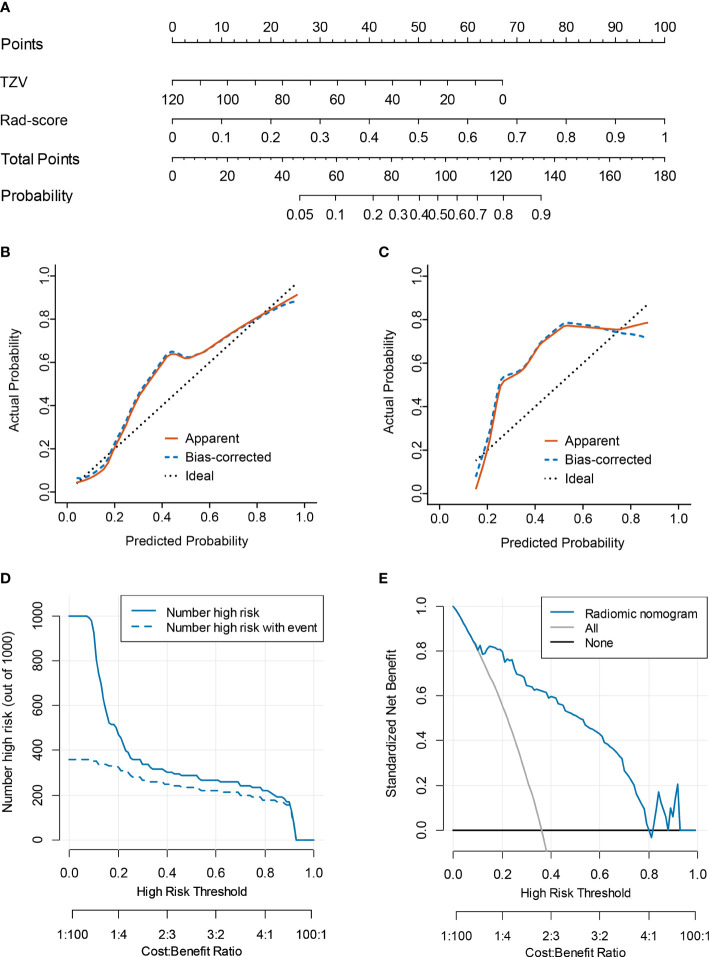
Results: The transitional zone-specific antigen density was identified as the only independent clinic-radiological factor, which yielded an AUC of 0.592 (95% confidence interval [CI]: 0.527-0.657). The ADC radscore based on six features and Naive Bayes achieved an AUC of 0.779 (95%CI: 0.730-0.828); the T2WI radscore based on 13 features and Support Vector Machine yielded an AUC of 0.808 (95%CI: 0.761-0.855). The fusion radscore obtained an improved AUC of 0.844 (95%CI: 0.801-0.887), which was higher than the single-layered radscores (both P<0.05). The radiomic nomogram achieved the highest value among all models (all P<0.05), with an AUC of 0.872 (95%CI: 0.835-0.909). Calibration curve showed good agreement and DCA together with CIC confirmed the clinical benefits of the radiomic nomogram.
Conclusion: The radiomic nomogram holds the potential for accurate and noninvasive identification of PCa in patients with PI-RADS ≤3 lesions and PSA of 4-10 ng/mL, which could reduce unnecessary biopsy.
Keywords: magnetic resonance imaging; PI-RADS; machine learning; prostate cancer; radiomics.
Copyright © 2022 Lu, Li, Huang, Leng, Wang, Zhong, Huang, Li, Yuan and Zhang.
Conflict of interest statement
The authors declare that the research was conducted in the absence of any commercial or financial relationships that could be construed as a potential conflict of interest.
Figures

References
-
- Castro HAS, Iared W, Santos JEM, Solha RS, Shigueoka DC, Ajzen SA. Impact of PSA density of transition zone as a potential parameter in reducing the number of unnecessary prostate biopsies in patients with psa levels between 2. 6 10.0 ng/mL Int Braz J Urol (2018) 44:709–16. doi: 10.1590/s1677-5538.ibju.2017.0506 - DOI - PMC - PubMed
LinkOut - more resources
Full Text Sources
Research Materials
Miscellaneous