. 2022 Dec 8;26(1):105766.
doi: 10.1016/j.isci.2022.105766. eCollection 2023 Jan 20.

Isoform requirement of clustered protocadherin for preventing neuronal apoptosis and neonatal lethality

Affiliations

Isoform requirement of clustered protocadherin for preventing neuronal apoptosis and neonatal lethality

Hiroaki Kobayashi et al. iScience. .

Erratum in

Abstract

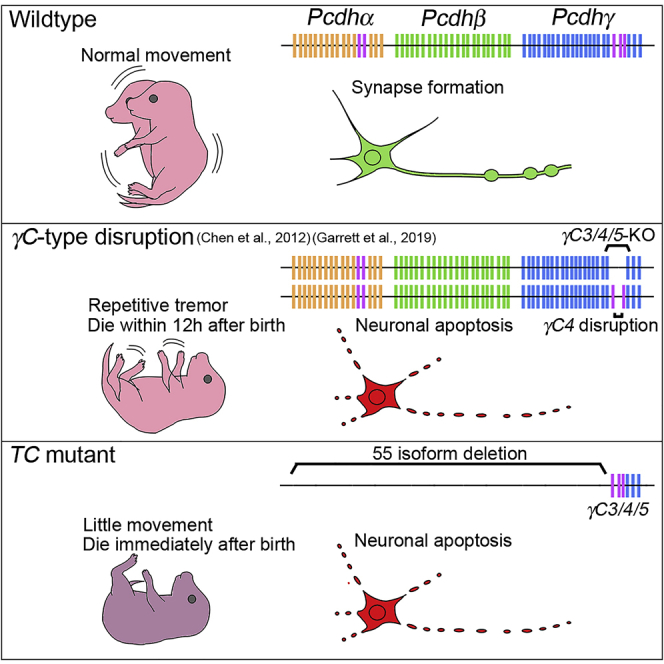
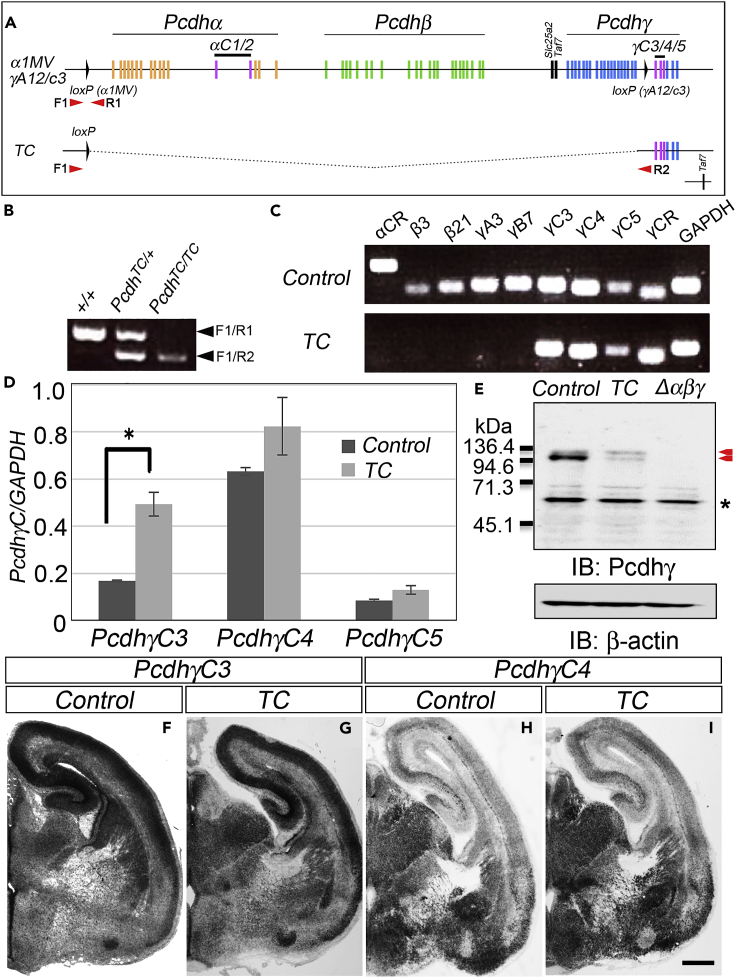
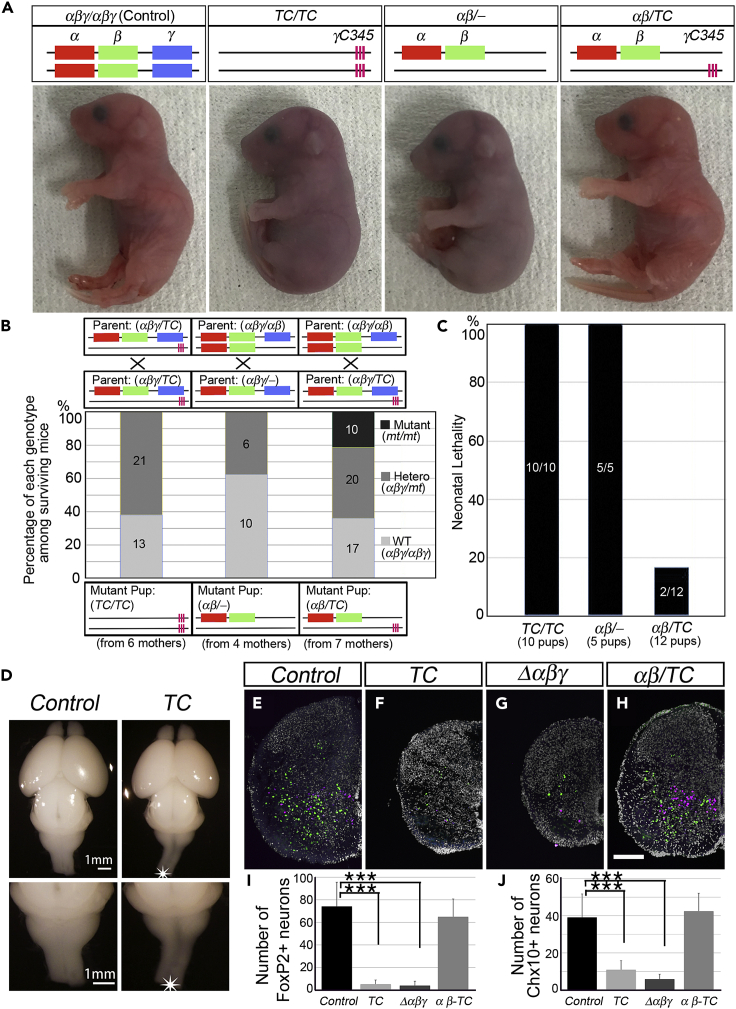
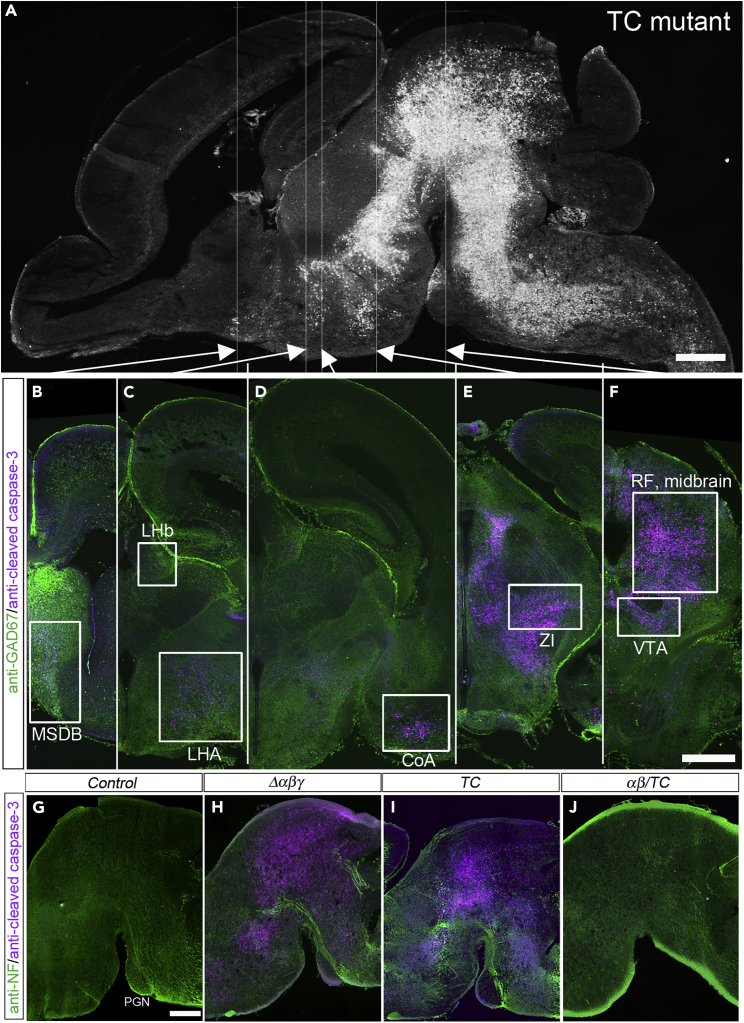
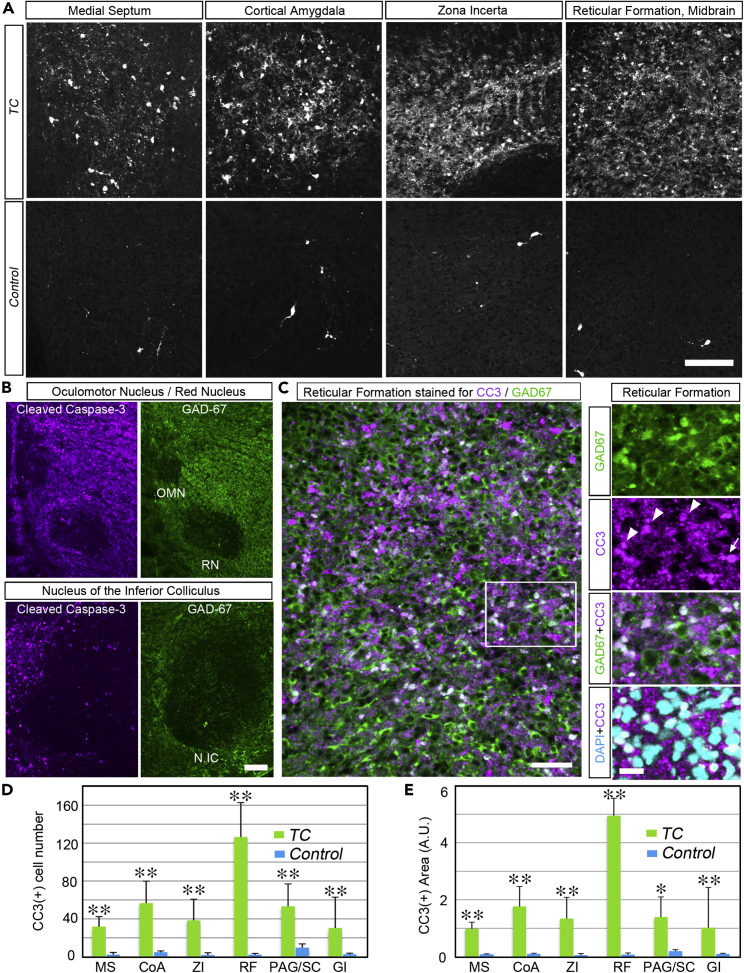
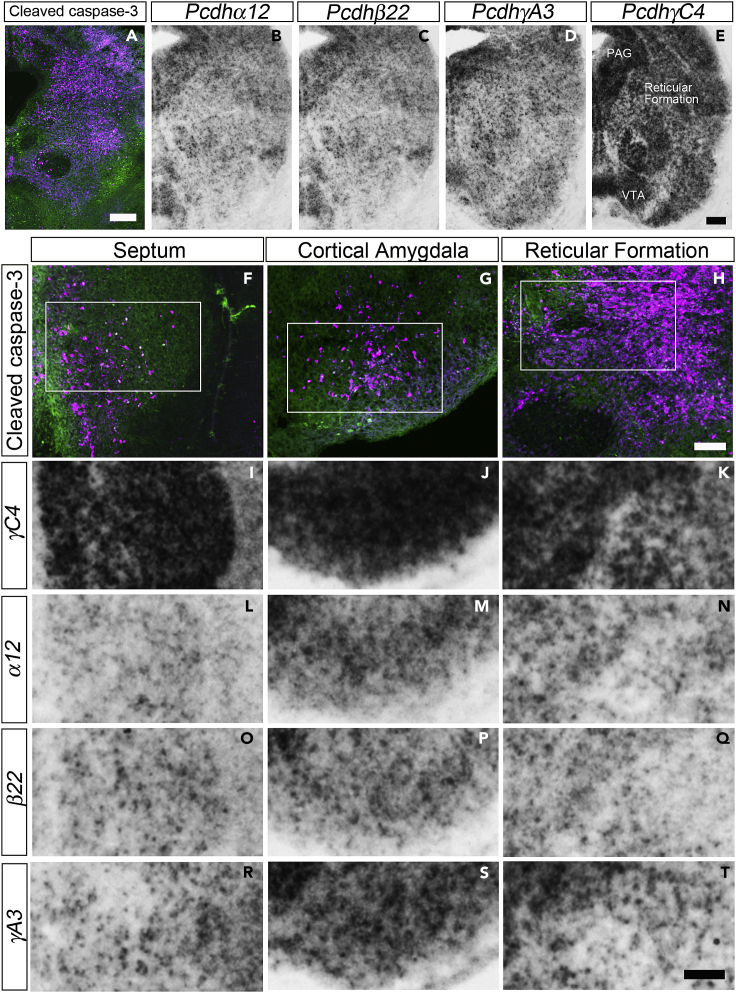
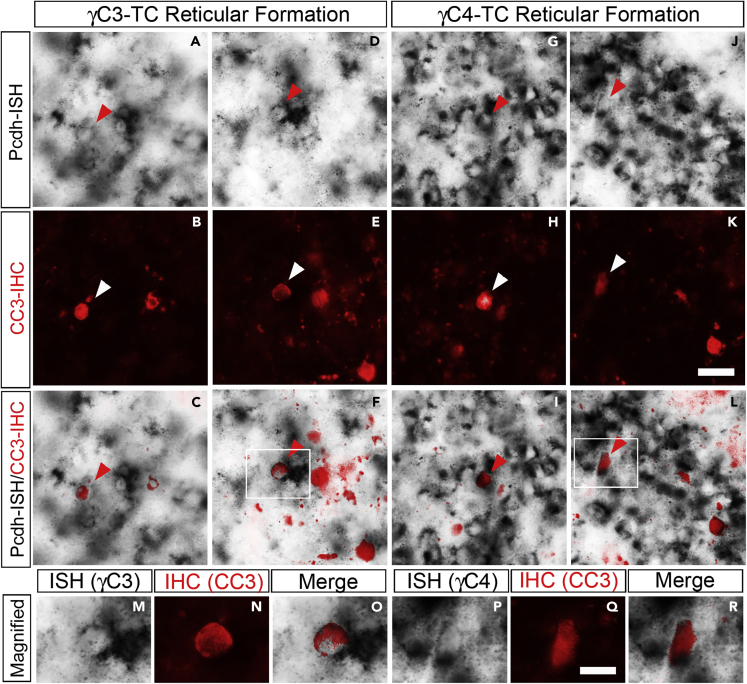
Clustered protocadherin is a family of cell-surface recognition molecules implicated in neuronal connectivity that has a diverse isoform repertoire and homophilic binding specificity. Mice have 58 isoforms, encoded by Pcdhα, β, and γ gene clusters, and mutant mice lacking all isoforms died after birth, displaying massive neuronal apoptosis and synapse loss. The current hypothesis is that the three specific γC-type isoforms, especially γC4, are essential for the phenotype, raising the question about the necessity of isoform diversity. We generated TC mutant mice that expressed the three γC-type isoforms but lacked all the other 55 isoforms. The TC mutants died immediately after birth, showing massive neuronal death, and γC3 or γC4 expression did not prevent apoptosis. Restoring the α- and β-clusters with the three γC alleles rescued the phenotype, suggesting that along with the three γC-type isoforms, other isoforms are also required for the survival of neurons and individual mice.

Keywords: Cell biology; Developmental genetics; Neuroscience.


Conflict of interest statement

The authors declare no competing interests.

Figures

None
Graphical abstract
Figure 1
Figure 1
TC mutants maintain normal expression of the three constitutive γC-type isoforms (A) Genetic organization of the TC mutant allele. The genomic positions of α1MV loxP and γA12/C3 loxP insertion sites (upper diagram, see also Figure S1). TC mutants were generated by Cre-induced miotic recombination at α1MV and γA12/C3 loxP sites (lower diagram). Arrows indicate primer positions used for genotyping. (B) PCR genotyping to distinguish between wild-type (+/+) and TC mutant alleles. (C) RT-PCR analysis showing the expression of γC3, γC4, and γC5 but not the other isoforms in the deleted clusters. αCR and γCR indicates constant region of Pcdhα and γ, respectively. (D) Quantitative real-time PCR showing the comparable expression of the three γC-type isoforms to control mice (+/+:TGtaf7), although an increase in γC3 expression was noted. N = 3 animals per genotype. Error bars represent SEM p < 0.05 by t-test. (E) Western blot detection of Pcdhγ isoforms in E18.5 brain lysates from TC mutants by the antibody against the constant region of Pcdhγ (anti-γCR, indicated by red arrowheads). cPcdh-null mutants (Δαβγ) did not express Pcdhγ, whereas TC mutants exhibited a large reduction but still detectable expression from the remaining γC3, γC4, and γC5 loci. (F-I) In situ hybridization with a γC3 (F, G) or γC4 (H, I) cRNA probe on coronal sections of E18.5 control (F, H) or TC mutant (G, I) brain. Scale bar: 500 μm.
Figure 2
Figure 2
TC mutants died after birth, and neuronal loss was observed in the spinal cord (A) Gross phenotypes of P0/E19.5 neonatal mice. Mouse genotypes are indicated at the top to represent the retained Pcdh cluster or isoform name for each allele. TC mutants (TC/TC) exhibited a hunched posture and umbilical hernia in most cases and died immediately after birth. The αβ/- mice (lacking γ-cluster) also died after birth, but the αβ/TC mice survived. See also Video S1. Response of a neonatal control mouse (αβγ/αβγ) to tail pinch, related to Figure 2, Video S2. Response of a neonatal TC mutant mouse (TC/TC) to tail pinch, related to Figure 2, Video S3. Response of a neonatal mutant mouse harboring only a single allele of α- and β-clusters (αβ/-) to tail pinch, related to Figure 2, Video S4. Response of a neonatal mutant mouse harboring a single allele of α- and β-clusters and TC allele (αβ/TC) to tail pinch, related to Figure 2. (B) Percentage of each genotype among the mice surviving 1 h after natural birth or Caesarean delivery. Parent genotypes are indicated at the top, and the resulting mutant genotypes (both mutant alleles) are at the bottom. Parent combinations to generate each mutant were as follows: for TC mutant, αβγ/TC × αβγ/TC; for αβ/- mutant, αβγ/αβ × αβγ/-; and for αβ/TC mutant, αβγ/αβ × αβγ/TC. Graph legend (mt) represents either mutant allele from mated parents. Numbers in the graph indicate the number of mice examined. (C) Percentage of neonatal lethality in mice with indicated genotype. (D) Whole brains of E18.5 TC mutants. Note the thinner spinal cord of TC mutants compared with control mice (asterisks). (E-H) Transverse sections of E18.5 spinal cords immunostained for FoxP2 (green) and Chx10 (magenta). Scale bar: 100 μm. (I, J) Neuron counts for FoxP2+- (I) and Chx10+- (J) neurons in the ventral spinal cord. N = 7 animals for control (+/+:TGtaf7), N = 4 for TC (TC/TC) and for Δαβγ, and N = 5 for αβ/TC mutant (five sections per animal). Data are represented as mean ± SD ∗∗∗p < 0.001 by one-way analysis of variance and Tukey’s post-hoc test.
Figure 3
Figure 3
Massive apoptosis occurred in the brainstem of TC mutants (A) A sagittal section of the whole brain of E18.5 TC mutant, immunostained for cleaved-caspase-3 (CC3) (white). Massive cell death occurred in the brainstem. CC3 was expressed not only in the soma but also in degenerating dendrites and axons. Therefore, the degenerating fiber tracts were also stained. (B-F) Coronal sections of the brain of E18.5 TC mutant immunostained for CC3 (magenta) and GAD67 (green). Sections were arranged in rostro-caudal order from left to right. Rectangle indicates the area exhibiting apoptosis. The rostro-caudal position of each coronal section is indicated by arrows overlaid in the sagittal section in Figure A. (G-J) Sagittal sections of E18.5 midbrains immunostained for CC3 (magenta) and neurofilament (green). When TC alleles were complemented with a single allele of Pcdhαβ (αβ/TC mutant), apoptotic neuronal death was completely suppressed (J). MSDB, medial septum-diagonal band; LHb, lateral habenular nucleus; LHA, lateral hypothalamic area; CoA, cortical amygdala; ZI, zona incerta; RF, reticular formation; VTA, ventral tegmental area. Scale bars: 500 μm in (A), 500 μm in (B-F), and 250 μm in (G-J).
Figure 4
Figure 4
Enhanced rate of apoptosis in specific nuclei in TC mutants (A) Higher magnification views of brain areas exhibiting apoptotic cell death in the coronal section of E18.5 TC mutant and control mice (+/+:TGtaf7). Sections were immunostained for CC3. (B) Spatial correlation of apoptosis and GAD67 distribution. Paired image of the same visual field immunostained for CC3 (magenta, left) and GAD67 (green, right). Brain areas devoid of massive apoptotic cell death in TC mutants stained less for GAD67. (C) (Left) Reticular formation of TC mutants double immunostained for CC3 (magenta) and GAD67 (green). (Right) Higher magnification views of the section indicated by the rectangle in the left image, triple stained for GAD67 (green), CC3 (magenta), and DAPI (cerulean). The arrowhead and arrow indicate GAD67(+) and GAD67(−) cells, respectively. DAPI staining was performed to show the location of the cell body. (D) Quantification of apoptotic cell counts in the fixed region of interest (ROI) for each brain area. CC3 signal with cell somatic diameter that matched with DAPI staining was counted as a cell. Data are represented as mean ± SD. N = 5 animals per genotype. ∗∗p < 0.01 by Mann-Whitney U-test. (E) Quantification of CC3-stained area (including soma and degenerating neuronal processes) in the fixed region of interest (ROI) for each brain area. The total area of pixels with the above-threshold intensity was measured. Data are represented as mean ± SD. N = 5 animals per genotype. ∗∗p < 0.01, p < 0.05 by Mann-Whitney U-test. Scale bars: 100 μm in (A), 100 μm in (B), 50 μm in (C, left), and 20 μm in (C, right).
Figure 5
Figure 5
Nuclei susceptible to apoptosis in TC mutants exhibited the combinatorial expression of dominant γC4 and stochastic isoforms (A) A coronal section of the midbrain of an E18.5 TC mutant at the level of the red nucleus double-stained for CC3 (magenta) and GAD67 (green). Massive apoptosis occurred at the reticular formation. (B-E) In situ hybridization (ISH) with α12 (B), β22 (C), γA3 (D), and γC4 (E) antisense probes in the coronal sections of the midbrain of a control mouse (+/+:TGtaf7). Sections in B-E were all neighboring sections from the same brain. (F-T) Magnified view of the three representative brain areas showing massive apoptosis: septum (F, I, L, O, R), cortical amygdala (G, J, M, P, S), and reticular formation in the midbrain (H, K, N, Q, T). (F-H) Double immunostaining for CC3 (magenta) and GAD67 (green). Rectangles are approximate visual fields of images in (I-T). (I-T) ISH of γC4 (I-K), α12 (L-N), β22 (O-Q), and γA3 (R-T) antisense probes in the coronal sections of E18.5 control brain corresponding to the rectangular area in (F-H). ISH signal clearly showed the dominant expression of γC4 in the vast majority of cells and the sparse expression of α12, β22, and γA3 stochastic isoforms. Scale bars: 200 μm in (A), 200 μm in (B-E), 100 μm in (F-H), and 100 μm in (I-T).
Figure 6
Figure 6
Expression of γC3 or γC4 did not protect cells from apoptosis in TC mutants (A-L) Dual staining for in situ hybridization (ISH) for γC-type isoforms (gray scale) (A, D, G, J) and immunostaining for CC3 (red) (B, E, H, K) of the brain sections of the reticular formation of an E18.5 TC mutant. (C, F, I, L) Merged images of CC3 signals overlaid on ISH signals. Both γC3-expressing cells (A-F, arrowheads) and γC4-expressing cells (G-L, arrowheads) were undergoing apoptosis. (M-R) Magnified view of γC3-expressing cells (M−O) in the rectangular area in (F), and γC4-expressing cells (P-R) in the rectangular area in (L), expressing the apoptotic marker CC3. Scale bars: 20 μm in (A-L) and 10 μm in (M-R).

References

    1. Hattori D., Millard S.S., Wojtowicz W.M., Zipursky S.L. Dscam-mediated cell recognition regulates neural circuit formation. Annu. Rev. Cell Dev. Biol. 2008;24:597–620. doi: 10.1146/annurev.cellbio.24.110707.175250. - DOI - PMC - PubMed
    1. Kohmura N., Senzaki K., Hamada S., Kai N., Yasuda R., Watanabe M., Ishii H., Yasuda M., Mishina M., Yagi T. Diversity revealed by a novel family of cadherins expressed in neurons at a synaptic complex. Neuron. 1998;20:1137–1151. doi: 10.1016/s0896-6273(00)80495-x. - DOI - PubMed
    1. Mountoufaris G., Canzio D., Nwakeze C.L., Chen W.V., Maniatis T. Writing, reading, and translating the clustered protocadherin cell surface recognition code for neural circuit assembly. Annu. Rev. Cell Dev. Biol. 2018;34:471–493. doi: 10.1146/annurev-cellbio-100616-060701. - DOI - PubMed
    1. Wu Q., Maniatis T. A striking organization of a large family of human neural cadherin-like cell adhesion genes. Cell. 1999;97:779–790. doi: 10.1016/S0092-8674(00)80789-8. - DOI - PubMed
    1. Yagi T. Molecular codes for neuronal individuality and cell assembly in the brain. Front. Mol. Neurosci. 2012;5:45. doi: 10.3389/fnmol.2012.00045. - DOI - PMC - PubMed

LinkOut - more resources