. 2022 Sep;127(9):e2022JE007231.
doi: 10.1029/2022JE007231. Epub 2022 Sep 26.

Global Vertical Distribution of Water Vapor on Mars: Results From 3.5 Years of ExoMars-TGO/NOMAD Science Operations

Affiliations

Global Vertical Distribution of Water Vapor on Mars: Results From 3.5 Years of ExoMars-TGO/NOMAD Science Operations

S Aoki et al. J Geophys Res Planets. 2022 Sep.

Abstract

We present water vapor vertical distributions on Mars retrieved from 3.5 years of solar occultation measurements by Nadir and Occultation for Mars Discovery onboard the ExoMars Trace Gas Orbiter, which reveal a strong contrast between aphelion and perihelion water climates. In equinox periods, most of water vapor is confined into the low-middle latitudes. In aphelion periods, water vapor sublimated from the northern polar cap is confined into very low altitudes-water vapor mixing ratios observed at the 0-5 km lower boundary of measurement decrease by an order of magnitude at the approximate altitudes of 15 and 30 km for the latitudes higher than 50°N and 30-50°N, respectively. The vertical confinement of water vapor at northern middle latitudes around aphelion is more pronounced in the morning terminators than evening, perhaps controlled by the diurnal cycle of cloud formation. Water vapor is also observed over the low latitude regions in the aphelion southern hemisphere (0-30°S) mostly below 10-20 km, which suggests north-south transport of water still occurs. In perihelion periods, water vapor sublimated from the southern polar cap directly reaches high altitudes (>80 km) over high southern latitudes, suggesting more effective transport by the meridional circulation without condensation. We show that heating during perihelion, sporadic global dust storms, and regional dust storms occurring annually around 330° of solar longitude (L S) are the main events to supply water vapor to the upper atmosphere above 70 km.


Figures

Figure 1
Figure 1
Solar longitude (x‐axis) and latitude (y‐axis) of the solar occultation measurements taken from 21 April to 30 September 2021 by Trace Gas Orbiter/Nadir and Occultation for Mars Discovery used in this study. The color denotes the local time of the measurements.
Figure 2
Figure 2
Example of spectra measured by Trace Gas Orbiter/Nadir and Occultation for Mars Discovery (black curves) with orders 134 (a) and 136 (b). These spectra are measured around 45 km above areoid on 25 September 2018 (L S = 257° in MY 34) at latitude = 64°S, longitude = 7°W, LT = 23 hr. The red curves show the best‐fit synthetic spectra. The top and middle panels show the original transmittances and those after removal of the continuum, respectively. The bottom panels illustrate the residuals of the top panel in red and the instrumental noise level in black. The unit of the x‐axis is wavenumber (cm−1). There is a very good agreement between volume mixing ratios retrieved from orders 134 and 136 (87.9 ± 3.3 and 88.0 ± 2.3 ppmv, respectively).
Figure 3
Figure 3
Seasonal variation of the water vapor vertical profiles from L S = 160° in MY 34 to L S = 130° in MY 36 retrieved from the NOMAD data in the northern hemisphere (the middle panel) and the southern hemisphere (the bottom panel). The retrievals are binned with an interval of 1° of solar longitudes (averaged in latitudes and longitude). The top panel shows the latitudes and local solar time of the measurements (same as Figure 1). The white represents either no detection or no measurement.
Figure 4
Figure 4
Seasonal variation of the water vapor number density at 70 km altitude in MY 34 (top) and MY 35 (bottom). The differences in color show the latitudes of the measurements. The filled circles represent the measurements in the evening terminator, and the unfilled ones illustrates those in the morning terminator. The retrievals are binned with an interval of 1° of solar longitude (averaged in latitude and longitude). The dashed black lines show the period as L S = 265° when the maximum water number density is observed in MY 35.
Figure 5
Figure 5
Seasonal and latitudinal variation of the minimum altitudes where the maximum water vapor is less than 30 ppm (the top panel). The bottom panel shows their averaged values with an interval of 10° of the solar longitudes, calculated separately at 90°S‐60°S (light blue), 60°S‐0°S (blue), 0°N‐60°N (red), and 60°N‐90°N (orange).
Figure 6
Figure 6
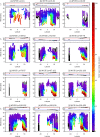
Latitudinal variation of the water vapor vertical profiles retrieved from Nadir and Occultation for Mars Discovery (NOMAD) data at L S = 0–6° (a), L S = 6–30° (b), L S = 30–38° (c), L S = 38–52° (d), L S = 52–59°(e), L S = 59–79° (f), L S = 79–87° (g), L S = 87–101° (h), L S = 101–109° (i), L S = 109–126° (j), L S = 126–139° (k), and L S = 39–155° (l) in MY 35. The retrievals are binned with an interval of 5° of latitudes (averaged in longitude). The top panels show the local times of the measurements for each figure. The blue and red lines illustrate 6 a.m. and 6 p.m., respectively.
Figure 7
Figure 7
Latitudinal variation of the water vapor vertical profiles retrieved from Nadir and Occultation for Mars Discovery (NOMAD) data at L S = 15–28° (a), L S = 28–42° (b), L S = 42–48° (c), L S = 48–66° (d), L S = 66–77°(e), L S = 77–91° (f), L S = 91–99° (g), and L S = 99–106° (h) in MY 36. The retrievals are binned with an interval of 5° of latitudes (averaged in longitude). The top panels show the local times of the measurements for each figure. The blue and red lines illustrate 6 a.m. and 6 p.m., respectively.
Figure 8
Figure 8
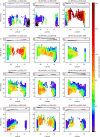
Latitudinal variation of the water vapor vertical profiles retrieved from Nadir and Occultation for Mars Discovery (NOMAD) data at L S = 164–180° (a), L S = 180–195° (b), L S = 195–210° (c), L S = 210–218° (d), L S = 218–241°(e), L S = 241–256° (f), L S = 256–273° (g), L S = 273–282° (h), L S = 282–303° (i), L S = 303–318° (j), L S = 318–333° (k), and L S = 330–340° (l) in MY 34. The retrievals are binned with an interval of 5° of latitudes (averaged in longitude). The top panels show the local times of the measurements for each figure. The blue and red lines illustrate 6 a.m. and 6 p.m., respectively.
Figure 9
Figure 9
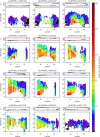
Latitudinal variation of the water vapor vertical profiles retrieved from Nadir and Occultation for Mars Discovery data at L S = 155–161° (a), L S = 161–192° (b), L S = 192–218° (c), L S = 218–233° (d), L S = 233–251°(e), L S = 251–261° (f), L S = 261–284° (g), L S = 284–299° (h), L S = 299–317° (i), L S = 317–325° (j), L S = 325–347° (k) in MY 35, and from L S = 347° in MY 35 to L S = 15° in MY 36 (l). The retrievals are binned with an interval of 5° of latitudes (averaged in longitude). The top panels show the local times of the measurements for each figure. The blue and red lines illustrate 6 a.m. and 6 p.m., respectively.
Figure 10
Figure 10
Latitude—altitude maps of water vapor vertical distributions calculated by GEM‐Mars (Daerden et al., , ; Neary et al., 2020) at L S = 18° (a), L S = 118° (b), L S = 205° (c), and L S = 273° (d) for non‐global dust storm year such as MY 35. The seasons are selected to represent the Nadir and Occultation for Mars Discovery results (Figures 7a, 7e and 10b, 10d) The color shading denotes the volume mixing ratio of water vapor. The white and black contours illustrate the volume mixing ratio of water in ice clouds (ppmv, see text) and mass stream functions (×109 kg/s), respectively. Full lines represent counterclockwise movement, and dotted lines represent clockwise movement of air. The values are averaged over 5 sols.
Figure 11
Figure 11
Local time variation of the water vapor vertical distributions calculated by GEM‐Mars (Daerden et al., , ; Neary et al., 2020) at L S = 18° (a), L S = 118° (b), L S = 205° (c), and L S = 273° (d) for non‐global dust storm year such as MY 35. The seasons are selected to represent the Nadir and Occultation for Mars Discovery results (Figures 7a, 7e and 10b, 10d) The color shading denotes the volume mixing ratio of water vapor and the white contours illustrate the volume mixing ratio of water in ice clouds (ppmv). The top, middle, and bottom panels show results at 60°N, 0°N, and 60°S, respectively. The values are averaged over 5 sols.
Figure 12
Figure 12
Vertical profiles of the retrieved water vapor volume mixing ratio at L S = 109–126° in MY 35, which corresponds to the map shown in Figure 6j. The profiles are illustrated in separate panels based on the latitudes of the measurements (from the left to the right: Lat = 60‐40°S, 40‐20°S, 20‐0°S, 0–20°N, 20–40°N, 40–60°N, 60–70°N). Note that the horizontal scales are different at each panel.
Figure 13
Figure 13
Comparison of the water vapor volume mixing ratio retrieved by Atmospheric Chemistry Suite (ACS) NIR (x‐axis) and Nadir and Occultation for Mars Discovery (y‐axis) using their simultaneous measurements. The water vapor volume mixing retrieved by ACS NIR is recalculated based on the atmospheric density predicted by GEM‐Mars that are used to calculate the water vapor volume mixing ratio retrieved by Nadir and Occultation for Mars Discovery (NOMAD). The light‐blue and red and lines show line of equality and best‐fit linear functions, respectively. N, R, A, B values represent the number of the samples, correlation factor (the linear Pearson correlation coefficient), and the coefficients of the best‐fit linear function (NOMADvmr = A + ACSvmr × B, where NOMADvmr and ACSvmr stand for the water vapor volume mixing ratio retrieved by NOMAD and ACS NIR).
Figure 14
Figure 14
Water vapor partial pressures determined in this analysis. The differences in colors represents the altitude of the measurements. They are illustrated in the separate panels depending of the seasons and latitude of the measurements. The red thick curves show the saturation vapor pressure, and the red dashed curves are the range of their accuracy due to the uncertainty in the general circulation model (GCM) temperatures (±10 K).

References

    1. Alday, J. , Trokhimovskiy, A. , Irwin, P. G. J. , Wilson, C. F. , Montmessin, F. , Lefèvre, F. , et al. (2021). Isotopic fractionation of water and its photolytic products in the atmosphere of Mars. Nature Astronomy, 5(9), 943–950. 10.1038/s41550-021-01389-x - DOI
    1. Aoki, S. , Daerden, F. , Viscardy, S. , Thomas, I. R. , Erwin, J. T. , Robert, S. , et al. (2021). Annual appearance of hydrogen chloride on Mars and a striking similarity with the water vapor vertical distribution observed by TGO/NOMAD. Geophysical Research Letters, 48(11), e2021GL092506. 10.1029/2021GL092506 - DOI
    1. Aoki, S. , & Vandaele, A. C. (2022). Global vertical distribution of water vapor on Mars retrieved from 3.5 years of TGO/NOMAD science operations, presented in Aoki et al., 2022. Royal Belgian Institute for Space Aeronomy. 10.18758/71021072 - DOI
    1. Aoki, S. , Vandaele, A. C. , Daerden, F. , Villanueva, G. L. , Liuzzi, G. , Thomas, I. R. , et al. (2019). Water vapor vertical profiles on Mars in dust storms observed by TGO/NOMAD. Journal of Geophysical Research: Planets, 124(12), 3482–3497. 10.1029/2019JE006109 - DOI
    1. Belyaev, D. A. , Fedorova, A. A. , Trokhimovskiy, A. , Alday, J. , Montmessin, F. , Korablev, O. I. , et al. (2021). Revealing a high water abundance in the upper mesosphere of Mars with ACS onboard TGO. Geophysical Research Letters, 48(10), e2021GL093411. 10.1029/2021GL093411 - DOI

LinkOut - more resources