. 2022 Dec 23;5(12):17682-17692.
doi: 10.1021/acsanm.2c03573. Epub 2022 Dec 1.

Gating with Charge Inversion to Control Ionic Transport in Nanopores

Affiliations

Gating with Charge Inversion to Control Ionic Transport in Nanopores

Wilfred S Russell et al. ACS Appl Nano Mater. .

Abstract

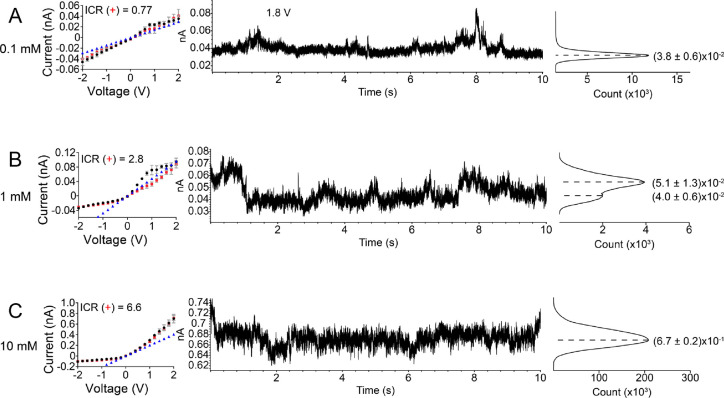
Multivalent ions modify the properties of the solid/liquid interfaces, and in some cases, they can even invert the polarity of surface charge, having large consequences for separation processes based on charge. The so-called charge inversion is observed as a switch from negative surface charge in monovalent salts, e.g., KCl, to effective positive surface charge in multivalent salts that is possible through a strong accumulation and correlation of the multivalent ions at the surface. It is not known yet, however, whether the density of the positive charge induced by charge inversion depends on the pore opening diameter, especially in extreme nanoconfinement. Here, we probe how the effective surface charge induced by charge inversion is influenced by the pore opening diameter using a series of nanopores with an opening between 4 and 25 nm placed in contact with trivalent chromium ions in tris(ethylenediamine)chromium(III) sulfate at different concentrations. Our results suggest that the effective positive charge density can indeed be modified by nanoconfinement to the extent that is dependent on the pore diameter, salt concentration, and applied voltage. In addition, the correlated ions can increase the transmembrane current in nanopores with an opening diameter down to 10 nm and cause a significant blockage of the current for narrower pores. The results provide guidelines to control ionic transport at the nanoscale with multivalent ions and demonstrate that in the same experimental conditions, differently sized pores in the same porous material can feature different surface charge density and possibly ion selectivity.


Conflict of interest statement

The authors declare no competing financial interest.

Figures

Figure 1
Figure 1
Probing surface charges in a conical nanopore by measuring iV curves in KCl salt solutions. (A, B) Schemes of the conically shaped nanopore with negatively (A) and positively (B) charged pore walls. The arrows indicate the direction of cation (A) and anion (B) migration for the voltage polarity that produces higher currents. (C) Recordings for an as-prepared 4 nm small opening (tip) and a 720 nm wide (base) in diameter conical nanopore placed in 100 mM KCl. (D) Recordings in 100 mM KCl for the same nanopore as in (C) after it had been modified with PAH. Modification with PAH rendered the nanopore to be positively charged. All iV curves are averages of three forward and reverse scans performed with a Keithley picoammeter/voltage source. The error bars were calculated by standard deviations of the three scans. Ion current rectification (ICR) was calculated based on currents at −2 and +2 V.
Figure 2
Figure 2
iV curves and current time series (at 1.8 V) with histograms of a conical nanopore with a small opening of 25 nm. (A–C) The recordings were performed at pH 8 with symmetric concentrations of tris(ethylenediamine)chromium(III) on both sides of the membrane: 0.1 mM (A), 1 mM (B), and 10 mM (C). The iV curves in the left panels were obtained by averaging 50 s long recordings of ion current in time at each voltage step. The error bars were calculated by standard deviations of ion current signals during recording. The black and red recordings indicate the forward scan (from −2 to +2 V, 200 mV steps) and the reverse scan (from +2 to −2 V, 200 mV steps), respectively. The currents in blue correspond to calculated values, assuming that the pore is uncharged and filled with the bulk solution of 0.1 mM (A), 1 mM (B), and 10 mM (C) Cr3+. ICR(+) is a ratio of currents at +2 and −2 V. Examples of time series of ion current are shown in the middle. Histograms of the ion current values are shown to the right with positions of the peaks and standard deviations obtained by fitting with Gaussian distribution. The large opening of this pore was 680 nm.
Figure 3
Figure 3
(A–C) iV curves and current time series (1.8 V) with histograms of a conical nanopore with a small opening of 10 nm. The recordings were performed in three concentrations of tris(ethylenediamine)chromium(III): 0.1 mM (A), 1 mM (B), and 10 mM (C). The iV curves shown in the left panels were obtained by averaging 50 s long recordings of ion current in time at each voltage step. The error bars were calculated by standard deviations of ion current signals during recording. The forward and reverse scans are shown in black and red, respectively. The currents in blue correspond to calculated values, assuming that the pore is uncharged and filled with the bulk solution of 0.1 mM (A), 1 mM (B), and 10 mM (C) Cr3+. ICR(+) is a ratio of currents at +2 and −2 V. Histograms of 10 s long ion current series in the middle column are shown to the right. The histograms contain positions and standard deviations of the major peaks obtained by fitting with Gaussian distribution. The base opening of this pore was 1 μm.
Figure 4
Figure 4
(A–C) iV curves and current time series (1.8 V) with histograms of a conical nanopore with a tip opening of 4 nm. The recordings were performed in three concentrations of tris(ethylenediamine)chromium(III): 0.1 mM (A), 1 mM (B), and 10 mM (C). iV curves are shown in the left panels. The black and red recordings show the forward and reverse scans, respectively. The currents in blue correspond to values calculated, assuming that the pore is uncharged and filled with the bulk solution of 0.1 mM (A), 1 mM (B), and 10 mM (C) Cr3+. Histograms of 10 s long ion current series in the middle column are shown to the right. The histograms contain positions and standard deviations of the major peaks obtained by fitting with Gaussian distribution. In (C), ICR(−) was calculated based on average values shown in iV curves, while ICR(+) was found based on the transient openings of the current seen in current time series and current at −1.8 V. The base opening of this pore was 720 nm.
Figure 5
Figure 5
Numerical modeling of charge inversion using the SCL theory (Model 1) and the site-binding model (Model 2), assuming that the effective diameter of cations and anions equals to 0.89 nm. (A) Axial variation of σeff along the pore axis for 0.1 mM (inset) and 10 mM Cr3+ at three different tip openings, as predicted by Model 1. (B) Axial variation of σeff in 10 mM Cr3+ for 4, 10, and 25 nm in diameter nanopores, as predicted by Model 2. (C) Average effective surface charge density from Model 2 for different pores and voltages at 0.1 mM (inset) and 10 mM Cr3+. (D–F) Simulated iV curves at 0.1 mM (insets) and 10 mM Cr3+ for three tip opening diameters of (D) 4 nm, (E) 10 nm, and (F) 25 nm from Model 1 (black lines) and Model 2 (blue lines) using coupled PNP–NS equations. The dashed lines in (D) show the iV curves simulated for the same pore geometry but larger ions; the diameter of both cations and anions was assumed 1.1 nm. In (A) and (B), the axial position of 0 denotes the location of tip opening. Figure S6 shows a larger portion of the simulated system for Figure 5A,B. The base openings are similar to the values reported for the pores shown in Figures 2–4.

References

    1. Grosberg A. Y.; Nguyen T. T.; Shklovskii B. I. Colloquium: The Physics of Charge Inversion in Chemical and Biological Systems. Rev. Mod. Phys. 2002, 74, 329–345. 10.1103/RevModPhys.74.329. - DOI
    1. Besteman K.; Van Eijk K.; Lemay S. G. Charge Inversion Accompanies DNA Condensation by Multivalent Ions. Nature Phys. 2007, 3, 641–644. 10.1038/nphys697. - DOI
    1. Shklovskii B. I. Screening of a Macroion by Multivalent Ions: Correlation-Induced Inversion of Charge. Phys. Rev. E 1999, 60, 5802–5811. 10.1103/PhysRevE.60.5802. - DOI - PubMed
    1. Besteman K.; Zevenbergen M. A. G.; Lemay S. G. Charge Inversion by Multivalent Ions: Dependence on Dielectric Constant and Surface-Charge Density. Phys. Rev. E 2005, 72, 06150110.1103/PhysRevE.72.061501. - DOI - PubMed
    1. Wernersson E.; Kjellander R.; Lyklema J. Charge Inversion and Ion–Ion Correlation Effects at the Mercury/Aqueous MgSO4 Interface: Toward the Solution of a Long-Standing Issue. J. Phys. Chem. C 2010, 114, 1849–1866. 10.1021/jp906759e. - DOI