

Classification of Alzheimer's disease and frontotemporal dementia using routine clinical and cognitive measures across multicentric underrepresented samples: A cross sectional observational study
- PMID: 36583137
- PMCID: PMC9794191
- DOI: 10.1016/j.lana.2022.100387
Classification of Alzheimer's disease and frontotemporal dementia using routine clinical and cognitive measures across multicentric underrepresented samples: A cross sectional observational study
Abstract
Background: Global brain health initiatives call for improving methods for the diagnosis of Alzheimer's disease (AD) and frontotemporal dementia (FTD) in underrepresented populations. However, diagnostic procedures in upper-middle-income countries (UMICs) and lower-middle income countries (LMICs), such as Latin American countries (LAC), face multiple challenges. These include the heterogeneity in diagnostic methods, lack of clinical harmonisation, and limited access to biomarkers.
Methods: This cross-sectional observational study aimed to identify the best combination of predictors to discriminate between AD and FTD using demographic, clinical and cognitive data among 1794 participants [904 diagnosed with AD, 282 diagnosed with FTD, and 606 healthy controls (HCs)] collected in 11 clinical centres across five LAC (ReDLat cohort).
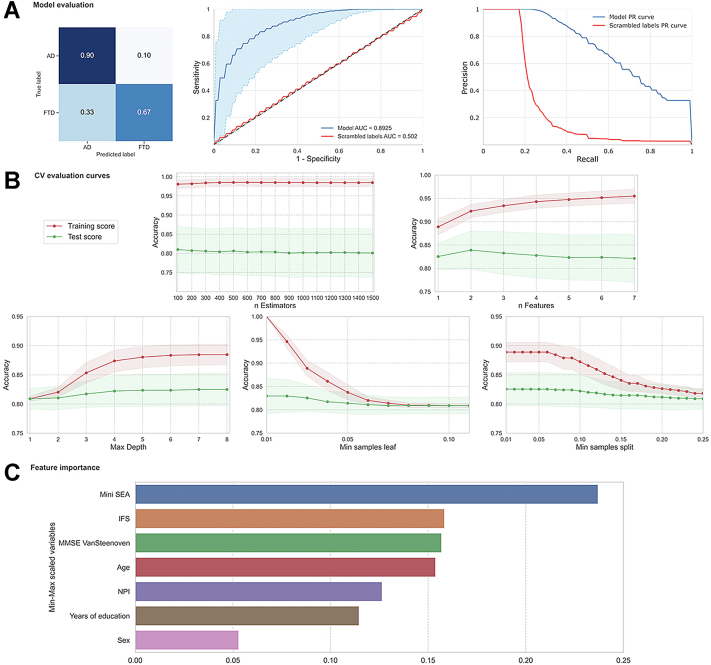
Findings: A fully automated computational approach included classical statistical methods, support vector machine procedures, and machine learning techniques (random forest and sequential feature selection procedures). Results demonstrated an accurate classification of patients with AD and FTD and HCs. A machine learning model produced the best values to differentiate AD from FTD patients with an accuracy = 0.91. The top features included social cognition, neuropsychiatric symptoms, executive functioning performance, and cognitive screening; with secondary contributions from age, educational attainment, and sex.
Interpretation: Results demonstrate that data-driven techniques applied in archival clinical datasets could enhance diagnostic procedures in regions with limited resources. These results also suggest specific fine-grained cognitive and behavioural measures may aid in the diagnosis of AD and FTD in LAC. Moreover, our results highlight an opportunity for harmonisation of clinical tools for dementia diagnosis in the region.
Funding: This work was supported by the Multi-Partner Consortium to Expand Dementia Research in Latin America (ReDLat), funded by NIA/NIH (R01AG057234), Alzheimer's Association (SG-20-725707-ReDLat), Rainwater Foundation, Takeda (CW2680521), Global Brain Health Institute; as well as CONICET; FONCYT-PICT (2017-1818, 2017-1820); PIIECC, Facultad de Humanidades, Usach; Sistema General de Regalías de Colombia (BPIN2018000100059), Universidad del Valle (CI 5316); ANID/FONDECYT Regular (1210195, 1210176, 1210176); ANID/FONDAP (15150012); ANID/PIA/ANILLOS ACT210096; and Alzheimer's Association GBHI ALZ UK-22-865742.
Keywords: Alzheimer’s Disease; Frontotemporal dementia; Machine learning; Underrepresented samples.
Conflict of interest statement
Bruce Miller: support for the present Manuscript (National Institutes of Health (R01AG057234); Grants or contracts (NIH 1R01AG070883, NIH/NIA R35AG072362), Royalties or licenses (Cambridge University Press, Guilford Publications, Inc.; Johns Hopkins Press, Oxford University Press, Taylor & Francis Group, Elsevier, Inc.), payment or honoraria for lectures (UCLA- Grand Rounds, Korean Dementia Society Talks, UCI MIND Seminar Series, Taipei Medical University, Dementia Center; Support for attending meetings and/or travel (UCLA, CalArts, GBHI); Participation on Data Safety Monitoring Board or Advisory Board (Stanford University ADRC—External Advisor; The Buck Institute for Research on Aging—Scientific Advisor; Arizona Alzheimer's Disease Center—External Advisor); Leadership of fiduciary role in other board, society, committee or advocacy group (Institute for Neurodegenerative Diseases – Affiliated Faculty, The Bluefield Project to Cure FTD-- Director and Internal Advisor, Tau Consortium—Co-Director, and Scientific Advisor, Global Brain Health Institute GBHI—Co-Director). Jennifer Yokoyama: All support for the present Manuscript: (NIH-NIA R01 AG062588, R01 AG057234, P30 AG062422; NIH-NINDS U54 NS123985); Grants or contracts from any entity (Rainwater Charitable Foundation – Institution; Alzheimer’s Association – Institution; Global Brain Health Institute – Institution; Mary Oakley Foundation – Institution); Payment or honoraria for lectures, presentations, speakers, bureaus, manuscript writing or educational events (Washington University in St. Louis School of Medicine NeuroGenomics and Informatics Center); Participation on Data Safety Monitoring Board or Advisory Board (Epstein Family Alzheimer's Collaboration - Scientific Advisory Board member—payment made to institution). Ana Luisa Sosa: Grants or contracts from any entity (FINGERS, ReDLat, DIAN-Tu, DIAN-obs); Payment or honoraria for lectures, presentations, speakers, bureaus, manuscript writing or educational events (Asopharma, Lundbeck, Carnot, Apopharma, Biogen and Roche); Support for attending meetings and/or travel (ADI meeting 2022, by Carnot); Participation on Data Safety Monitoring Board or Advisory Board (Carnot and Lundbeck - Advisory Board). All other authors declare they have no competing interests.
Figures

References
-
- Livingston G., Sommerlad A., Orgeta V., et al. Dementia prevention, intervention, and care. Lancet. 2017;390(10113):2673–2734. - PubMed
Grants and funding
LinkOut - more resources
Full Text Sources
Miscellaneous
