. 2023 Jan 20;132(2):187-204.
doi: 10.1161/CIRCRESAHA.122.321398. Epub 2022 Dec 30.

Impaired Human Cardiac Cell Development due to NOTCH1 Deficiency

Affiliations

Impaired Human Cardiac Cell Development due to NOTCH1 Deficiency

Shiqiao Ye et al. Circ Res. .

Abstract

Background: NOTCH1 pathogenic variants are implicated in multiple types of congenital heart defects including hypoplastic left heart syndrome, where the left ventricle is underdeveloped. It is unknown how NOTCH1 regulates human cardiac cell lineage determination and cardiomyocyte proliferation. In addition, mechanisms by which NOTCH1 pathogenic variants lead to ventricular hypoplasia in hypoplastic left heart syndrome remain elusive.

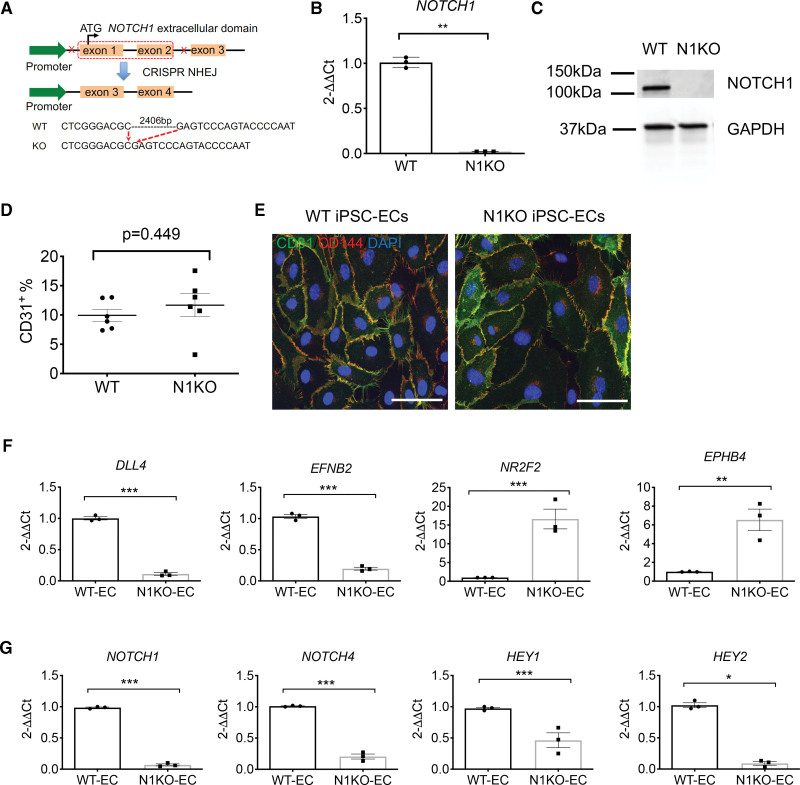
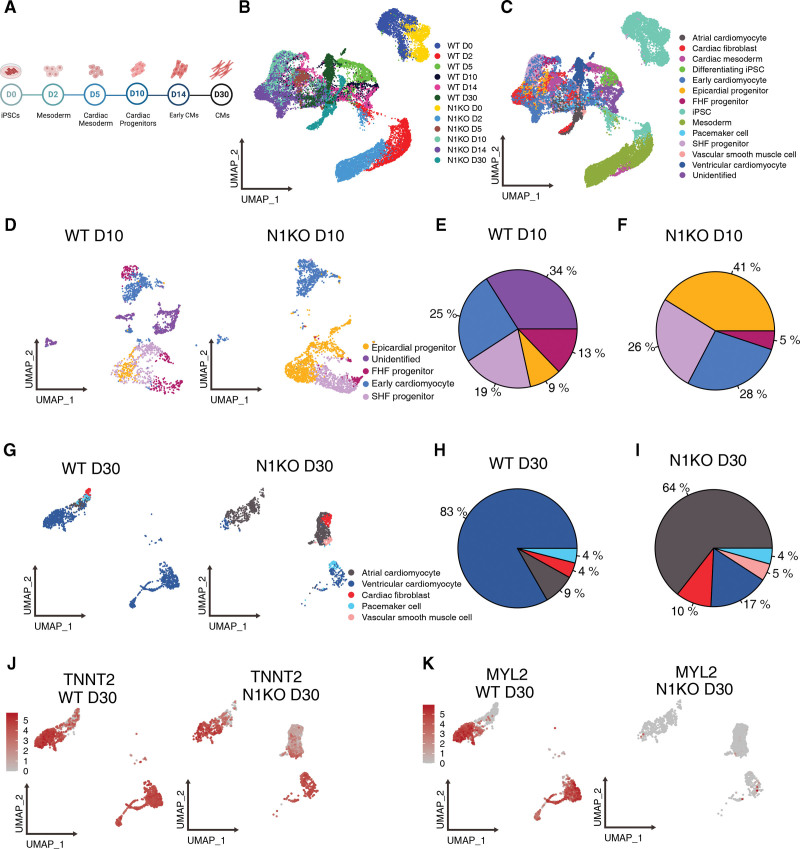
Methods: CRISPR (Clustered Regularly Interspaced Short Palindromic Repeats)/Cas9 genome editing was utilized to delete NOTCH1 in human induced pluripotent stem cells. Cardiac differentiation was carried out by sequential modulation of WNT signaling, and NOTCH1 knockout and wild-type differentiating cells were collected at day 0, 2, 5, 10, 14, and 30 for single-cell RNA-seq.

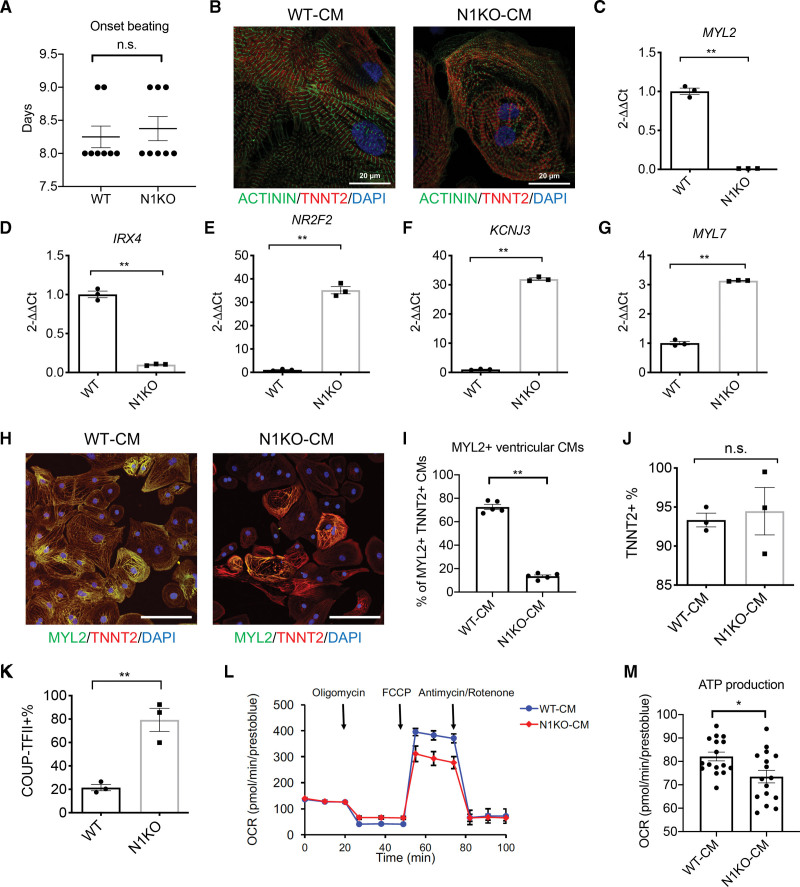
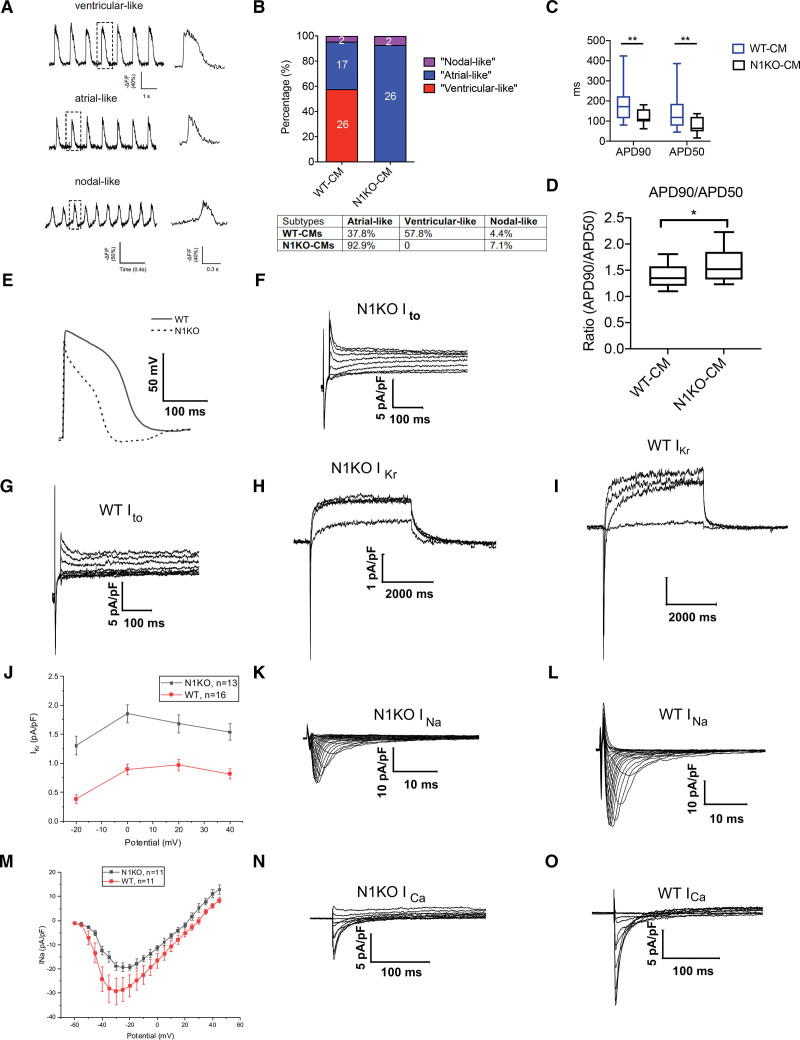
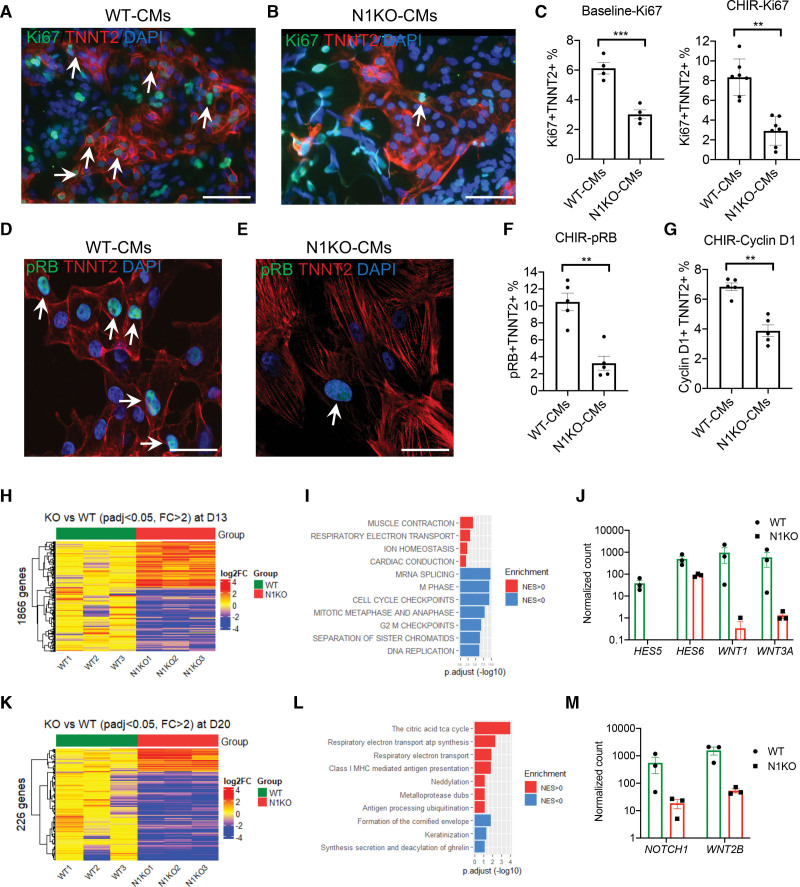
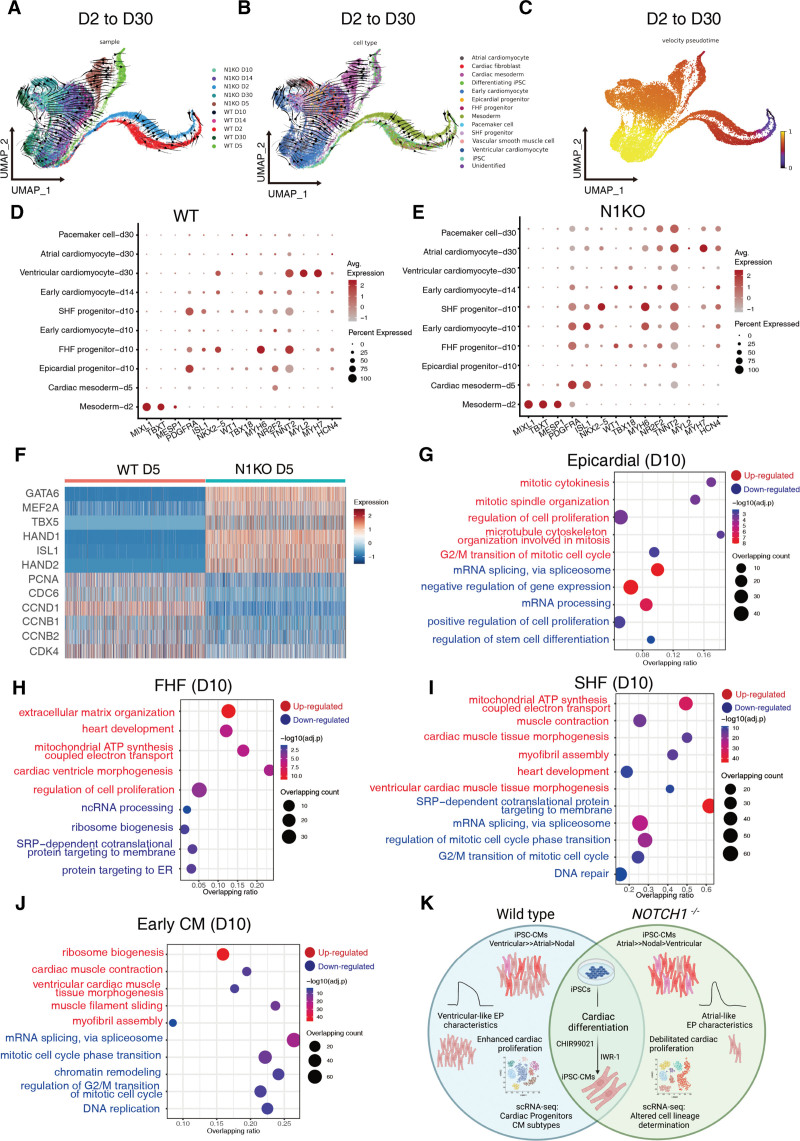
Results: Human NOTCH1 knockout induced pluripotent stem cells are able to generate functional cardiomyocytes and endothelial cells, suggesting that NOTCH1 is not required for mesoderm differentiation and cardiovascular development in vitro. However, disruption of NOTCH1 blocks human ventricular-like cardiomyocyte differentiation but promotes atrial-like cardiomyocyte generation through shortening the action potential duration. NOTCH1 deficiency leads to defective proliferation of early human cardiomyocytes, and transcriptomic analysis indicates that pathways involved in cell cycle progression and mitosis are downregulated in NOTCH1 knockout cardiomyocytes. Single-cell transcriptomic analysis reveals abnormal cell lineage determination of cardiac mesoderm, which is manifested by the biased differentiation toward epicardial and second heart field progenitors at the expense of first heart field progenitors in NOTCH1 knockout cell populations.

Conclusions: NOTCH1 is essential for human ventricular-like cardiomyocyte differentiation and proliferation through balancing cell fate determination of cardiac mesoderm and modulating cell cycle progression. Because first heart field progenitors primarily contribute to the left ventricle, we speculate that pathogenic NOTCH1 variants lead to biased differentiation of first heart field progenitors, blocked ventricular-like cardiomyocyte differentiation, and defective cardiomyocyte proliferation, which collaboratively contribute to left ventricular hypoplasia in hypoplastic left heart syndrome.

Keywords: NOTCH1; cardiac lineage differentiation; cardiomyocyte proliferation; hypoplastic left heart syndrome; induced pluripotent stem cells; mesoderm; single-cell RNA-seq.


Figures

Figure 1.
Figure 1.
Generation of NOTCH1 knockout (N1KO) human induced pluripotent stem cells (iPSCs) and endothelial differentiation. A, Schematic overview of deleting a 2.4-skb segment including exon 1 and exon 2 in the NOTCH1 gene using CRISPR (Clustered Regularly Interspaced Short Palindromic Repeats)/Cas9 genome editing. B, Quantitative PCR (qPCR) analysis shows mRNA levels in N1KO iPSCs (t test, n=3). C, Western blot indicates the absence of NOTCH1 in the homozygous N1KO iPSCs at the protein level. GAPDH is used as an internal control. D, Endothelial differentiation efficiency measured by the percentage of CD31+ cells at D10 of differentiation (1-way ANOVA, n=6). E, Expression of endothelial markers CD31 and CD144 in wild-type (WT) and N1KO iPSC-ECs. F, qPCR analysis shows reduced expression of arterial endothelial genes (DLL4 and EFNB2) and enhanced expression of venous endothelial genes (NR2F2 and EPHB4) in homozygous N1KO iPSC-ECs. G, qPCR data indicate downregulation of NOTCH1, NOTCH4, HEY1, and HEY2 in N1KO compared with WT iPSC-ECs (t test, n=3). All bar graphs show mean±SEM. *P<0.05, **P<0.01, ***P<0.001. Scale bars = 50 μm. EC indicates endothelial cell.
Figure 2.
Figure 2.
NOTCH1 deficiency suppresses ventricular-like cardiomyocyte differentiation and promotes atrial-like cardiomyocyte differentiation of human induced pluripotent stem cells (iPSCs). A, Days until onset of cardiomyocyte beating in the differentiation of NOTCH1 knockout (N1KO) and wild-type (WT) iPSCs (t test, n=8). B, Sarcomere structure is visualized by co-staining with antibodies against cardiac troponin T (TNNT2, in red) and α-actinin (in green). Nuclei are labeled by DAPI (in blue). Scale bars = 20 μm. C–G, Quantitative PCR (qPCR) analysis indicates that ventricular cardiomyocyte-specific marker genes (MYL2 [myosin regulatory light chain 2], IRX4 [iroquois homeobox protein 4]) are downregulated whereas atrial cardiomyocyte-specific marker genes (NR2F2, KCNJ3, MYL7) are upregulated in N1KO versus WT iPSC-CMs (t test, n=3 for each group). H, Ventricular-like iPSC-derived cardiomyocytes (iPSC-CMs) are identified by immunocytochemistry staining with antibodies against ventricular cardiomyocyte-specific marker MYL2 (in green) and pan-cardiomyocyte marker TNNT2 (in red). Nuclei are labeled by DAPI (in blue). Scale bars = 50 μm. I, Quantitative analysis of MYL2+TNNT2+ ventricular-like cardiomyocytes in N1KO and WT iPSC-CMs (t test, n=5). J, Percentages of TNNT2+ cardiomyocytes in the population of N1KO and WT iPSC-CMs revealed by flow cytometry (t test, n=3). K, Flow cytometry analysis shows the percentage of atrial-like cardiomyocytes (COUP-TFII+) is elevated in N1KO versus WT iPSC-CMs (t test, n=3). L, Seahorse analysis indicates that maximal respiration capacity is decreased in N1KO versus WT D30 iPSC-CMs. M, ATP production is reduced in N1KO compared with WT D30 iPSC-CMs (t test, n=16). All bar graphs and dot plots show mean±SEM. *P<0.05, **P<0.01. n.s. indicates not significant.
Figure 3.
Figure 3.
NOTCH1 disruption alters electrophysiological behaviors of human induced pluripotent stem cell-derived cardiomyocytes (iPSC-CMs) by shortening action potential durations. A, Representative ventricular-, atrial-, and nodal-like electrophysiological characteristics in iPSC-CMs inferred by optical mapping. B, Percentages of ventricular-, atrial-, and nodal-like cardiomyocytes in wild-type (WT) and NOTCH1 knockout (N1KO) iPSC-CMs. C and D, APD90, APD50, and APD90/APD50 in wild-type (WT; n=20) and N1KO (n=20) iPSC-CMs measured by whole-cell patch clamp (t test, n=20). E, Patch clamp analysis shows shortened repolarization phase in N1KO versus WT iPSC-CMs. F and G, Transient outward K+ current is increased in N1KO (F) compared with WT (G) iPSC-CMs. HJ, Delayed rectifier K+ current (IKr tail current) is increased in N1KO (H) versus WT (I) iPSC-CMs. KM, Inward Na+ currents are reduced in N1KO (K) compared with WT (L) iPSC-CMs across different member potentials. N and O, Amplitudes of inward Ca2+ currents are decreased in N1KO (N) versus WT (O) iPSC-CMs. Data are presented as mean±SEM. *P<0.05, **P<0.01.
Figure 4.
Figure 4.
Loss of function in NOTCH1 leads to defective proliferation of early cardiomyocytes. A and B, Immunofluorescence staining identifies dividing cardiomyocytes (Ki67+ TNNT2+) in wild-type (WT; A) and NOTCH1 knockout (N1KO; B) induced pluripotent stem cell-derived cardiomyocytes (iPSC-CMs). Arrows indicate proliferating cardiomyocytes. TNNT2 is labeled in red whereas Ki67 is marked in green. Nuclei are stained with DAPI in blue. Scale bars = 100 μm. C, Quantitative analysis of ratios of Ki67+ TNNT2+ versus TNNT2+ cardiomyocytes with and without CHIR99021 in WT and N1KO iPSC-CMs (t test, n=4 for baseline, n=7 for CHIR). D and E, Detection of dividing cardiomyocytes using antibodies against pRB and TNNT2 in WT (D) and N1KO (E) iPSC-CMs. Scale bars = 50 μm. F, Quantitative analysis of ratios of pRB+ TNNT2+ versus TNNT2+ cardiomyocytes in the presence of CHIR99021 in WT and N1KO iPSC-CMs (t test, n=5). G, Quantitative analysis of ratios of Cyclin D1+ TNNT2+ versus TNNT2+ cardiomyocytes in the presence of CHIR99021 in WT and N1KO iPSC-CMs (t test, n=5). H, Heatmap of 1866 differentially expressed genes between N1KO and WT D13 iPSC-CMs (fold change >2, false discovery rate [FDR]<0.05). I, Gene Set Enrichment Analysis (GSEA) shows pathways that are associated with differentially expressed genes (DEGs) between N1KO and WT D13 iPSC-CMs. Upregulated pathways (NES>0) are marked in red whereas downregulated (NES<0) pathways are labeled in blue. J, Downregulation of NOTCH and WNT signaling components in N1KO versus WT D13 iPSC-CMs (q-value <0.01, n=3). K, Two hundred twenty-six differentially expressed genes are identified between N1KO and WT D20 iPSC-CMs (fold change >2, FDR<0.05). L, Relevant pathways associated with upregulated and downregulated genes in N1KO versus WT D20 iPSC-CMs inferred by GSEA. M, Downregulation of WNT2B in N1KO versus WT D20 iPSC-CMs (q-value <0.01, n=3). Normalized counts are log10 transformed, and median values of WT samples are used for baseline transformation for each gene. Data are presented as mean±SEM. **P<0.01, ***P<0.001.
Figure 5.
Figure 5.
Single-cell transcriptomic analysis uncovers that NOTCH1 disruption alters cell lineage differentiation during human cardiac differentiation. A, Schematic summary showing sample collections during cardiac differentiation of human induced pluripotent stem cells (iPSCs) for scRNA-seq. B and C, Uniform manifold approximation and projection (UMAP) plotting shows the topological structures of D0, D2, D5, D10, D14, and D30 cell populations clustered by samples (B) and cell types (C). D, UMAP plotting of D10 wild-type (WT) and NOTCH1 knockout (N1KO) cells, which include epicardial progenitors, first heart field (FHF) progenitors, second heart field (SHF) progenitors, and committed cardiomyocytes. E and F, Percentages of various cell types in WT (E) and N1KO (F) differentiating cells at D10. G, UMAP plotting of D30 WT and N1KO cells which include ventricular-like cardiomyocytes, atrial-like cardiomyocytes, pacemaker-like cells, cardiac fibroblasts, and vascular smooth muscle cells. H and I, Percentages of respective cell types in WT (H) and N1KO (I) D30 cells. J and K, UMAP plotting shows the expression of pan-cardiomyocyte marker TNNT2 and ventricular cardiomyocyte marker MYL2 in WT (J) and N1KO (K) D30 cell populations.
Figure 6.
Figure 6.
Divergent developmental trajectories and differential gene expression profiles in cardiac mesoderm, cardiac progenitors, and early cardiomyocytes during differentiation of wild-type (WT) and NOTCH1 knockout (N1KO) induced pluripotent stem cells (iPSCs). AC, Uniform manifold approximation and projection (UMAP) plotting of overall developmental trajectories from induced pluripotent stem cells (iPSCs) to cardiomyocytes (D2 through D30) predicted by RNA velocity and clustered by samples (A), cell types (B), and pseudotime (C). D and E, Differential gene expression levels of cell type-specific markers and percentages of marker gene-positive cells in individual cell types in WT (D) and N1KO (E) samples. F, Heatmap of representative differentially expressed genes in D5 cardiac mesoderm between WT and N1KO. G through J, Upregulated and downregulated pathways that are enriched in D10 epicardial progenitors (G), first heart field (FHF) progenitors (H), second heart field (SHF) progenitors (I), and early cardiomyocytes (J) in N1KO versus WT samples. The x-axis shows the ratio of enriched pathways versus background. The y-axis represents the term of enriched pathways that are upregulated (in red) or downregulated (in blue). The sizes of the dots indicate the number of target genes in a given pathway whereas colors of the dots reflect log-transformed adjusted P. K, Graphic summary of this study. NOTCH1 disruption leads to skewed cardiac lineage differentiation and defective cardiomyocyte proliferation, possibly through balancing the cell fate determination of cardiac mesoderm towards epicardial, FHF, and SHF lineages, and modulating mitotic cell cycle progression in the early phase of cardiomyocyte expansion.

Comment in

References

    1. Bray SJ. Notch signalling: a simple pathway becomes complex. Nat Rev Mol Cell Biol. 2006;7:678–689. doi: 10.1038/nrm2009 - PubMed
    1. Kovall RA, Gebelein B, Sprinzak D, Kopan R. The canonical Notch signaling pathway: structural and biochemical insights into shape, sugar, and force. Dev Cell. 2017;41:228–241. doi: 10.1016/j.devcel.2017.04.001 - PMC - PubMed
    1. Siebel C, Lendahl U. Notch signaling in development, tissue homeostasis, and disease. Physiol Rev. 2017;97:1235–1294. doi: 10.1152/physrev.00005.2017 - PubMed
    1. Kopan R. Notch signaling. Cold Spring Harb Perspect Biol.2012;4:a011213. doi: 10.1101/cshperspect.a011213 - PMC - PubMed
    1. High FA, Epstein JA. The multifaceted role of Notch in cardiac development and disease. Nat Rev Genet. 2008;9:49–61. doi: 10.1038/nrg2279 - PubMed

Publication types

MeSH terms