

Performance of high-resolution CT for detection and discrimination tasks related to stenotic lesions - A phantom study using model observers
- PMID: 36583447
- PMCID: PMC11318568
- DOI: 10.1002/mp.16194
Performance of high-resolution CT for detection and discrimination tasks related to stenotic lesions - A phantom study using model observers
Abstract
Background: Accurate detection and grading of atheromatous stenotic lesions within the cardiac, renal, and intracranial vasculature is imperative for early recognition of disease and guiding treatment strategies.
Purpose: In this work, a stenotic lesion phantom was used to compare high resolution and normal resolution modes on the same CT scanner in terms of detection and size discrimination performance.
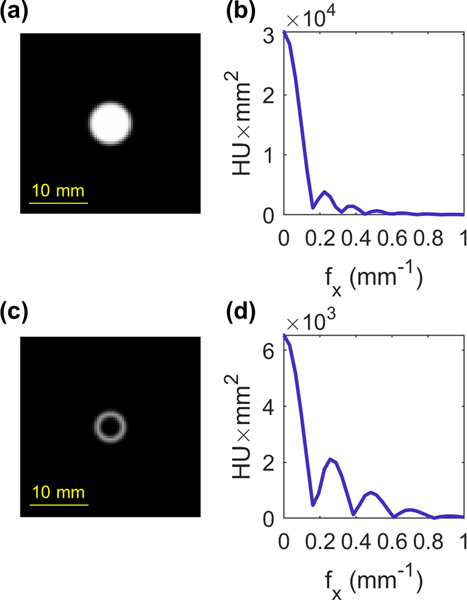
Materials and methods: The phantom is comprised of three acrylic cylinders (each 15.0 cm in diameter and 1.3 cm thick) with a matching array of holes in each module. The outer two modules contain holes that are slightly larger than the corresponding hole in the central module to simulate stenotic narrowing in vasculature. The stack of modules was submerged in an iodine solution simulating contrast-enhanced stenotic lesions with a range of lumen diameters (1.32-10.08 mm) and stenosis severity (0%, 50%, 60%, 70%, and 80%). The phantom was imaged on the Canon Aquilion Precision high-resolution CT scanner in high-resolution (HR) mode (0.25 mm × 0.50 mm detector element size) and normal-resolution (NR) mode (0.50 mm × 0.50 mm) using 120 kV and two dose levels (14 and 21 mGy SSDE) with 30 repeat scans acquired for each combination. Filtered back-projection (FBP) and a hybrid-iterative reconstruction (AIDR) were used with the FC18 kernel, as well as a deep learning algorithm (AiCE) which is only available for HR. A non-prewhitening model observer with an eye filter was implemented to quantify performance for detection and size discrimination tasks in the axial plane.
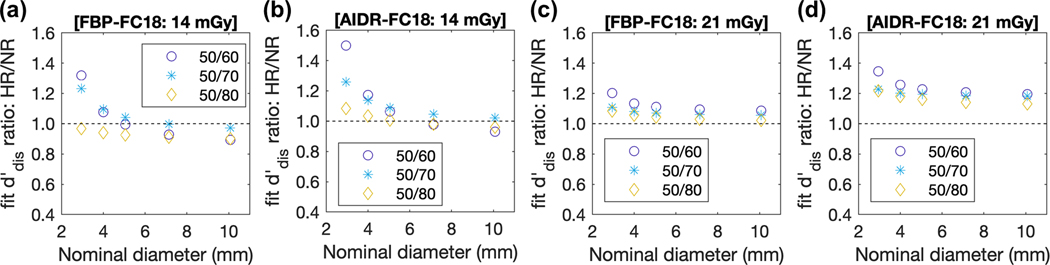
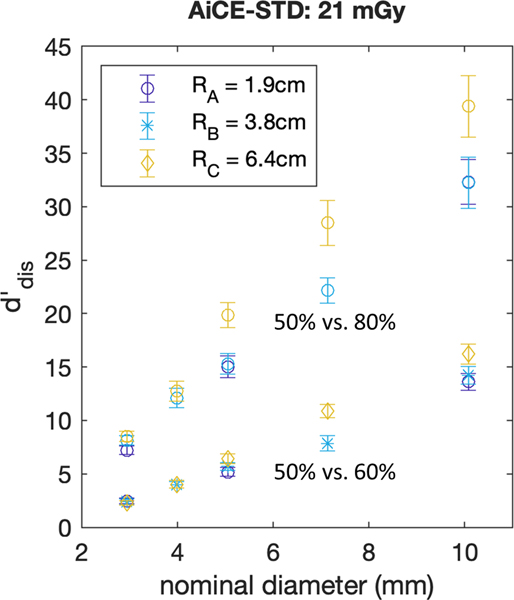
Results: Detection performance improved with increasing diameter, dose, and for AIDR in comparison to FBP for a fixed resolution mode. Performance in the HR mode was generally higher than NR for the smaller lumen diameters (1-5 mm) with decreasing differences as the diameter increased. Performance in NR mode surpassed HR mode for lumen diameters greater than ∼4 mm and ∼5 mm for 14 mGy and 21 mGy, respectively. AiCE provided consistently higher detection performance compared with AIDR-FC18 (48% higher for a 6 mm lumen diameter). Discrimination performance increased with increasing nominal diameter, dose, and for larger differences in stenosis severity. When comparing discrimination performance in HR to NR modes, the largest relative differences occur at the smallest nominal diameters and smallest differences in stenosis severity. The AiCE reconstruction algorithm produced the highest overall discrimination performance values, and these were significantly higher than AIDR-FC18 for nominal diameters of 7.14 and 10.08 mm.
Conclusions: HR mode outperforms NR for detection up to a specific diameter and the results improve with AiCE and for higher dose levels. For the task of size discrimination, HR mode consistently outperforms NR if AIDR-FC18 is used for dose levels of at least 21 mGy, and the results improve with AiCE and for the smallest differences in stenosis severity investigated (50% vs. 60%). High-resolution CT appears to be beneficial for detecting smaller simulated lumen diameters (<5 mm) and is generally advantageous for discrimination tasks related to stenotic lesions, which inherently contain information at higher frequencies, given the right reconstruction algorithm and dose level.
© 2022 American Association of Physicists in Medicine.
Conflict of interest statement
CONFLICT OF INTERESTS
Author J.M.B. is a director and shareholder in Izotropic Corporation. Authors C.K.A. and A.M.H. are consultants for Izotropic Corporation.The research was also supported in part by a research grant No. R01 EB025829 from the National Institute of Biomedical Imaging and Bioengineering, and a research grant No. R01 CA181081 from the National Cancer Institute. In his role as editor-in chief for Medical Physics, author J.M.B. was blinded to the review process and had no role in decisions pertaining to this manuscript.
Figures


References
-
- North American Symptomatic Carotid Endarterectomy Trial C, Barnett HJM, Taylor DW, et al. Beneficial effect of carotid endarterectomy in symptomatic patients with high-grade carotid stenosis. N Engl J Med. 1991;325(7):445–453. - PubMed
-
- MRC European Carotid Surgery Trial: interim results for symptomatic patients with severe (70–99%) or with mild (0–29%) carotid stenosis. European Carotid Surgery Trialists’ Collaborative Group. Lancet. 1991;337(8752):1235–1243. - PubMed
-
- Bartlett ES, Walters TD, Symons SP, Fox AJ. Carotid stenosis index revisited with direct CT angiography measurement of carotid arteries to quantify carotid stenosis. Stroke. 2007;38(2):286–291. - PubMed
