. 2023 Feb;212(1):103-122.
doi: 10.1007/s00430-022-00760-7. Epub 2022 Dec 30.

Intrinsic D614G and P681R/H mutations in SARS-CoV-2 VoCs Alpha, Delta, Omicron and viruses with D614G plus key signature mutations in spike protein alters fusogenicity and infectivity

Affiliations

Intrinsic D614G and P681R/H mutations in SARS-CoV-2 VoCs Alpha, Delta, Omicron and viruses with D614G plus key signature mutations in spike protein alters fusogenicity and infectivity

Ritika Khatri et al. Med Microbiol Immunol. 2023 Feb.

Abstract

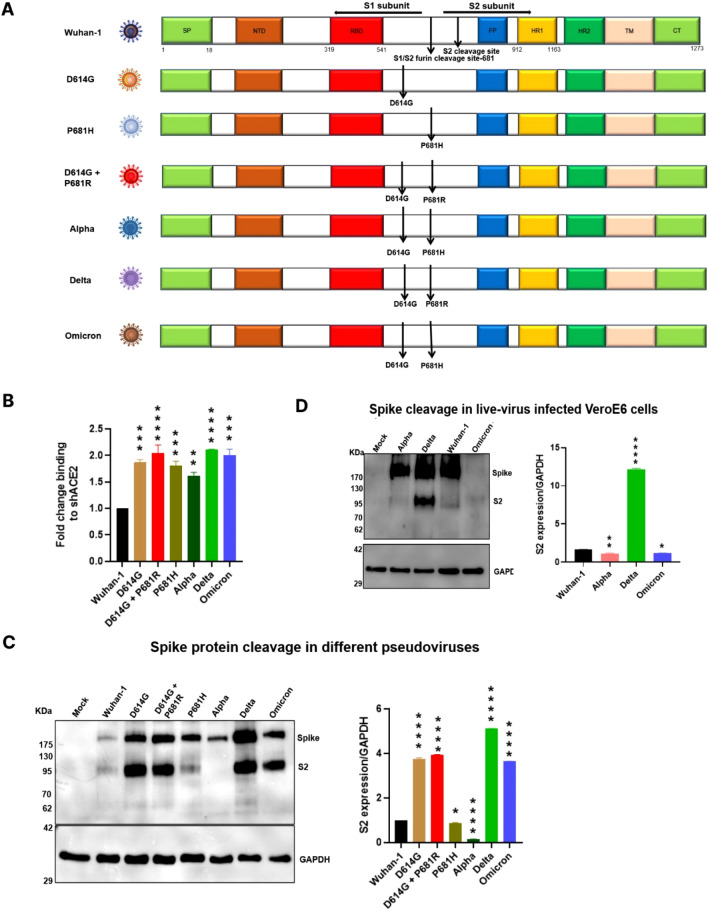
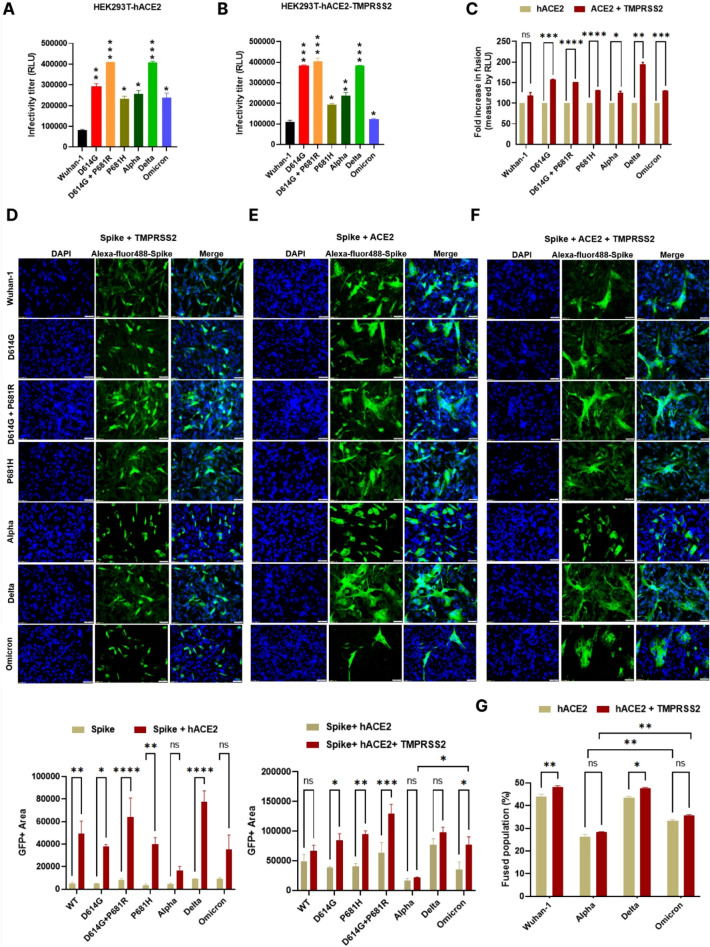
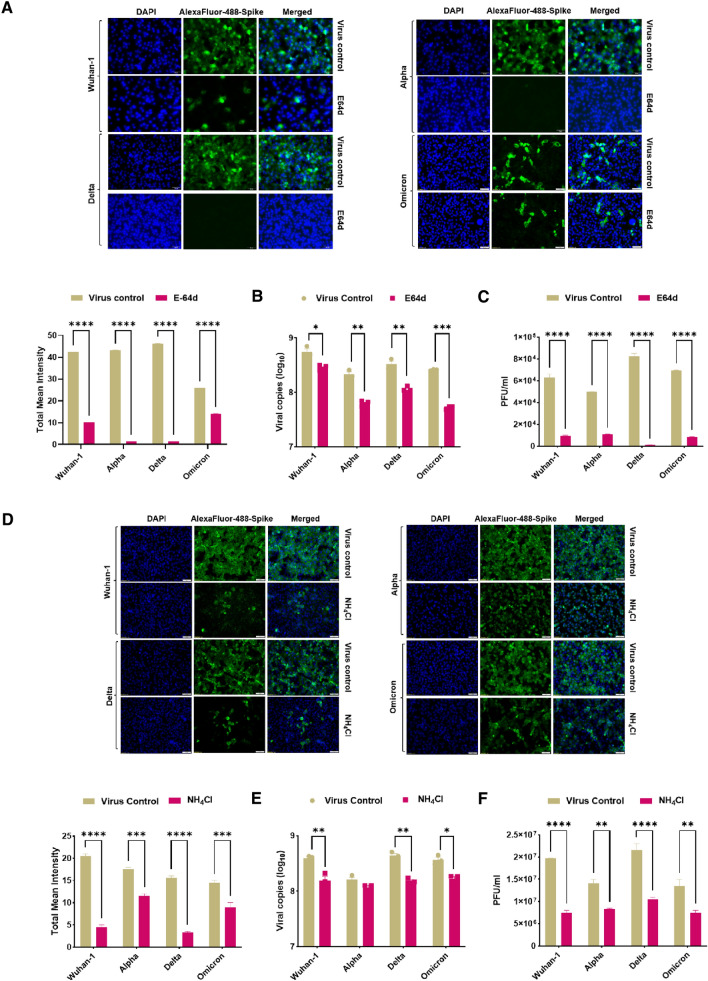
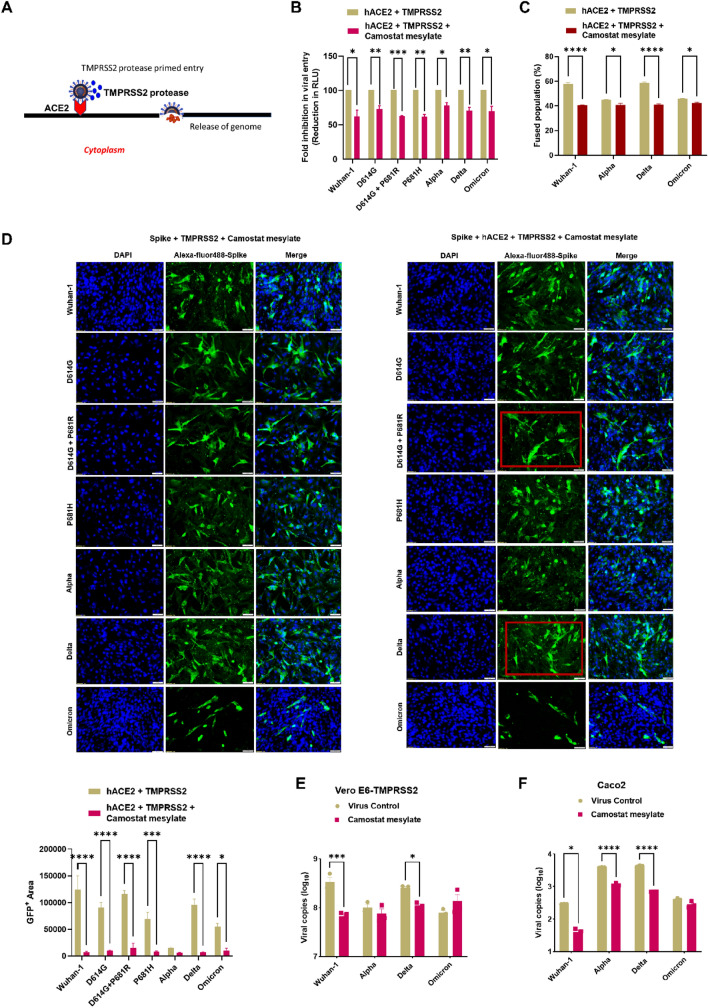
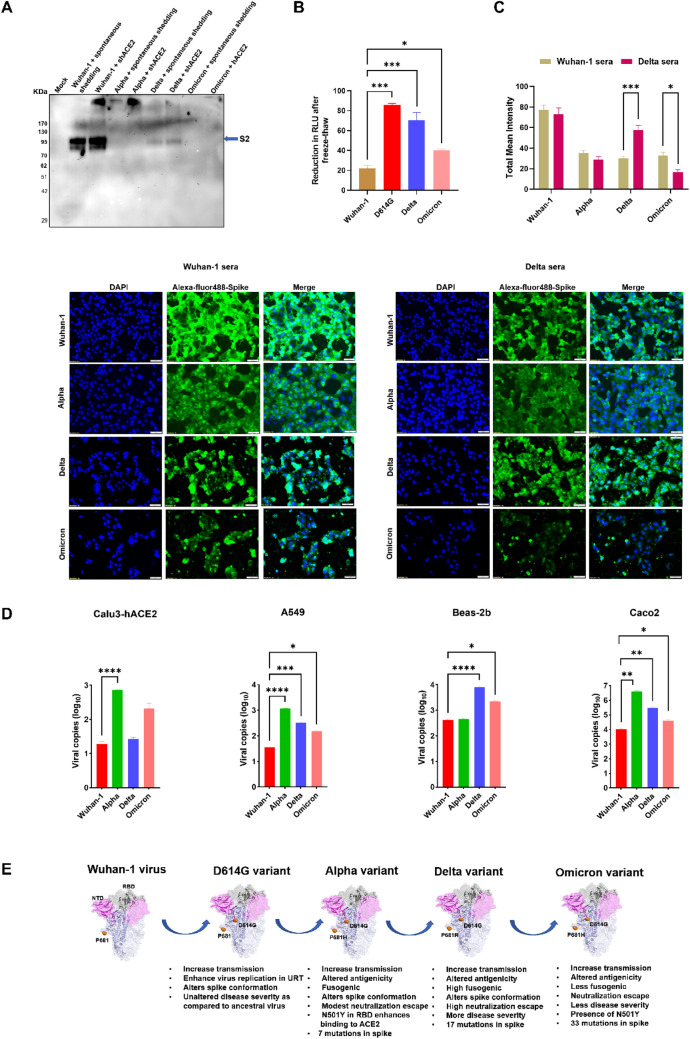
The SARS-CoV-2 virus has been rapidly evolving over the time and the genetic variation has led to the generation of Variants of Concerns (VoC), which have shown increased fitness. These VoC viruses contain the key mutations in the spike protein which have allowed better survival and evasion of host defense mechanisms. The D614G mutation in the spike domain is found in the majority of VoC; additionally, the P681R/H mutation at the S1/S2 furin cleavage site junction is also found to be highly conserved in major VoCs; Alpha, Delta, Omicron, and its' current variants. The impact of these genetic alterations of the SARS-CoV-2 VoCs on the host cell entry, transmissibility, and infectivity has not been clearly identified. In our study, Delta and D614G + P681R synthetic double mutant pseudoviruses showed a significant increase in the cell entry, cell-to-cell fusion and infectivity. In contrast, the Omicron and P681H synthetic single mutant pseudoviruses showed TMPRSS2 independent cell entry, less fusion and infectivity as compared to Delta and D614G + P681R double mutants. Addition of exogenous trypsin further enhanced fusion in Delta viruses as compared to Omicron. Furthermore, Delta viruses showed susceptibility to both E64d and Camostat mesylate inhibitors suggesting, that the Delta virus could exploit both endosomal and TMPRSS2 dependent entry pathways as compared to the Omicron virus. Taken together, these results indicate that the D614G and P681R/H mutations in the spike protein are pivotal which might be favoring the VoC replication in different host compartments, and thus allowing a balance of mutation vs selection for better long-term adaptation.

Keywords: Delta; Infectivity; Omicron; SARS-CoV-2 variants of concern; Virus entry.


Figures

Fig. 1
Fig. 1
Expression and cleavage of SARS-CoV-2 variants and synthetic mutants. A Schematic representation of Wuhan-1, Alpha, Delta, and Omicron spike proteins with D614G and P681R/H mutations and synthetic mutants, the signal peptide (green box), S1-N terminal domain NTD (brown box), receptor binding domain (red box), fusion peptide (blue box), heptad repeat 1 (yellow box), heptad repeat 2 (dark green box), transmembrane domain TM (cream box), cytoplasmic tail CT (green box), S1/S2 and S2′ cleavage site, presence of D614G, P681H/R mutation. B Surface expressed spike protein binding to soluble-hACE2 was analyzed by expressing the spike of variants and mutants in HEK293T cells and 36 h post transfection incubated with soluble-hACE2 and analyzed by flow cytometry. Statistical significance was determined using t test keeping Wuhan-1 as the control. The experiment was repeated twice and the error bars show mean values with SEM. C Detection of spike protein cleavage in different pseudoviruses at 24 h post transfection. Briefly, the pseudoviruses were produced in 293 T cells pseudotyped with various S glycoproteins, 24 h post transfection cell lysates were prepared for the western blot analysis and probed with anti-spike (Wuhan-1) mouse polyclonal sera and anti-GAPDH antibodies. Statistical significance was determined using one-way ANOVA keeping Wuhan-1 as the control. The experiment was repeated three times and the error bars show mean values with SEM. D. SARS-CoV-2 live viruses were infected at 0.1 MOI in VeroE6 cells and at 24 h post infection cell extracts were collected by lysing with RIPA lysis buffer, and spike protein was detected by western blot analysis and probed with anti-spike (Wuhan-1) mouse polyclonal sera and anti-GAPDH antibodies. GAPDH was used as a loading control for both pseudovirus and live virus analysis. The experiment was repeated twice. Statistical significance was determined using one-way ANOVA keeping Wuhan-1 as the control (P < 0.05), where (P < 0.05), *P < 0.05, **P < 0.01, ***P < 0.001, ****P < 0.0001 were considered significant and P > 0.05 was considered nonsignificant (ns)
Fig. 2
Fig. 2
Infectivity titer and fusion of pseudovirus variants and mutants. A Pseudoviruses are produced in HEK293T cells, and infectivity was measured in the HEK293T cells overexpressing hACE2 (NR52511, BEI resources, USA). Statistical significance was determined using t test keeping Wuhan-1 as the control. The experiment was repeated three times and the error bars show mean values with SEM. B HEK293T cells overexpressing hACE2 and TMPRSS2 (HEK293T cells transfected TMPRSS2 plasmid and harvested 24 h post transfection and used in the assay) were infected with pseudoviruses, and the infectivity titer was measured 48 h post infection as relative luciferase units (RLU). Statistical significance was determined using t test keeping Wuhan-1 as the control. The experiment was repeated three times and the error bars show mean values with SEM. C Quantitative fusion assay in the presence of hACE2 or hACE2 + TMPRSS2 as measured by RLU. The data shown are the averages of three experiments in duplicates. Statistical significance was determined using two-way ANOVA, with multiple comparisons using hACE2 expression as control. The error bars show mean values with SEM. D Spike and TMPRSS2 plasmids were co-transfected into BHK-21 cells and probed with anti-Spike mouse polyclonal sera (1:200) and Alexa Fluor 488-labeled anti-mouse antibody (green) (1:1000) 36 h post transfection. E. Spike and hACE2 plasmids were co-transfected into BHK-21 cells, and fusion formation was shown by immunofluorescence. The data shown are the averages of three experiments in duplicates. Statistical significance was determined using two-way ANOVA, with multiple comparisons using spike expression as control. The error bars show mean values with SEM. F. Spike, hACE2 and TMPRSS2 plasmids were co-transfected into BHK-21 cells and fusion and syncytia formation was measured 24 h post transfection. The images were taken with an Olympus fluorescence microscope and quantification was done by comparing three randomly selected GFP + areas. The experiments were repeated three times. The nuclei were stained with 4′,6-diamidino-2-phenylindole (DAPI, blue); scale bar: 50 μm and magnification × 20. The data shown are the averages of three experiments in duplicates. Statistical significance was determined using two-way ANOVA, with multiple comparisons using hACE2 expression as control. The error bars show mean values with SEM. G. FACS based dual dye assay to measure fusion in the presence of hACE2 and hACE2 + TMPRSS2. Spike expressing cells were stained with orange dye, and hACE2 and hACE2 + TMPRSS2 cells with green dye. Orange and green dyed cells were incubated in equal ratio for 8 h, fixed and then acquired on BD FACS Canto II and analyzed on FlowJo. Statistical significance was determined using t test. The experiment was repeated three times and the error bars show mean values with SEM. Where (P < 0.05), *P < 0.05, **P < 0.01, ***P < 0.001, ****P < 0.0001 were considered significant and P > 0.05 was considered nonsignificant (ns)
Fig. 3
Fig. 3
VoC and mutants pseudoviruses cell tropism and effect of trypsin in fusion and cleavage. A Pseudovirus entry was measured in HEK293T cells transfected with either hACE2 or hACE2 + TMPRSS2. Thirty-six h post transfection, HEK293T cells expressing hACE2 or hACE2 + TMPRSS2 were infected with variants and synthetic pseudoviruses, and relative luciferase titers were measured 48 h post transfection. The experiments were repeated two times in triplicates. Statistical significance was determined using two-way ANOVA, with multiple comparisons using Wuhan-1 as control. The error bars show mean values with SEM. B FACS based dual dye assay to measure fusion in the presence of hACE2 and hACE2 + Trypsin. Spike expressing cells were stained with orange dye, and hACE2 and hACE2 + Trypsin (2 mg/ml) cells with green dye. Orange and green dyed cells were incubated in equal ratio for 8 h, fixed and then acquired on BD FACS Canto II and analyzed on FlowJo. The experiment was repeated three times. Statistical significance was determined using two-way ANOVA, with multiple comparisons using hACE2 expression as control. The error bars show mean values with SEM. C Fusion and syncytial formation as measured by immunofluorescence assay in BHK-21 cells co-transfected with spike and hACE2 plasmids in the presence of trypsin. The experiment was repeated two times. Statistical significance was determined using two-way ANOVA, with multiple comparisons using spike + hACE2 expression as control. The error bars show mean values with SEM. D. Cleavage of Wuhan-1, Alpha, Delta and Omicron variant spike proteins in the presence and absence of trypsin as analyzed by Western blot after normalizing with GAPDH signal. The experiment was repeated three times. The error bars show mean values with SEM. Statistical significance was determined by using t test using spike expression without trypsin as control. Where P < 0.05, *P < 0.05, **P < 0.01, ***P < 0.001, and ****P < 0.0001 were considered significant and P > 0.05 was considered nonsignificant (ns)
Fig. 4
Fig. 4
Analysis of variant entry and fusion in the presence of cysteine protease inhibitor. A Schematic representing hACE2-mediated endosomal entry and activation by cysteine protease in endosomes. B Pseudovirus entry in the absence or presence of the cysteine protease inhibitor E64d. The data represent mean of two experiments repeated in triplicate. Statistical significance was determined using two-way ANOVA, with multiple comparisons using hACE2 expression as control. The error bars show mean values with SEM. C Fusion of variants of spike proteins co-expressed with hACE2 in the presence of E64d in BHK-21 cells. The experiment was repeated three times. Statistical significance was determined using two-way ANOVA, with multiple comparisons using hACE2 expression without E-64d as control. The error bars show mean values with SEM. D Fusion of variants spike proteins co-expressed with ACE2 in the presence of NH4Cl in BHK-21 cells. The spike protein was probed with primary anti-Spike mouse polyclonal sera (1:200) (Wuhan-1 spike protein) and Alexa Fluor 488-labeled anti-mouse secondary antibody (green) (1:1000) at 24 h post transfection. The images were taken with an Olympus fluorescence microscope. The nuclei were stained with 4′,6-diamidino-2-phenylindole (DAPI, blue); scale bar: 50 μm and magnification × 20. The experiment was repeated three times. Statistical significance was determined using two-way ANOVA, with multiple comparisons using hACE2 expression without NH4Cl as control. The error bars show mean values with SEM. E, F FACS based dual dye assay to measure fusion in the presence of hACE2 and hACE2 + E-64d/NH4Cl. Spike expressing cells were stained with orange dye, and hACE2 and hACE2 + E-64d/NH4Cl cells with green dye. Orange and green dyed cells were incubated in equal ratio for 8 h, fixed and then acquired on BD FACS Canto II and analyzed on FlowJo. Statistical significance was determined using two-way ANOVA with multiple comparisons using ACE2 expression without inhibitor as control. Where P < 0.05, *P < 0.05, **P < 0.01, ***P < 0.001, and ****P < 0.0001 were considered significant and P > 0.05 was considered nonsignificant (ns)
Fig. 5
Fig. 5
Effect of E64d and NH4Cl in Wuhan-1 and VoC live viruses’ infection. A Immunofluorescence assay for SARS-CoV-2 variants’ infection in VeroE6 cell line in the absence or presence of the inhibitor E64d. Briefly, live viruses were infected in Vero E6 cells with 0.1 MOI And 24 h post infection, cells were fixed with 4% paraformaldehyde and the SARS-CoV-2 spike protein was probed with primary anti-Spike mouse polyclonal sera (1:200) (Wuhan-1 spike protein) and Alexa Fluor 488-labeled anti-mouse secondary antibody (green) (1:1000). The images were taken with an Olympus fluorescence microscope. The nuclei were stained with 4′,6-diamidino-2-phenylindole (DAPI, blue); scale bar: 50 μm and magnification 20 × . The experiment was repeated three times. Statistical significance was determined using two-way ANOVA, with multiple comparisons using virus control as control. The error bars show mean values with SEM. B, C. VeroE6 cells were seeded and infected as mentioned above in the presence of E-64d. Cell lysates were harvested with trizol post 48 h of infection and relative copy number of SARS-CoV-2 N gene was estimated by quantitative RT-PCR keeping GAPDH or β-actin genes as an endogenous control for normalization. Cell supernatant was serially diluted and VeroE6 cells were infected to determine plaque forming units (Pfu/ml). The experiment was repeated three times. Statistical significance was determined using two-way ANOVA, with multiple comparisons using virus control as control. The error bars show mean values with SEM. D Immunofluorescence assay for SARS-CoV-2 variants’ infection in VeroE6 cell line in the absence or presence of the NH4Cl. Live viruses were infected in Vero E6 cells with 0.1 MOI and 24 h post infection, cells were fixed, stained and imaged as mentioned above. The experiment was repeated three times. Statistical significance was determined using two-way ANOVA, with multiple comparisons using virus control as control. The error bars show mean values with SEM. E, F VeroE6 cells were seeded and infected as mentioned above in the presence of NH4Cl. Cell lysates were harvested with trizol post 48 h of infection and relative copy number of SARS-CoV-2 N gene was estimated by quantitative RT-PCR keeping GAPDH or β-actin genes as an endogenous control for normalization. Cell supernatant was serially diluted and VeroE6 cells were infected to determine plaque forming units (Pfu/ml). The experiment was repeated three times. Statistical significance was determined using two-way ANOVA, with multiple comparisons using virus control as control. The error bars show mean values with SEM. Where P < 0.05, *P < 0.05, **P < 0.01, ***P < 0.001, and ****P < 0.0001 were considered significant and P > 0.05 was considered nonsignificant (ns)
Fig. 6
Fig. 6
Analysis of variant entry and fusion in the presence of the serine protease TMPRSS2 inhibitor. A Graphical representation of TMPRSS2 mediated spike cleavage and cell entry. B Pseudovirus entry in the absence or presence of Camostat mesylate inhibitor when spike co-expressed along with hACE2 and TMPRSS2. The experiments were repeated three times. Statistical significance was determined using two-way ANOVA, with multiple comparisons using hACE2 + TMPRSS2 as control. The error bars show mean values with SEM. B Fusion of variants of spike proteins co-expressed with TMPRSS2 in the presence of Camostat mesylate in BHK-21 cells. C FACS based dual dye assay to measure fusion in the presence of hACE2 + TMPRSS2 + Camostat mesylate. Spike expressing cells were stained with orange dye, and hACE2 + TMPRSS2 + Camostat mesylate cells with green dye. Orange and green dyed cells were incubated in equal ratio for 8 h, fixed and then acquired on BD FACS Canto II and analyzed on FlowJo. The experiments were repeated three times. Statistical significance was determined using t test using hACE2 + TMPRSS2 as control. The error bars show mean values with SEM. D. Fusion of variants spike proteins co-expressed with TMPRSS2 and or hACE2 + TMPRSS2 in the presence of Camostat mesylate in BHK-21 cells. The spike protein was probed with primary anti-Spike mouse polyclonal sera (1:200) (Wuhan-1 spike protein) and Alexa Fluor 488-labeled anti-mouse secondary antibody (green) (1:1000) at 24 h post transfection. The images were taken with an Olympus fluorescence microscope. The experiments were repeated three times. The nuclei were stained with 4′,6-diamidino-2-phenylindole (DAPI, blue); scale bar: 50 μm and magnification × 20. The experiments were repeated three times. Statistical significance was determined using two-way ANOVA, with multiple comparisons using hACE2 + TMPRSS2 as control. The error bars show mean values with SEM. E, F VeroE6 overexpressing TMPRSS2 and Caco2 cells were seeded and infected as mentioned earlier in the presence of Camostat mesylate. Cell lysates were harvested with trizol post 48 h of infection and relative copy number of SARS-CoV-2 N gene was estimated by quantitative RT-PCR keeping GAPDH or β-actin genes as an endogenous control for normalization. The experiments were repeated two times. Statistical significance was determined using two-way ANOVA, with multiple comparisons using hACE2 + TMPRSS2 as control. The error bars show mean values with SEM. Where P < 0.05, *P < 0.05, **P < 0.01, ***P < 0.001, and ****P < 0.0001 were considered significant and P > 0.05 was considered nonsignificant (ns)
Fig. 7
Fig. 7
Stability, shedding, antigenicity and characteristics of variants with D614G and P681R/H mutations. A Assessment of soluble-hACE2 induced and spontaneous shedding of the S1 domain as measured by Western blot. B Measurement of infectivity titers of Wuhan-1, D614G, Delta and Omicron pseudoviruses in HEK293T-hACE2 cell lines after two freeze–thaw cycles. The experiments were repeated two times. Statistical significance was determined using one-way ANOVA, with multiple comparisons using Wuhan-1 as control. The error bars show mean values with SEM. C Cross reactivity of Omicron spikes to anti-Wuhan-1 RBD and anti-Delta RBD polyclonal mouse sera as measured by immunofluorescence in BHK-21 cells. Briefly, spike protein was transfected into the BHK-21 cell line, and 24 h post transfection, the cells were fixed and probed with anti-RBD (Wuhan-1) or anti-Delta RBD polyclonal mouse sera (1:200 dilution) and Alexa Fluor 488-labeled anti-mouse secondary antibody (green) (1:1000 dilution). The images were taken with an Olympus fluorescence microscope. The nuclei were stained with 4′,6-diamidino-2-phenylindole (DAPI, blue); scale bar: 50 μm and magnification × 20. The experiments were repeated two times. Statistical significance was determined using two-way ANOVA, with multiple comparisons using Wuhan-1 sera as control. The error bars show mean values with SEM. D Calu3-hACE2, A549, Beas-2b and Caco-2 cells were infected with Wuhan-1, Alpha, Delta, and Omicron viruses at 0.1 MOI. Cell lysates were harvested with trizol post 48 h of infection and relative copy number of SARS-CoV-2 N gene was estimated by quantitative RT-PCR keeping GAPDH or β-actin genes as an endogenous control for normalization. The experiments were repeated three times. Statistical significance was determined using one-way ANOVA, with multiple comparisons using Wuhan-1 as control, where (P < 0.05), *P < 0.05, **P < 0.01, ***P < 0.001, and ****P < 0.0001 were considered significant and P > 0.05 was considered nonsignificant (ns). The error bars show mean values with SEM. E Structural modeling of the spike protein was created by using PYMOL software. Pink represents the N-terminal domain and gray RBD domain, orange dots, D614G and P681H/R mutations. The evolution of virus and variant characteristics are schematically represented

References

    1. Kahn JS, McIntosh K. History and recent advances in coronavirus discovery. Pediatr Infect Dis J. 2005 doi: 10.1097/01.INF.0000188166.17324.60. - DOI - PubMed
    1. Otto SP, Day T, Arino J, et al. The origins and potential future of SARS-CoV-2 variants of concern in the evolving COVID-19 pandemic. Curr Biol. 2021;31:R918. doi: 10.1016/J.CUB.2021.06.049. - DOI - PMC - PubMed
    1. Papanikolaou V, Chrysovergis A, Ragos V, et al. From Delta to Omicron: S1-RBD/S2 mutation/deletion equilibrium in SARS-CoV-2 defined variants. Gene. 2022;814:146134. doi: 10.1016/J.GENE.2021.146134. - DOI - PMC - PubMed
    1. Centers for Disease Control and Prevention Morbidity and mortality weekly report SARS-CoV-2 B.1.1.529 (Omicron) Variant-United States. Morb Mortal Wkly Rep. 2021;70:1731–1734. - PMC - PubMed
    1. Tegally H, Moir M, Everatt J, et al. Emergence of SARS-CoV-2 Omicron lineages BA.4 and BA.5 in South Africa. Nat Med. 2022 doi: 10.1038/S41591-022-01911-2. - DOI - PMC - PubMed

Substances