

Exercise-related hemoconcentration and hemodilution in hydrated and dehydrated athletes: An observational study of the Hungarian canoeists
- PMID: 36584041
- PMCID: PMC9803156
- DOI: 10.1371/journal.pone.0277978
Exercise-related hemoconcentration and hemodilution in hydrated and dehydrated athletes: An observational study of the Hungarian canoeists
Abstract
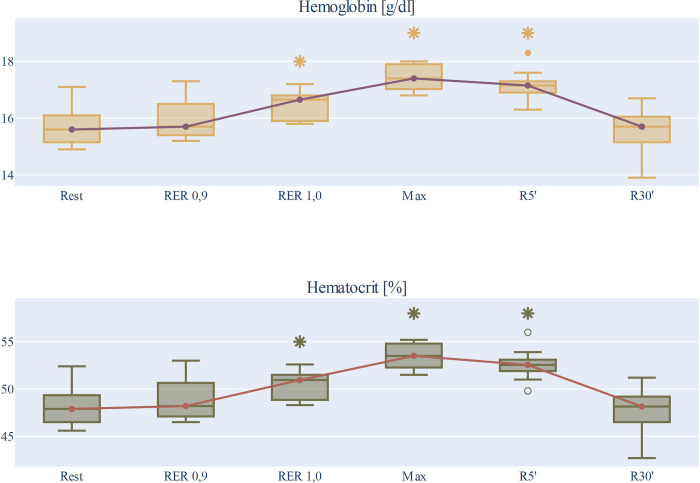
Hemoconcentration during exercise is a well-known phenomenon, however, the extent to which dehydration is involved is unclear. In our study, the effect of dehydration on exercise-induced hemoconcentration was examined in 12 elite Hungarian kayak-canoe athletes. The changes of blood markers were examined during acute maximal workload in hydrated and dehydrated states. Dehydration was achieved by exercise, during a 120-minute extensive-aerobic preload. Our research is one of the first studies in which the changes in blood components were examined with a higher time resolution and a wider range of the measured parameters. Hydration status had no effect on the dynamics of hemoconcentration during both the hydrated (HS) and dehydrated (DHS) load, although lower maximal power output were measured after the 120-minute preload [HS Hemoglobin(Hgb)Max median 17.4 (q1 17.03; q3 17.9) g/dl vs. DHS HgbMax median 16.9 (q1 16.43; q3 17.6) g/dl (n.s); HS Hematocrit(Hct)Max 53.50 (q1 52.28; q3 54.8) % vs. DHS HctMax 51.90 (q1 50.35; q3 53.93) % (n.s)]. Thirty minutes after the maximal loading, complete hemodilution was confirmed in both exercises. Dehydration had no effect on hemoconcentration or hemodilution in the recovery period [HS HgbR30' 15.7 (q1 15.15; q3 16.05) g/dl (n.s.) vs. DHS HgbR30' 15.75 (q1 15.48; q3 16.13) g/dl (n.s.), HS HctR30' 48.15 (q1 46.5; q3 49.2) % vs. DHS HctR30' 48.25 (q1 47.48; q3 49.45) % (n.s.)], however, plasma osmolality did not follow a corresponding decrease in hemoglobin and hematocrit in the dehydrated group. Based on our data, metabolic products (glucose, lactate, sodium, potassium, chloride, bicarbonate ion, blood urea nitrogen) induced osmolality may not play a major role in the regulation of hemoconcentration and post-exercise hemodilution. From our results, we can conclude that hemoconcentration depends mainly on the intensity of the exercise.
Copyright: © 2022 Komka et al. This is an open access article distributed under the terms of the Creative Commons Attribution License, which permits unrestricted use, distribution, and reproduction in any medium, provided the original author and source are credited.
Conflict of interest statement
The authors have declared that no competing interests exist.
Figures


Similar articles
-
High-Resolution Dynamics of Hemodilution After Exercise-Related Hemoconcentration.Int J Sports Physiol Perform. 2022 Apr 1;17(4):576-585. doi: 10.1123/ijspp.2021-0133. Epub 2022 Feb 7. Int J Sports Physiol Perform. 2022. PMID: 35130513
-
Effects of acute and chronic hematocrit modulations on blood viscosity in endurance athletes.Clin Hemorheol Microcirc. 2016 Nov 25;64(2):115-123. doi: 10.3233/CH-162050. Clin Hemorheol Microcirc. 2016. PMID: 26890244
-
Effect of mild dehydration on the lactate threshold in women.Med Sci Sports Exerc. 2000 Feb;32(2):396-402. doi: 10.1097/00005768-200002000-00021. Med Sci Sports Exerc. 2000. PMID: 10694123
-
Effects on thermal stress and exercise on blood volume in humans.Physiol Rev. 1985 Jan;65(1):149-209. doi: 10.1152/physrev.1985.65.1.149. Physiol Rev. 1985. PMID: 3880897 Review.
-
Dehydration and rehydration in competative sport.Scand J Med Sci Sports. 2010 Oct;20 Suppl 3:40-7. doi: 10.1111/j.1600-0838.2010.01207.x. Scand J Med Sci Sports. 2010. PMID: 21029189 Review.
Cited by
-
Miswired Proprioception in Amyotrophic Lateral Sclerosis in Relation to Pain Sensation (and in Delayed Onset Muscle Soreness)-Is Piezo2 Channelopathy a Principal Transcription Activator in Proprioceptive Terminals Besides Being the Potential Primary Damage?Life (Basel). 2023 Feb 27;13(3):657. doi: 10.3390/life13030657. Life (Basel). 2023. PMID: 36983813 Free PMC article.
-
Acid-Base and Electrolyte Balance Responses in the Performance of Female Ultramarathon Runners in a 45 km Mountain Race.Nutrients. 2025 Feb 20;17(5):751. doi: 10.3390/nu17050751. Nutrients. 2025. PMID: 40077621 Free PMC article.
-
The Influence of Various Hydration Strategies (Isotonic, Water, and No Hydration) on Hematological Indices, Plasma Volume, and Lactate Concentration in Young Men during Prolonged Cycling in Elevated Ambient Temperatures.Biology (Basel). 2023 May 7;12(5):687. doi: 10.3390/biology12050687. Biology (Basel). 2023. PMID: 37237501 Free PMC article.
-
Orthostasis Is Impaired Due to Fatiguing Intensive Acute Concentric Exercise Succeeded by Isometric Weight-Loaded Wall-Sit in Delayed-Onset Muscle Soreness: A Pilot Study.Sports (Basel). 2023 Oct 27;11(11):209. doi: 10.3390/sports11110209. Sports (Basel). 2023. PMID: 37999426 Free PMC article.
-
LF Power of HRV Could Be the Piezo2 Activity Level in Baroreceptors with Some Piezo1 Residual Activity Contribution.Int J Mol Sci. 2023 Apr 11;24(8):7038. doi: 10.3390/ijms24087038. Int J Mol Sci. 2023. PMID: 37108199 Free PMC article.
References
Publication types
MeSH terms
Substances
LinkOut - more resources
Full Text Sources
Medical
Miscellaneous
