. 2022 Dec 30;17(12):e0279548.
doi: 10.1371/journal.pone.0279548. eCollection 2022.

Ancient multiplicity in cyclic nucleotide-gated (CNG) cation channel repertoire was reduced in the ancestor of Olfactores before re-expansion by whole genome duplications in vertebrates

Affiliations

Ancient multiplicity in cyclic nucleotide-gated (CNG) cation channel repertoire was reduced in the ancestor of Olfactores before re-expansion by whole genome duplications in vertebrates

David Lagman et al. PLoS One. .

Abstract

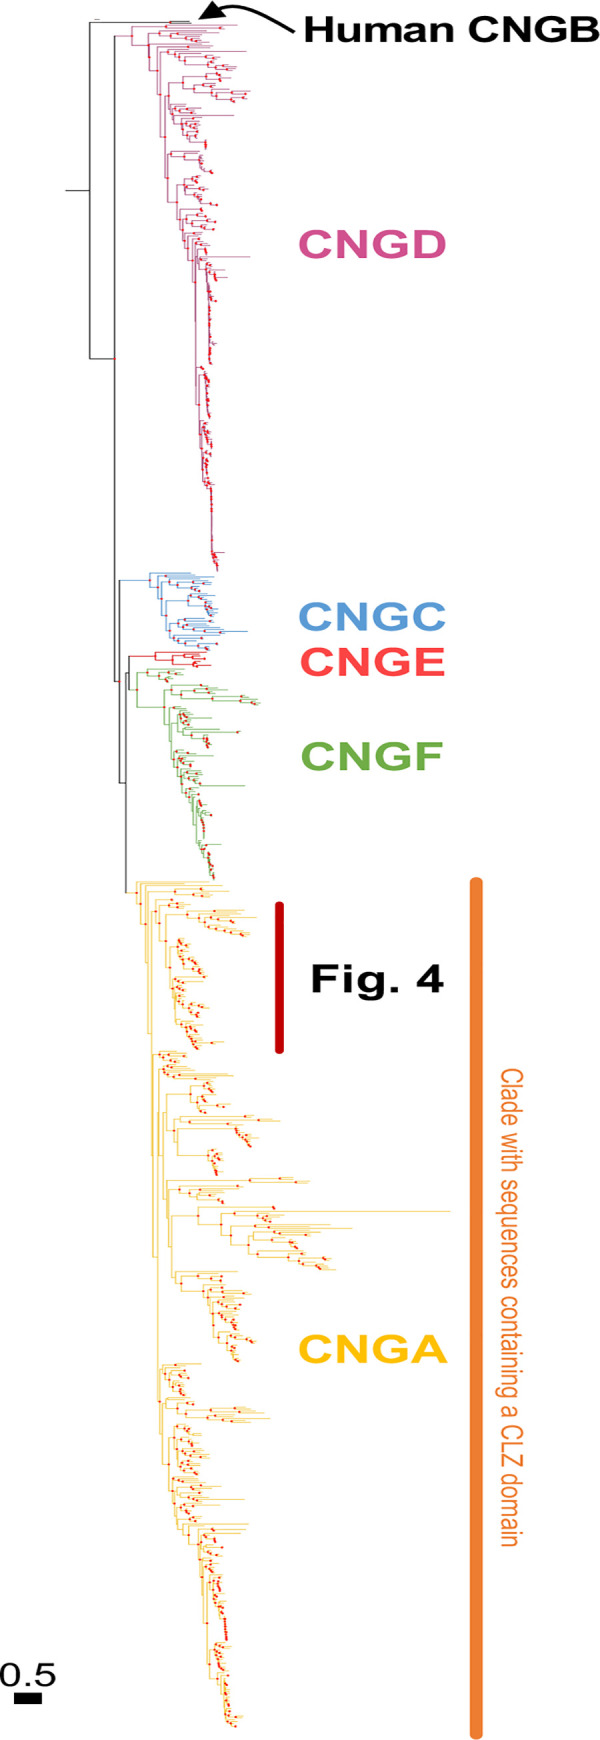
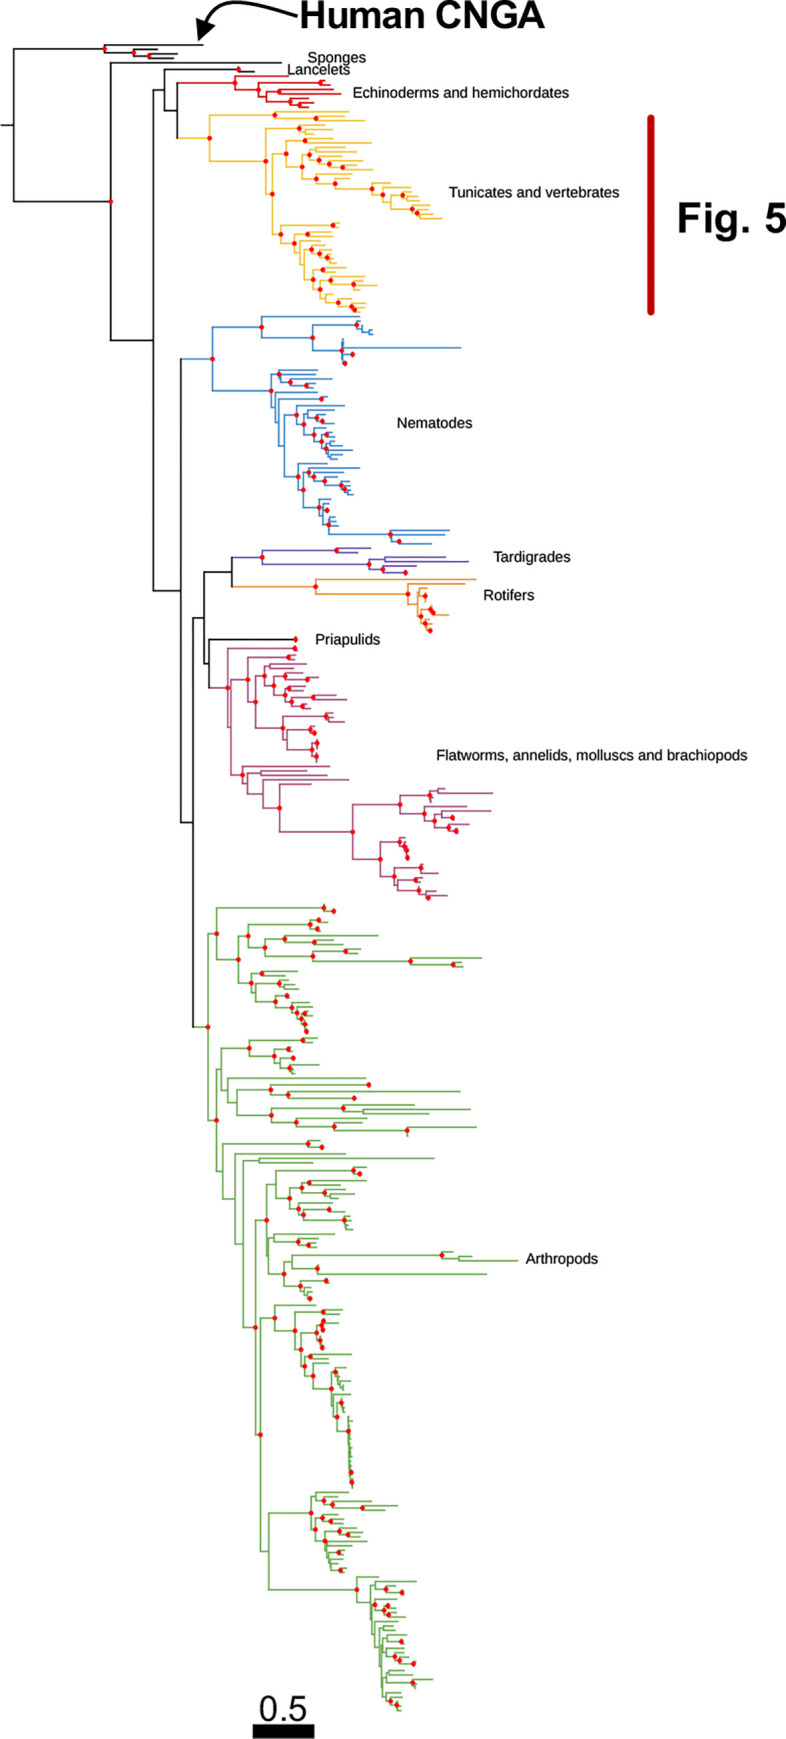
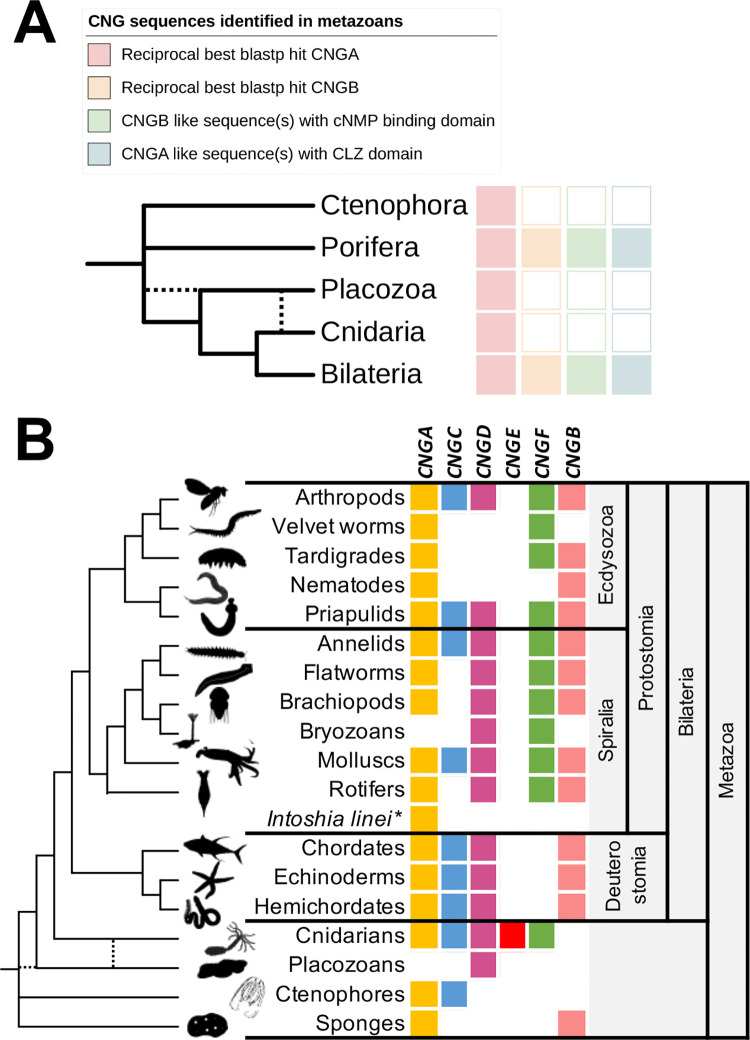
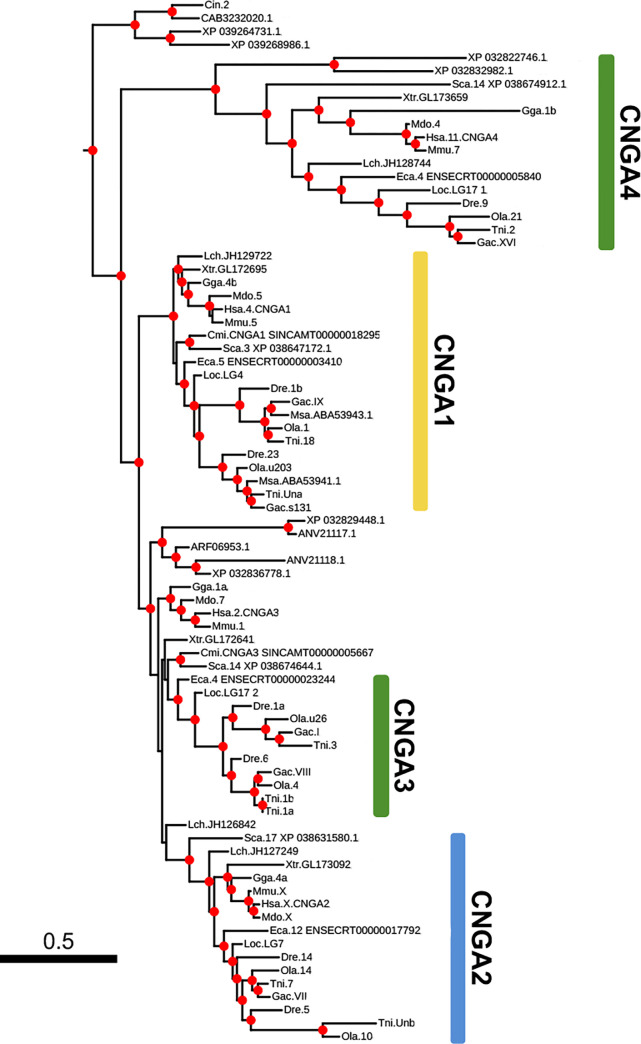
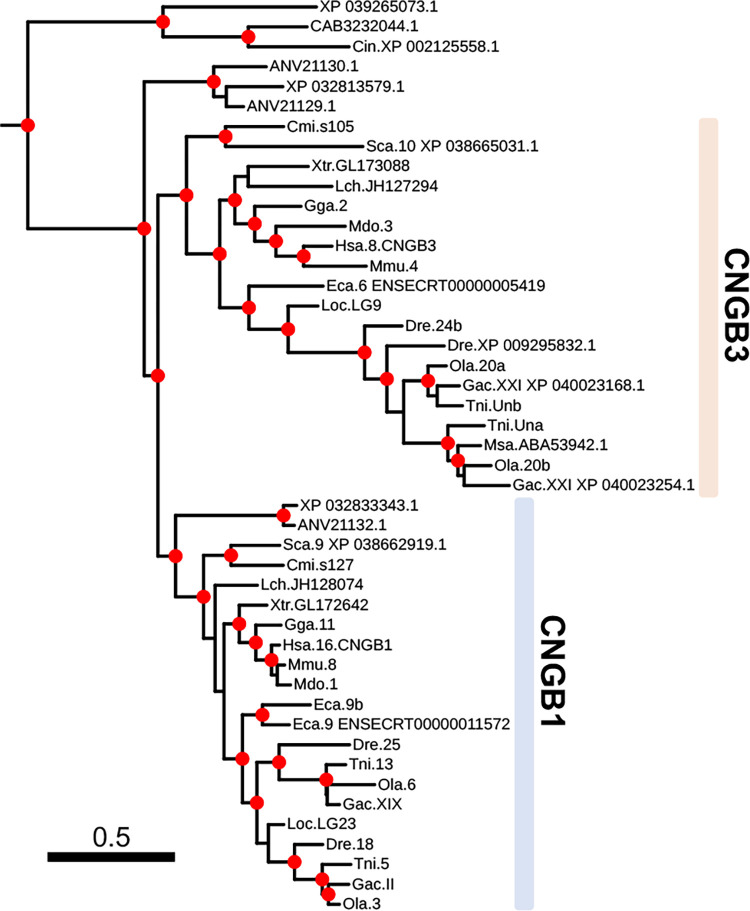
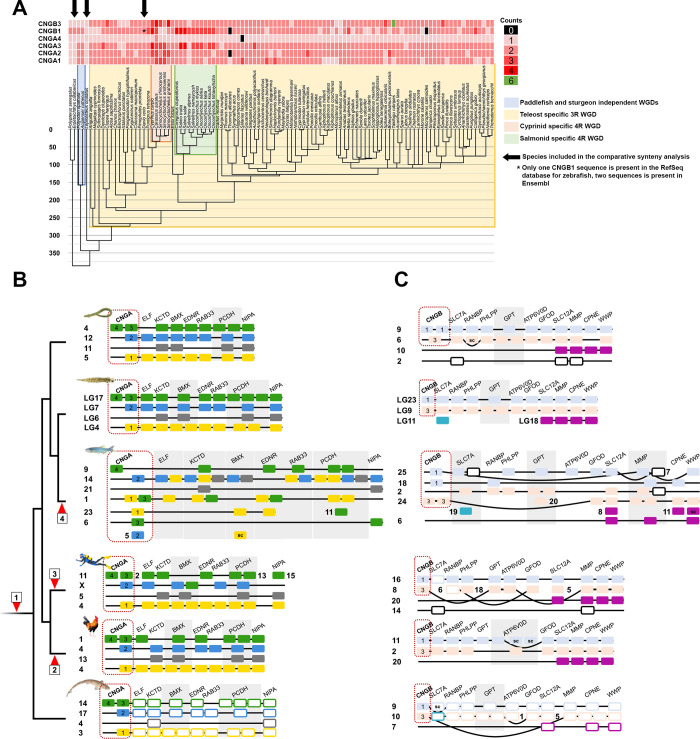
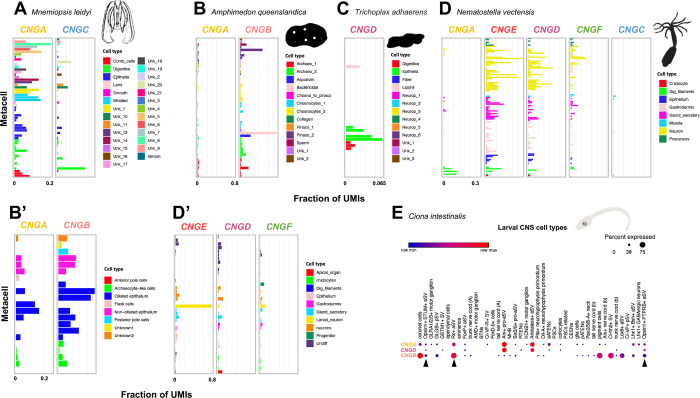
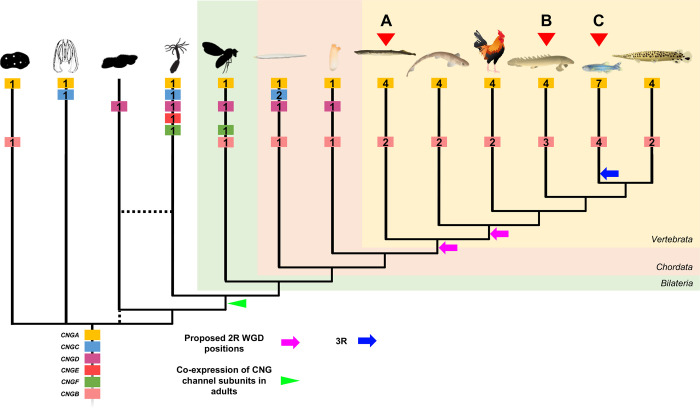
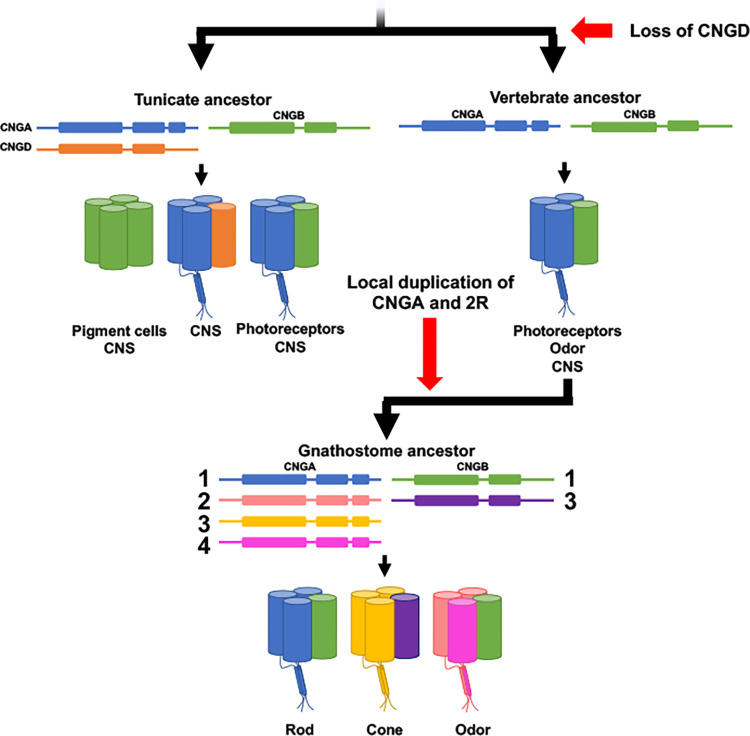
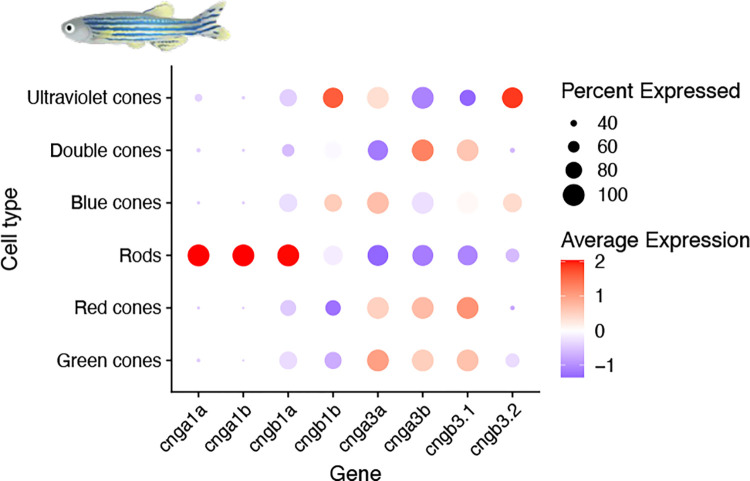
Cyclic nucleotide-gated (CNG) cation channels are important heterotetrameric proteins in the retina, with different subunit composition in cone and rod photoreceptor cells: three CNGA3 and one CNGB3 in cones and three CNGA1 and one CNGB1 in rods. CNGA and CNGB subunits form separate subfamilies. We have analyzed the evolution of the CNG gene family in metazoans, with special focus on vertebrates by using sequence-based phylogeny and conservation of chromosomal synteny to deduce paralogons resulting from the early vertebrate whole genome duplications (WGDs). Our analyses show, unexpectedly, that the CNGA subfamily had four sister subfamilies in the ancestor of bilaterians and cnidarians that we named CNGC, CNGD, CNGE and CNGF. Of these, CNGC, CNGE and CNGF were lost in the ancestor of Olfactores while CNGD was lost in the vertebrate ancestor. The remaining CNGA and CNGB genes were expanded by a local duplication of CNGA and the subsequent chromosome duplications in the basal vertebrate WGD events. Upon some losses, this resulted in the gnathostome ancestor having three members in the visual CNGA subfamily (CNGA1-3), a single CNGA4 gene, and two members in the CNGB subfamily (CNGB1 and CNGB3). The nature of chromosomal rearrangements in the vertebrate CNGA paralogon was resolved by including the genomes of a non-teleost actinopterygian and an elasmobranch. After the teleost-specific WGD, additional duplicates were generated and retained for CNGA1, CNGA2, CNGA3 and CNGB1. Furthermore, teleosts retain a local duplicate of CNGB3. The retention of duplicated CNG genes is explained by their subfunctionalisation and photoreceptor-specific expression. In conclusion, this study provides evidence for four previously unknown CNG subfamilies in metazoans and further evidence that the early vertebrate WGD events were instrumental in the evolution of the vertebrate visual and central nervous systems.


Conflict of interest statement

The authors have declared that no competing interests exist.

Figures

Fig 1
Fig 1. Phylogenetic analysis of all identified metazoan CNGA and CNGA-like sequences.
Colors represent well supported metazoan subfamilies of the CNGA subtype and its most closely related subtypes as identified in this analysis. The colored text represents the proposed name of each novel subtype. The CLZ domain, important for trimerization of the CNGA subunits, was identified only among the classical CNGA genes. The tree was constructed using IQ-Tree version 1.6.1 with 10,000 ultra-fast bootstrap replicates. The tree shown is the consensus tree, nodes are considered strong when they had a support ≥ 90%. Well supported nodes have been labelled with a filled red circle. The phylogenetic trees were rooted with the human HCN1-4 sequences and human CNGB sequences was included as reference respectively.
Fig 2
Fig 2. Phylogenetic analysis of all identified metazoan CNGB type sequences.
Colors represent strongly supported clades labelled with metazoan groups that are included in each clade. The tree was constructed using IQ-Tree version 1.6.1 with 10,000 aLRT and ultra-fast bootstrap replicates. Nodes are considered strong when they have an aLRT supports ≥ 80% and an ultra-fast bootstrap support ≥ 95%. Well supported nodes have been labelled with a filled red circle. The tree was rooted with the human HCN1-4 sequences and human CNGA sequences were included as reference.
Fig 3
Fig 3. CNGA and CNGB type genes in metazoans.
A) Summary of BLASTP searches for CNG genes in metazoans after PfamA screening for CNG channel domains. The results show that only animal groups that have CNGA genes with a CLZ domain also have genes of the CNGB type. Dotted lines represent alternative branching for the placozoa lineage. B) Presence or absence of genes of the CNGA and the CNGA-like subtypes in the different animal groups included in the analysis. The results show that there have been several lineage specific losses within protostomes and deuterostomes. The Bilaterian ancestor most likely had CNGA, CNGC, CNGD and CNGF genes. The ancestor of deuterostomes lost the CNGF gene. The only lineage that has genes of all CNGA-like subtypes is Cnidarians. Intoshia linei is labelled with an asterix due to its uncertain position. Silhouettes were retrieved from phylopic.org and are all dedicated to the public domain.
Fig 4
Fig 4. Enlarged portion of Fig 1 showing the Olfactores clade of the classical CNGA sequences.
Vertebrate clades are colored based on the chromosome of the closest spotted gar ortholog and corresponds to colors used in Fig 8B; CNGA1 –yellow, CNGA2 blue, CNGA4 and CNGA3 –green.
Fig 5
Fig 5. Enlarged portion of Fig 2 showing the Olfactores clade of CNGB sequences.
The gnathostome sequences clearly have been subdivided into two clades, CNGB1 and CNGB3. Vertebrate clades are colored based on the chromosome of the closest spotted gar ortholog and corresponds to colors used Fig 8C; CNGB1 –light blue, CNGB3 –light pink.
Fig 6
Fig 6. CNG sequence counts mapped to a time-calibrated phylogeny of ray-finned fish and comparative synteny analyses of CNGA and CNGB gene regions in select vertebrates.
A) A time-calibrated phylogeny retrieved from timetree.org of actinopterygian fishes and the CNGA and CNGB gene counts as a heatmap. Lineages marked with a colored background have experienced extra whole genome duplications. B) Chromosomal neighborhoods of CNGA genes in the spotted gar genome used in the phylogenetic analyses, and their orthologs, and their neighboring gene family members, in reedfish, zebrafish, human, chicken and small-spotted catshark. C) Chromosomal neighborhoods of CNGB genes in the spotted gar genome used in the phylogenetic analyses and their orthologs, as well as their neighboring gene family members, in reedfish, zebrafish, human, chicken and small-spotted catshark. Order of genes has been reshuffled to highlight similarities between the linkage groups within the paralogon and between species. The phylogenetic trees of the neighboring gene families are shown in S1-S17 Figs in S1 File. Red arrow heads represent: 1) 2R WGDs. 2) Chromosomal fusion in the chicken lineage; 3) rearrangements in the mammalian lineage; and 4) 3R WGD in teleost fish. Spotted gar chromosomes are colored as they are in Fig 1B and 1D, while the other animals’ orthologs are colored the same as their spotted gar ortholog–see Figs 6 and 7. Boxes for neighboring gene families in the small-spotted catshark have been left white with colored edges since they are not included in phylogenetic analyses. Numbers in gene boxes indicate which CNGA or CNGB gene the box represent.
Fig 7
Fig 7. Expression of CNG genes in non-bilaterian metazoans and in the tunicate Ciona intestinalis.
A) Expression of CNGA and CNGC in ctenophore metacells shows differential expression across cell types. B) Expression of CNGA and CNGB in sponge adult metacells show, like in the ctenophore, differential expression of both genes. B’) Co-expression of both genes in the larval sponge. C) Expression of the single CNGD gene in the placozoan metacells. D) Expression of the five CNG genes in the adult cnidarian Nematostella vectensis show overlap in expression in the same metacells for CNGE, CNGD and CNGF, while CNGA and CNGC have lower expression. CNGA has its highest expression in digestive filament metacells. D’) In the larval Nematostella vectensis only CNGE, CNGD and CNGF are expressed and CNGE has the highest expression in larval neurons. E) Expression of the identified CNG genes in the Ciona intestinalis larval central nervous system show both overlapping expression of CNGA and CNGB, and CNGA and CNGD as well as expression of only CNGB in some cells. Black arrows represent photoreceptor cells in the anterior sensory vesicle or their precursors. Silhouettes were retrieved from phylopic.org and are all dedicated to the public domain. Illustration of Ciona intestinalis larva was kindly provided by Dr. Daniel Ocampo Daza.
Fig 8
Fig 8. Evolutionary events leading to the repertoire seen in modern metazoan groups.
Subunit gene repertoire was reduced in the vertebrate ancestor and expanded in the 2R WGDs in the vertebrate lineage either before or after the split between cyclostomes and gnathostomes (purple arrows). Expression of multiple CNG subunits in adult cell types appeared in the ancestor of Cnidaria and Bilateria (green arrowhead). A) Lampreys have an extra duplicate of CNGA4. B) The Grey bichir has a local duplicate of CNGB1. C) The 3R WGD and a local duplicate of CNGB3 expanded the number of genes in teleosts further. Numbers in gene boxes represent the number of genes of this subtype in this lineage. The tree is a cladogram and branch lengths does not represent evolutionary distance. Silhouettes were retrieved from phylopic.org and are all dedicated to the public domain. Illustrations of chordates was kindly provided by Dr. Daniel Ocampo Daza.
Fig 9
Fig 9. Evolution and proposed subunit composition in cell types of the tunicate ancestor, vertebrate ancestor and the gnathostome ancestor based on our evolutionary analyses and expression data from Ciona intestinalis and human.
Fig 10
Fig 10. CNG gene expression data from zebrafish.
Dot plot of the expression of zebrafish visual CNG genes in photoreceptor cell types in the retina. This data show that further specialization has occurred after the teleost-specific 3R event. Illustration of zebrafish was kindly provided by Dr. Daniel Ocampo Daza.

Similar articles

References

    1. Darwin C., Drawin On the origin of species by means of natural selection, 1859.
    1. Nordström K., Larsson T.A., Larhammar D., Extensive duplications of phototransduction genes in early vertebrate evolution correlate with block (chromosome) duplications, Genomics. 83 (2004) 852–872. doi: 10.1016/j.ygeno.2003.11.008 - DOI - PubMed
    1. Larhammar D., Nordström K., Larsson T.A., Evolution of vertebrate rod and cone phototransduction genes., Philos Trans R Soc Lond B Biol Sci. 364 (2009) 2867–2880. doi: 10.1098/rstb.2009.0077 - DOI - PMC - PubMed
    1. Lagman D., Daza D.O., Widmark J., Abalo X.M., Sundström G., Larhammar D., The vertebrate ancestral repertoire of visual opsins, transducin alpha subunits and oxytocin/vasopressin receptors was established by duplication of their shared genomic region in the two rounds of early vertebrate genome duplications, BMC Evol Biol. 13 (2013) 238. doi: 10.1186/1471-2148-13-238 - DOI - PMC - PubMed
    1. Lagman D., Sundström G., Ocampo Daza D., Abalo X.M., Larhammar D., Expansion of Transducin Subunit Gene Families in Early Vertebrate Tetraploidizations., Genomics. 100 (2012) 203–211. doi: 10.1016/j.ygeno.2012.07.005 - DOI - PubMed

Publication types

MeSH terms

Substances