. 2023 Jan 3;120(1):e2216599120.
doi: 10.1073/pnas.2216599120. Epub 2022 Dec 29.

Unusual phototransduction via cross-motif signaling from Gq to adenylyl cyclase in intrinsically photosensitive retinalganglion cells

Affiliations

Unusual phototransduction via cross-motif signaling from Gq to adenylyl cyclase in intrinsically photosensitive retinalganglion cells

Lujing Chen et al. Proc Natl Acad Sci U S A. .

Abstract

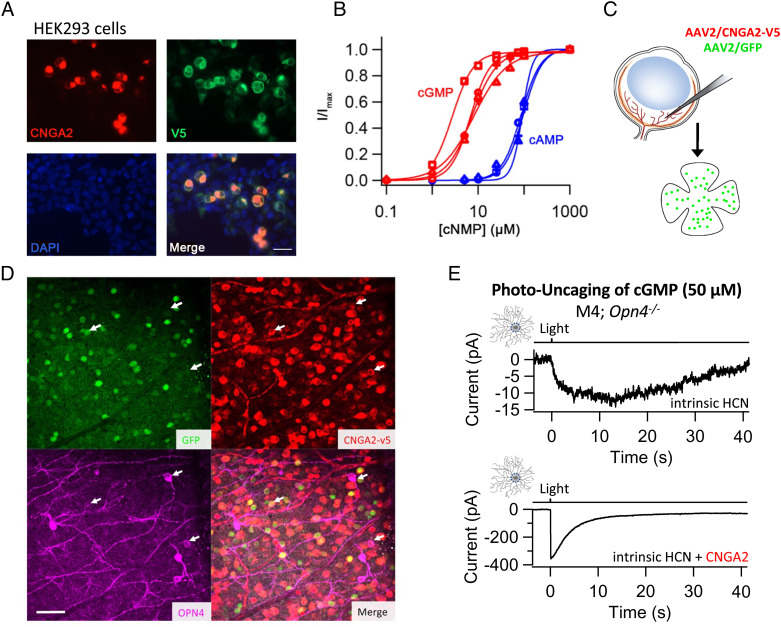
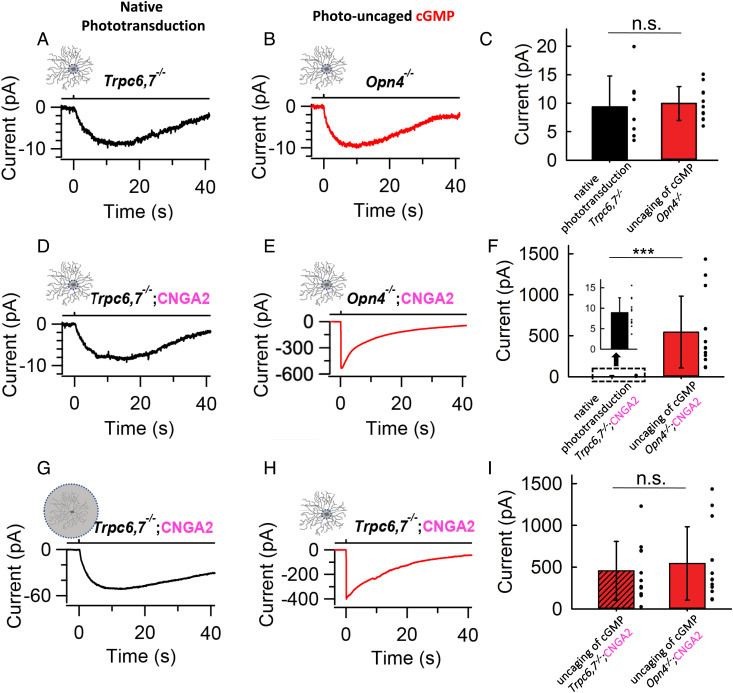
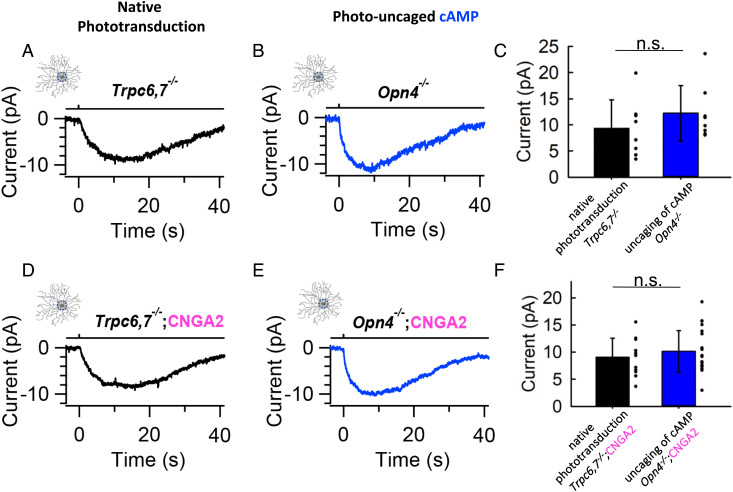
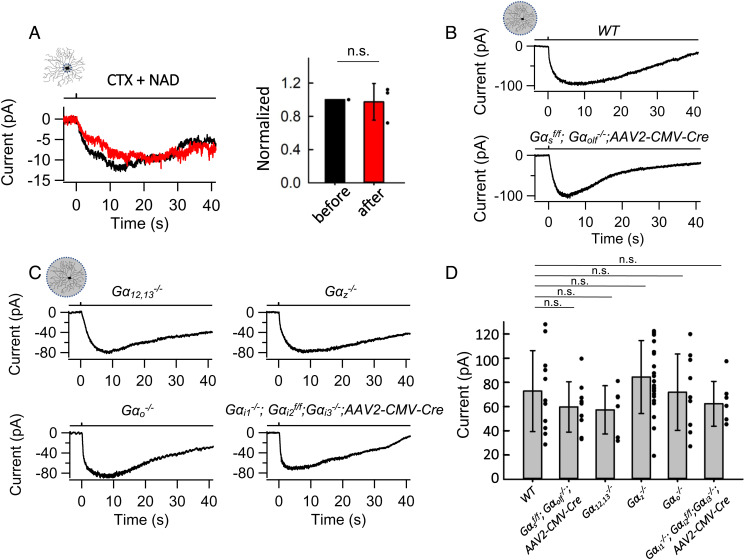
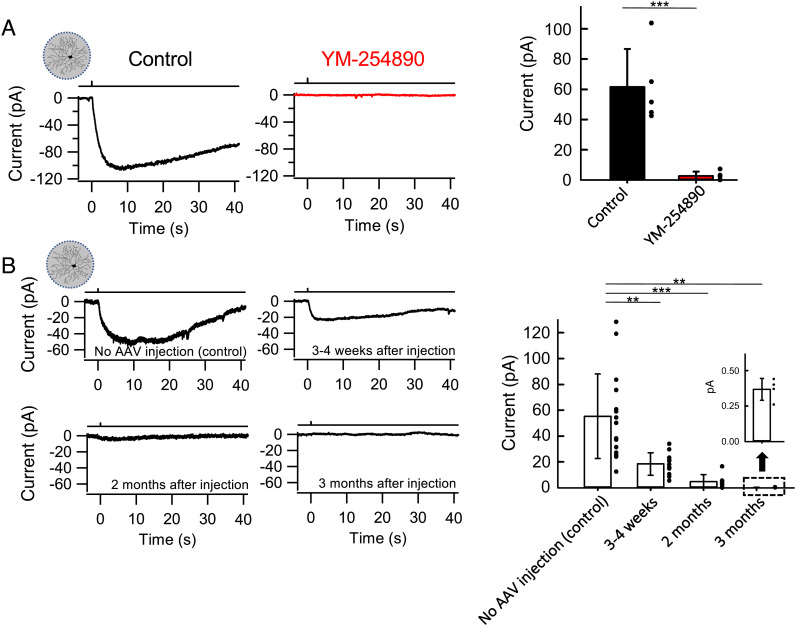
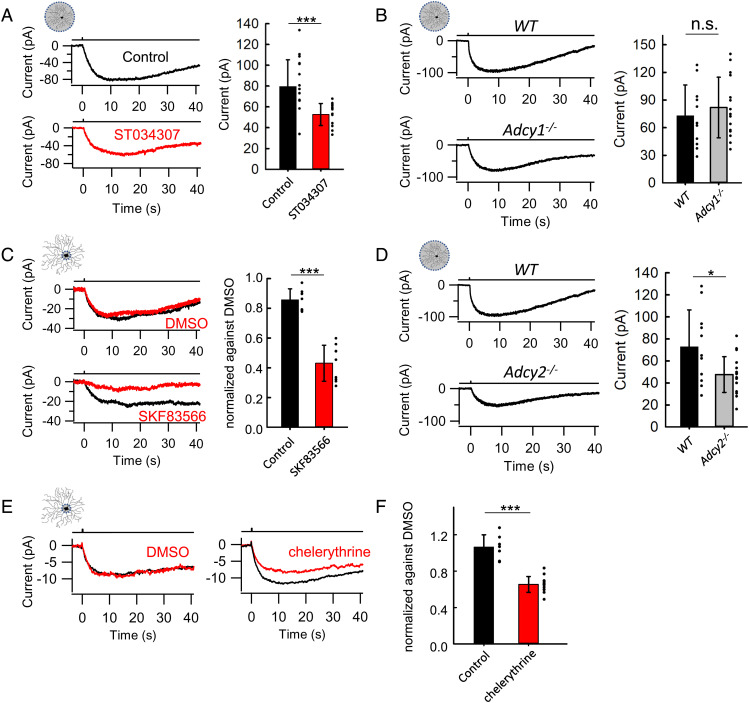
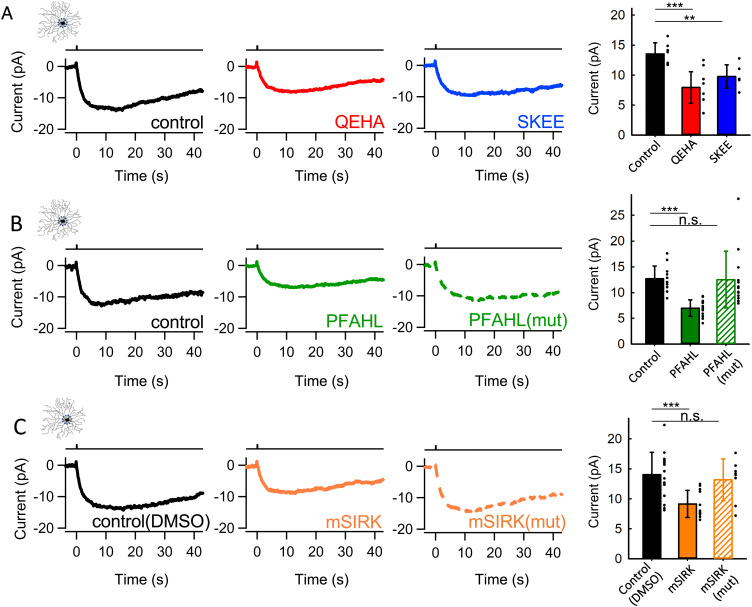
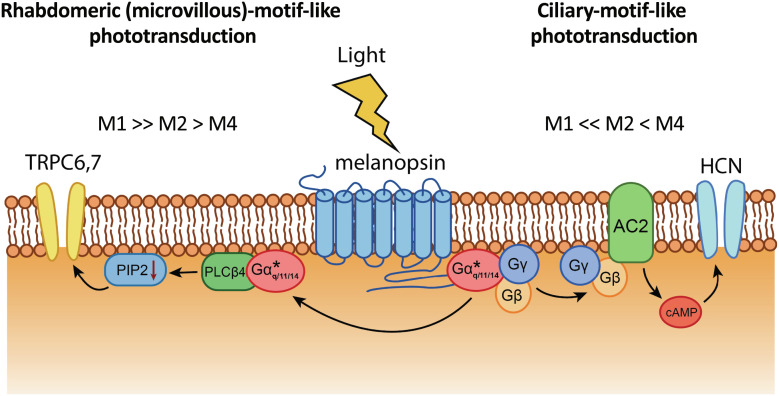
Nonimage-forming vision in mammals is mediated primarily by melanopsin (OPN4)-expressing, intrinsically photosensitive retinal ganglion cells (ipRGCs). In mouse M1-ipRGCs, melanopsin predominantly activates, via Gαq,11,14, phospholipase C-β4 to open transient receptor 6 (TRPC6) and TRPC7 channels. In M2- and M4-ipRGCs, however, a prominent phototransduction mechanism involves the opening of hyperpolarization- and cyclic nucleotide-gated channels via cyclic nucleotide, although the upstream steps remain uncertain. We report here experiments, primarily on M4-ipRGCs, with photo-uncaging of cyclic nucleotides and virally expressed CNGA2 channels to conclude that the second messenger is cyclic adenosine monophosphate (cAMP) - very surprising considering that cyclic guanosine monophosphate (cGMP) is used in almost all cyclic nucleotide-mediated phototransduction mechanisms across the animal kingdom. We further found that the upstream G protein is likewise Gq, which via its Gβγ subunits directly activates adenylyl cyclase (AC). Our findings are a demonstration in a native cell of a cross-motif GPCR signaling pathway from Gq directly to AC with a specific function.

Keywords: Gq; cAMP; ipRGC; melanopsin; phototransduction.


Conflict of interest statement

The authors declare no competing interest.

Figures

Fig. 1.
Fig. 1.
Heterologous expression of CNGA2-V5 in ipRGCs via AAV. (A) HEK293 cells transfected with WT CNGA2–V5 AAV plasmid. Colocalization of CNGA2 (red) and v5-tag (green) revealed a reliable detection of CNGA2 expression via immunostaining of v5-tag. (Scale bar, 30 μm.) (B) Dose–response relations of WT CNGA2–V5 for cAMP (blue) and cGMP (red) evaluated at a membrane potential of -50 mV, from inside-out membrane patch recordings from transfected HEK293 cells. Different symbols indicate data from different cells. Solid lines are fits to the Hill equation. Averaged data (mean ± SD) shown in main text. (C) A diagram of intravitreal injection and the AAV-infected whole-mount retina (flattened with four cuts). Successful infection is indicated by GFP signal while recording. (D) Infection of Trpc6,7−/− mouse retina with a mixture of AAV2–CNGA2–V5 and AAV2–CMV–GFP viruses. GFP signal (green) indicates an area with good infection. V5 immunohistochemistry signal (red) shows ~70% retinal ganglion cells expressing CNGA2 in the same area. White arrows show colocalization of OPN4 (magenta) and CNGA2 (red), revealing successful expression of CNGA2 in some ipRGCs. GFP signal may not always overlap with CNGA2 due to lower yield of AAV–CMV–GFP (see Methods). (E) Photo-uncaging of 50-μM DEACM-cGMP at the soma of an Opn4−/− M4-cell expressing CNGA2 produced a fast current (Lower) compared to a control Opn4−/− M4-cell’s response (Upper). Both traces are from representative cells. Light stimulation: a spot of 50-ms Xe white light flash (equivalent to 5.12 × 10¹⁰ photons μm−2 s−1 of 480-nm light, 40 μm in diameter) centered at the soma. The small diagram shown on the upper left corner indicates local illumination at soma; and the little vertical bar represents the light pulse for stimulation (same for all the other panels in this paper).
Fig. 2.
Fig. 2.
Comparison of native-phototransduction response and photo-uncaged-cGMP-triggered response on M4-ipRGCs with and without CNGA2 demonstrating that cGMP is not the native second messenger for phototransduction. (A) Cohort-averaged intrinsic light response from the somata of Trpc6,7−/− M4-cells. (B) Cohort-averaged photo-uncaged-cGMP-triggered response from the somata of Opn4−/−M4-cells. (C) Collective data of peak amplitudes in (A) and (B). Each dot represents an individual cell. (D) Cohort-averaged intrinsic light response from the somata of Trpc6,7−/− M4-cells expressing CNGA2. (E) Cohort-averaged photo-uncaged-cGMP-triggered response from the somata of Opn4−/−M4-cells expressing CNGA2. (F) Collective data of peak amplitudes in (D) and (E). Each dot represents an individual cell. Inset shows the peak amplitudes on a magnified Y-scale. (G) Cohort-averaged intrinsic full-field diffuse light response from the same cells is shown in (D). (H) Cohort-averaged photo-uncaged-cGMP-triggered response from the somata of the same cells shown in (D) and (G). (I) Average peak amplitudes of (H) and (E). Each dot represents an individual cell. Light stimulation in (A), (B), (D), (E), and (H): a spot of 50-ms Xe white light flash (equivalent to 5.12 × 10¹⁰ photons μm−2 s−1 of 480-nm light, 40 μm in diameter) centered at the soma. Light stimulation in (G): a full-field 50-ms Xe white light flash with the same intensity. 50-μM DEACM-cGMP was dialyzed from the recording pipette in all the photo-uncaging experiments mentioned above. Averaged data shown in main text (mean ± SD, n.s., not statistically different, ***P < 0.001).
Fig. 3.
Fig. 3.
Comparison of native-phototransduction response and photo-uncaged-cAMP-triggered response on M4-ipRGCs with and without CNGA2 demonstrates cAMP being the native second messenger for phototransduction. (A) Cohort-averaged intrinsic light response from the somata of Trpc6,7−/− M4-cells. (B) Cohort-averaged photo-uncaged-cAMP-triggered response from the somata of Opn4−/−M4-cells. (C) Collective data of peak amplitudes in (A) and (B). Each dot represents an individual cell. (D) Cohort-averaged intrinsic light response from the somata of Trpc6,7−/− M4-cells expressing CNGA2. (E) Cohort-averaged photo-uncaged-cAMP-triggered response from the somata of Opn4−/−M4-cells expressing CNGA2 subunits. (F) Collective data of peak amplitudes in (D) and (E). Each dot represents an individual cell. Light stimulation in (A) and (D): a spot of 50-ms Xe white light flash (equivalent to 5.12 × 10¹⁰ photons μm−2 s−1 of 480-nm light, 40 μm in diameter) centered at the soma. Light stimulation in (B) and (C): a spot of 50-ms Xe white light flash (equivalent to 6.14 × 10⁹ photons μm−2 s−1 of 480-nm light, 40 μm in diameter) centered at the soma. 50-μM DEACM-cAMP was dialyzed from the recording pipette in all the photo-uncaging experiments mentioned above. Averaged data shown in main text (mean ± SD, n.s., not statistically different).
Fig. 4.
Fig. 4.
Lack of effect of cholera toxin or of different Gα-subunit knockouts on intrinsic light response of M4-ipRGCs. (A) Left: Representative intrinsic light responses of M4-ipRGCs in Trpc6,7−/− background before (black trace) and after (red trace) 15-min treatment of Cholera Toxin (CTX) A protomer (50 μg/mL) together with 500-μM nicotinamide adenine dinucleotide (NAD) loaded from the recording pipette; Right: Collective normalized data. Before: all normalized to unity; after: 0.97 ± 0.22, mean ± SD, n = 3; P = 0.9, paired test, n.s., not statistically different). (B) Representative intrinsic light responses of WT (Upper) and sf/f;Gαolf−/−;AAV2-CMV-Cre-GFP (Bottom) M4-ipRGCs. (C) Different panels show representative intrinsic light responses of 12,13−/−; z−/−; o−/− and i1−/−;Gαi2f/f;Gαi3−/−;AAV2-CMV-Cre-GFP M4-ipRGCs. (D) Collective data for different G protein KO lines (WT: 72.8 ± 33.5 pA; sf/f;Gαolf−/−;AAV2-CMV-Cre-GFP: 59.7 ± 20.8 pA, P = 0.30; 12,13−/−: 57.3 ± 19.9 pA, P = 0.30; z−/−: 84.4 ± 30.1 pA, P = 0.34; o−/−: 71.9 ± 31.6 pA, P = 0.95; i1−/−;Gαi2f/f;Gαi3−/−;AAV2-CMV-Cre-GFP: 62.3 ± 18.6 pA, P = 0.41; n = 11, 9, 6, 23, 9, 7; mean ± SD, n.s., not statistically different, P-values are from test with comparison to WT). Each dot represents an individual cell. Experiments with AAV2-CMV-Cre-GFP were executed 1 to 2 mo after intravitreal injection, to allow high Cre expression and a reasonable time for turnover of the targeted Gα. Light stimulation in (A): a spot of 50-ms Xe white light flash (equivalent to 5.12 × 10¹⁰ photons μm−2 s−1 of 480-nm light, 40 μm in diameter) centered at the soma; in (B) and (C): full-field diffuse light stimulation with the same intensity as above.
Fig. 5.
Fig. 5.
Evidence that intrinsic light response of M4-ipRGCs is also mediated by Gq-subfamily. (A) Left: Representative intrinsic light responses of M4-ipRGCs in Trpc6,7−/− background with (red trace) or without (black trace) 15-min pretreatment of YM254890 (10 μM); Right: Collective data of Left (Control: 61.5 ± 25.2 pA; YM254890: 2.7 ± 2.9 pA, mean ± SD, n = 5, 5; P = 0.0008, test, ***P < 0.001). Each dot represents an individual cell. (B) Left: Representative intrinsic light responses of AAV2-CMV-Cre-GFP;Gαqfl/fl;Gα11−/−;Gα14−/− M4-ipRGCs executed at different times after intravitreal injection. Right: Collective data of Left (Control: 55.3 ± 32.7 pA; 3 to 4 wk: 18.4 ± 8.7 pA, P = 0.001; 2 mo: 4.7 ± 5.6 pA, P = 0.0006; 3 mo: 0.4 ± 0.1 pA, P = 0.004; n = 17, 11, 7, 4; mean ± SD, **P < 0.01, ***P < 0.001, P-values are from t test with comparison to Control), Inset shows the collective data of 3-mo post injection on a magnified Y-scale. Each dot represents an individual cell. Light stimulation: 50-ms full-field diffusive Xe white light flash (equivalent to 5.12 × 10¹⁰ photons μm−2 s−1 of 480-nm light).
Fig. 6.
Fig. 6.
Involvement of AC2 in the cAMP/HCN channel-mediated phototransduction pathway. (A) Left: Representative intrinsic light response of Trpc6,7−/− M4-ipRGCs with (red) or without (black) > 1-h pretreatment of ST034307. Right: collective data of Left panel (Control:79.5 ± 25.9 pA; ST034307: 52.7 ± 10.6 pA; n = 14, 14; P =0.0009, t test, mean ± SD, ***P < 0.001). Each dot represents an individual cell. (B) Left: representative intrinsic light response of WT M4-ipRGCs (Upper) and Adcy1−/− M4-ipRGCs (Bottom). Right: collective data for Left panel (WT: 72.8 ± 33.5 pA; Adcy1−/−: 71.2 ± 19.6 pA; n = 11, 7, P = 0.9, t test, mean ± SD, n.s., not statistically different). (C) Left: representative intrinsic light response of Trpc6,7−/− M4-ipRGCs from somata before versus after 15-min treatment of SKF83566 (50 μM, diluted from 50-mM stock in DMSO, Bottom panel) and 15-min treatment of vehicle (DMSO, 1:1,000 dilution, Upper panel) from the recording pipette. Black traces: before treatment; red traces: after treatment. Right: Collective data for normalized response against DMSO for Left panel. Control: 0.86 ± 0.07; SKF83566: 0.43 ± 0.12; P = 9.2 × 10⁻⁷, test; n = 7, 9 (mean ± SD, ***< 0.001). (D) Left: representative intrinsic light responses of WT M4-ipRGCs (Upper) and Adcy2−/− M4-ipRGCs (Bottom). Right: collective data for Left panel (WT: 72.8 ± 33.5 pA; Adcy2−/−: 47.7 ± 16.2 pA; n = 11, 18, P = 0.04, t test, mean ± SD, *< 0.05). (E) Averaged intrinsic light response of Trpc6,7−/− M4-ipRGCs from somata before versus after 25-min treatment of chelerythrine (10 μM, diluted from 20-mM stock in DMSO, Right) and 25-min treatment of vehicle (DMSO, 1:2,000 dilution, Left) from bath perfusion. Black traces: before treatment; red traces: after treatment. (F): Collective data for normalized response against DMSO for (E). Control: 1.06 ± 0.13; chelerythrine: 0.65 ± 0.09; P = 5.8 × 10⁻⁵, test; n = 7, 13 (mean ± SD, ***< 0.001). Light stimulation: 50-ms full-field diffusive Xe white light flash (equivalent to 5.12 × 10¹⁰ photons μm−2 s−1 of 480-nm light) for (A), (B) and (D); a spot of 50-ms Xe white light flash with the same intensity was used in (C); a spot of 200-ms Xe white light flash (equivalent to 2.1 × 10¹⁰ photons μm−2 s−1 of 480-nm light) for (E).
Fig. 7.
Fig. 7.
Evidence from peptides indicating that Gβγ are involved in M4-ipRGC’s cAMP/HCN channel-mediated phototransduction pathway. (A) Left three panels: Cohort-averaged intrinsic light response of Trpc6,7−/− M4-ipRGCs from somata without peptide preincubation (control); with the preincubation of 250-μM QEHA; and with the preincubation of 250-μM SKEE (see text for details). Far Right panel: Collective data for the Left three panels. Dots indicate individual cells. Control: 13.5 ± 1.8 pA, n = 7; QEHA: 7.9 ± 2.6 pA, n = 9, P = 0.003; SKEE: 9.8 ± 1.9 pA, n = 6, P = 0.004 (mean ± SD, **< 0.01, ***< 0.001, P-values are from test with comparison to control). (B) Left three panels: Cohort-averaged intrinsic light response of Trpc6,7−/− M4-ipRGCs from somata without peptide preincubation (control); with the preincubation of 250-μM PFAHL; and with the preincubation of 250-μM PFAHL (mut). Far Right panel: Collective data for the Left three panels. Dots indicate individual cells. Control: 12.0 ± 2.5 pA, n = 12; PFAHL: 7.0 ± 1.6 pA, n = 13, P = 1.8 × 10⁻⁶; PFAHL(mut): 12.5 ± 5.5 pA, n = 13, P = 0.92 (mean ± SD, ***< 0.001, n.s., not statistically different, P-values are from t test with comparison to control.) (C) Left three panels: Cohort-averaged intrinsic light response of Trpc6,7−/− M4-ipRGCs from somata with DMSO (1:500) preincubation (control); with the preincubation of 25-μM mSIRK (diluted from 12.5 mM stock in DMSO); and with the preincubation of 25-μM mSIRK(mut) (diluted from 12.5 mM stock in DMSO). Far Right panel: Collective data for the Left three panels. Dots indicate individual cells. Control: 14.0 ± 3.7 pA, n = 17; mSIRK: 9.2 ± 2.3 pA, n = 11, P = 0.0002; mSIRK(mut): 13.2 ± 3.5 pA, n = 8, P = 0.57 (mean ± SD, ***< 0.001, n.s., not statistically different, P-values are from t test with comparison to control). Light stimulation: a spot of 200-ms Xe white light flash (equivalent to 2.1 × 10¹⁰ photons μm−2 s−1 of 480-nm light, 40 μm in diameter) centered at the soma.
Fig. 8.
Fig. 8.
Schematic diagram showing the PLCβ4/TRPC6,7 and cAMP/HCN pathways in ipRGCs. M1≫M2>M4 and M4>M2≫M1 indicate the relative prevalence of each pathway in M1-, M2- and M4-ipRGCs. “*” indicates activated state. See text for details.

Similar articles

Cited by

References

    1. Berson D. M., Dunn F. A., Takao M., Phototransduction by retinal ganglion cells that set the circadian clock. Science 295, 1070–1073 (2002). - PubMed
    1. Hattar S., Liao H. W., Takao M., Berson D. M., Yau K. W., Melanopsin-containing retinal ganglion cells: Architecture, projections, and intrinsic photosensitivity. Science 295, 1065–1070 (2002). - PMC - PubMed
    1. Do M. T. H., Yau K. W., Intrinsically photosensitive retinal ganglion cells. Physiol. Rev. 90, 1547–1581 (2010). - PMC - PubMed
    1. Schmidt T. M., Chen S. K., Hattar S., Intrinsically photosensitive retinal ganglion cells: Many subtypes, diverse functions. Trends Neurosci. 34, 572–580 (2011). - PMC - PubMed
    1. Do M. T. H., Melanopsin and the intrinsically photosensitive retinal ganglion cells: Biophysics to behavior. Neuron 104, 205–226 (2019). - PMC - PubMed

Publication types

MeSH terms

LinkOut - more resources