. 2023 Mar 6;220(3):e20220857.
doi: 10.1084/jem.20220857. Epub 2022 Dec 30.

Engineering an inhibitor-resistant human CSF1R variant for microglia replacement

Affiliations

Engineering an inhibitor-resistant human CSF1R variant for microglia replacement

Jean Paul Chadarevian et al. J Exp Med. .

Abstract

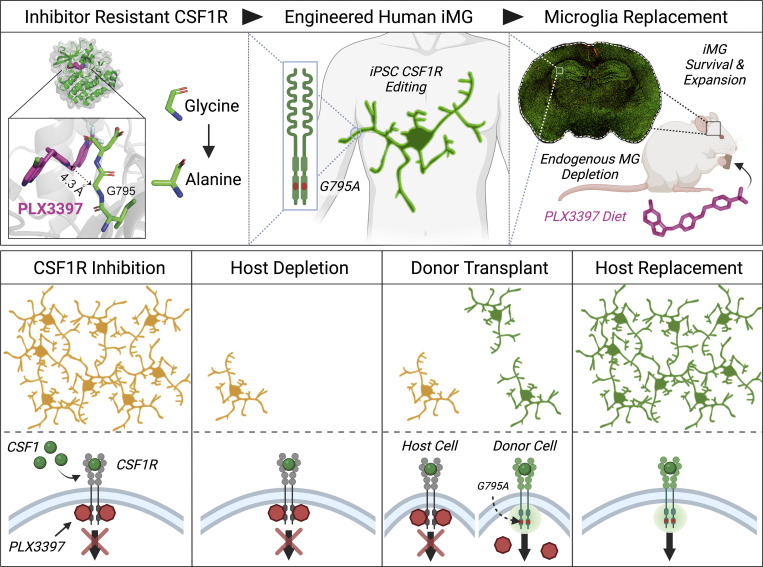
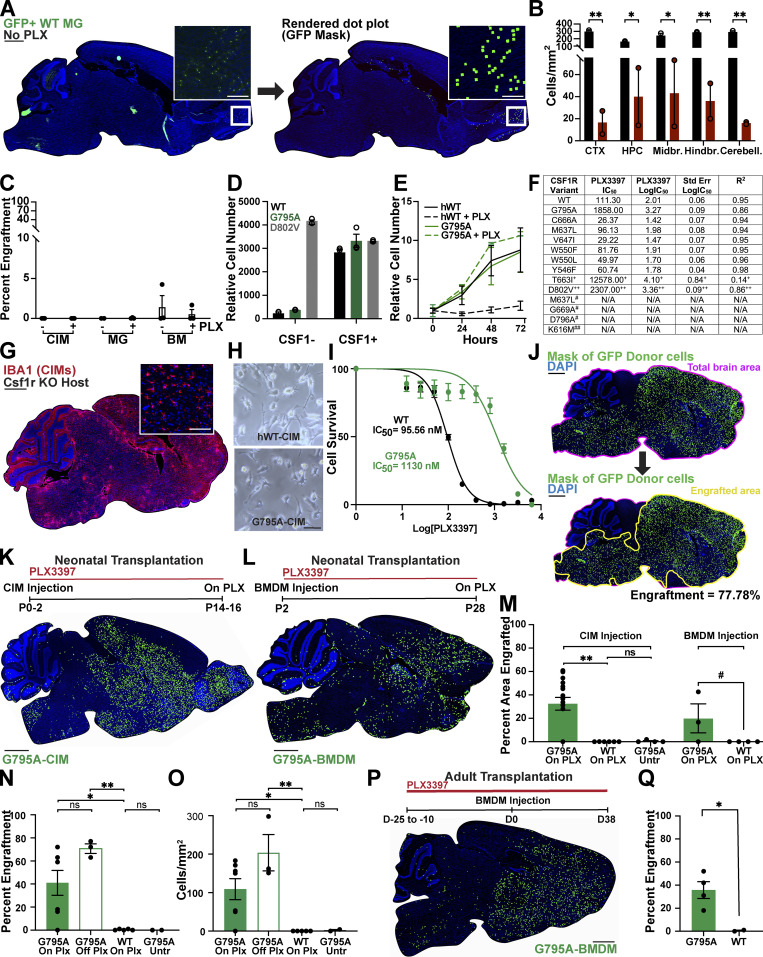
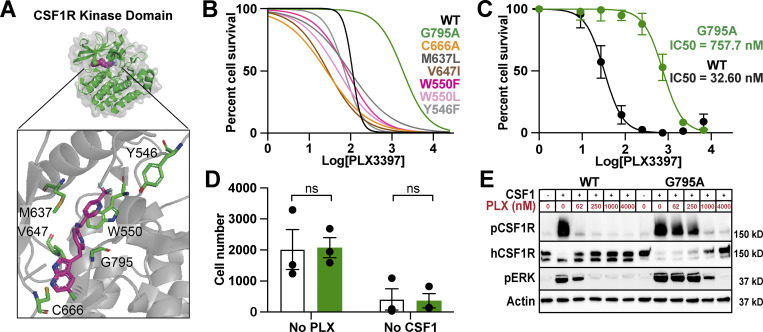
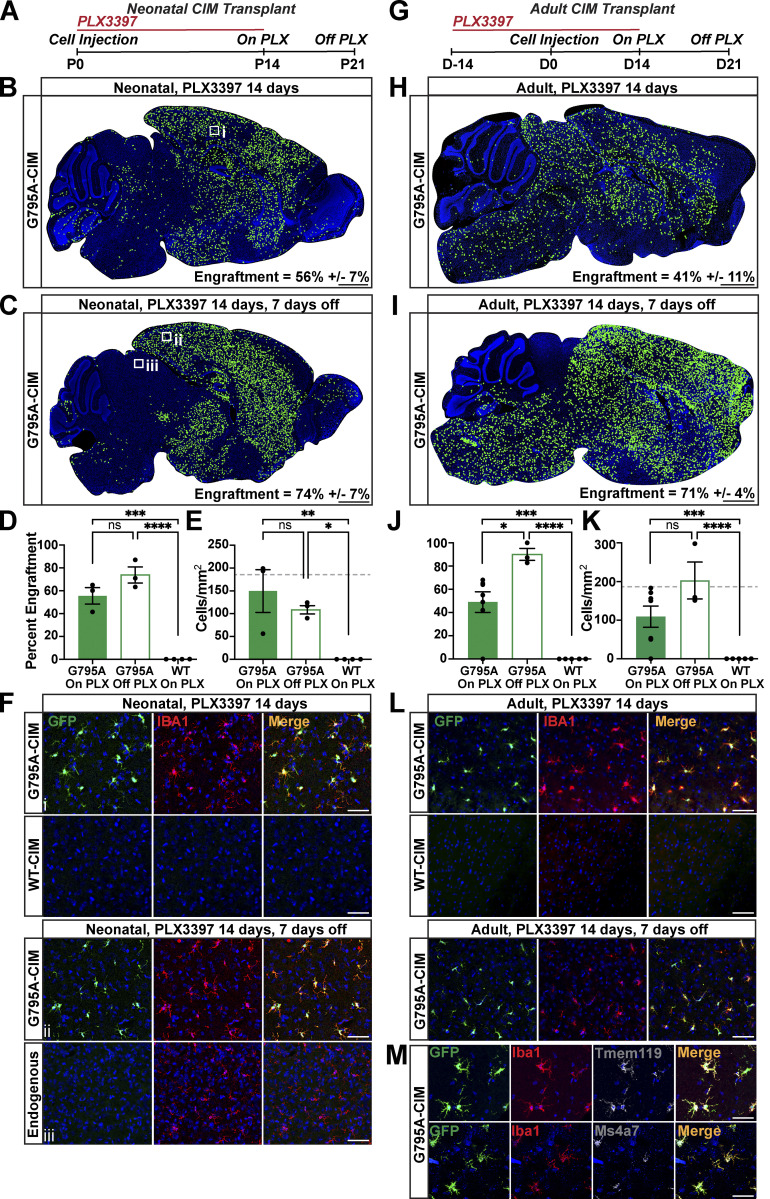
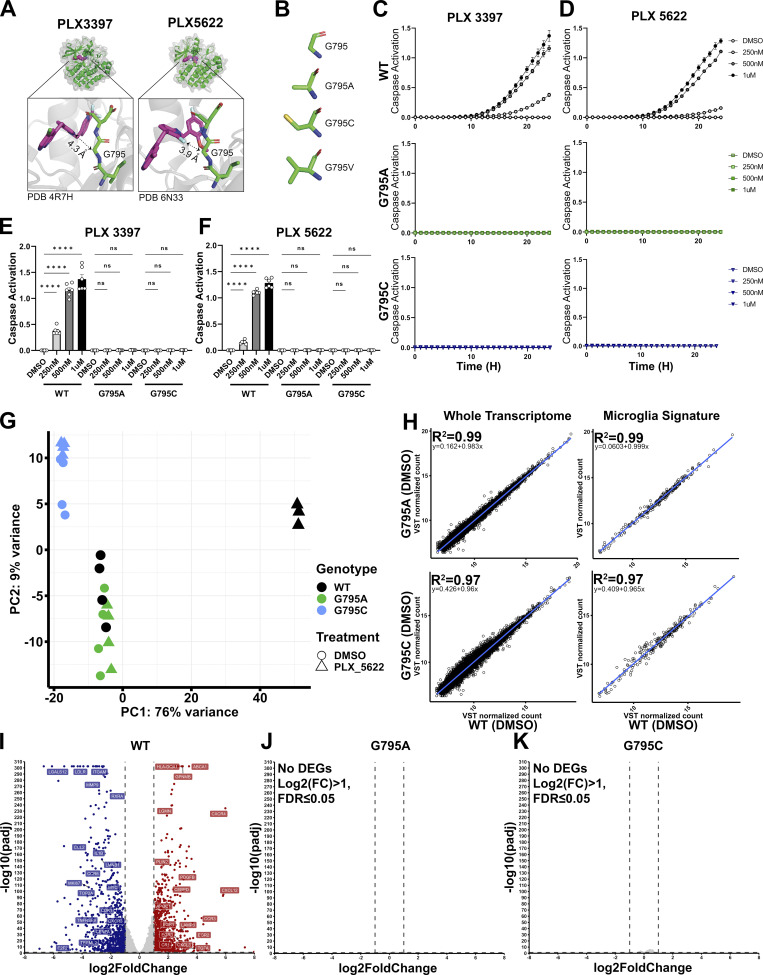
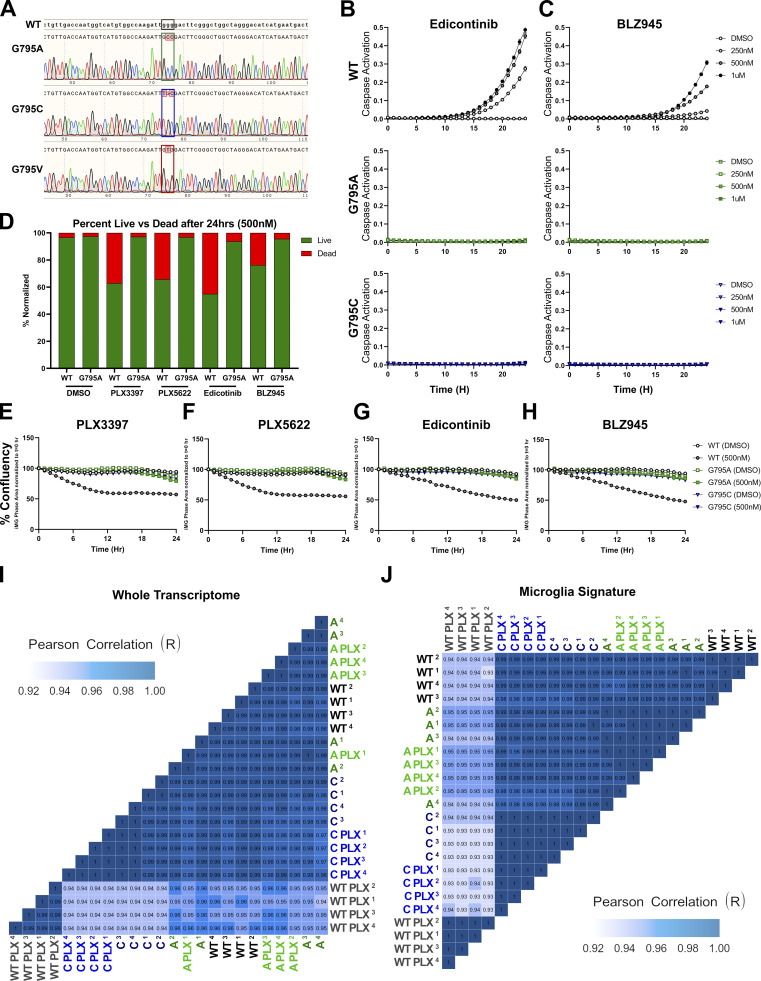
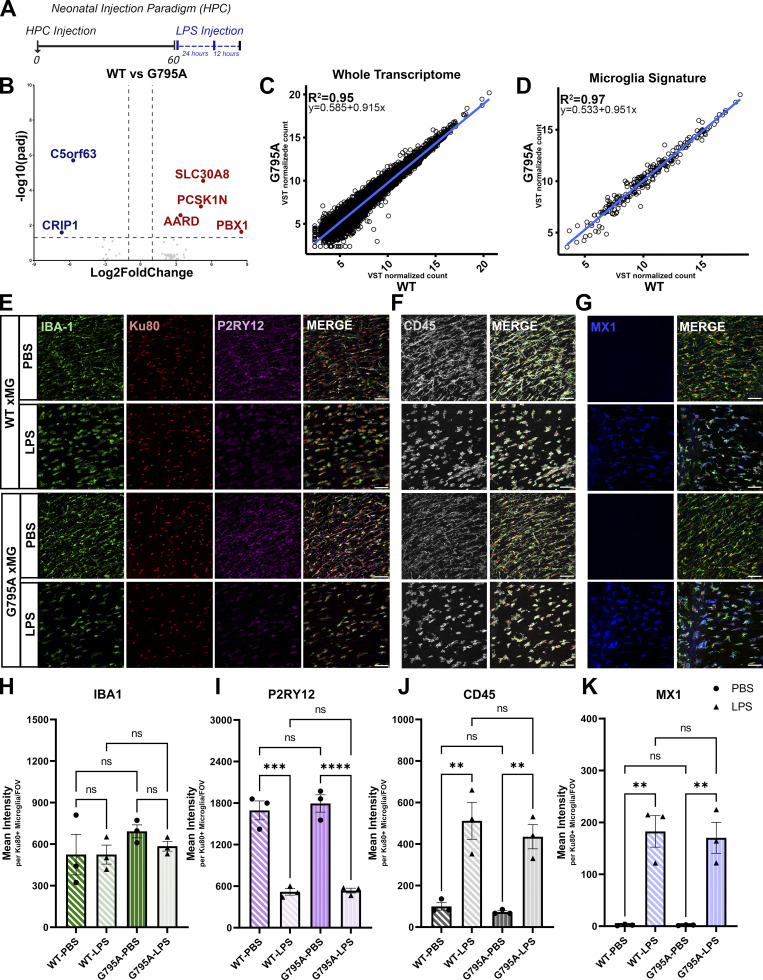
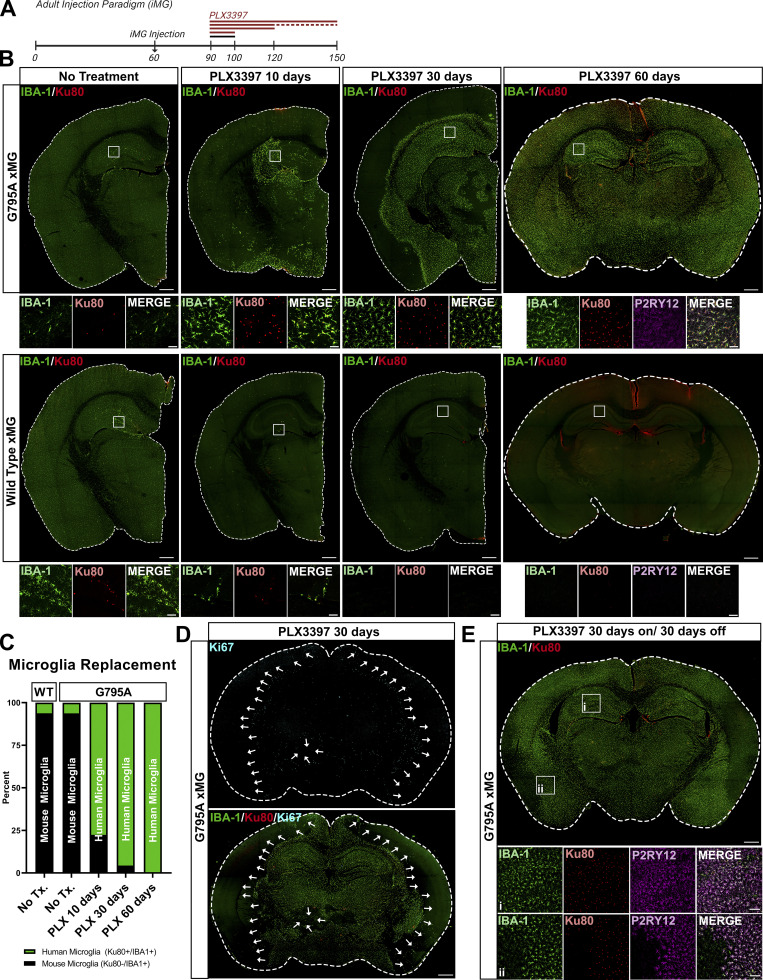
Hematopoietic stem cell transplantation (HSCT) can replace endogenous microglia with circulation-derived macrophages but has high mortality. To mitigate the risks of HSCT and expand the potential for microglia replacement, we engineered an inhibitor-resistant CSF1R that enables robust microglia replacement. A glycine to alanine substitution at position 795 of human CSF1R (G795A) confers resistance to multiple CSF1R inhibitors, including PLX3397 and PLX5622. Biochemical and cell-based assays show no discernable gain or loss of function. G795A- but not wildtype-CSF1R expressing macrophages efficiently engraft the brain of PLX3397-treated mice and persist after cessation of inhibitor treatment. To gauge translational potential, we CRISPR engineered human-induced pluripotent stem cell-derived microglia (iMG) to express G795A. Xenotransplantation studies demonstrate that G795A-iMG exhibit nearly identical gene expression to wildtype iMG, respond to inflammatory stimuli, and progressively expand in the presence of PLX3397, replacing endogenous microglia to fully occupy the brain. In sum, we engineered a human CSF1R variant that enables nontoxic, cell type, and tissue-specific replacement of microglia.


Conflict of interest statement

Disclosures: M.L. Bennett and F.C. Bennett are co-inventors on a pending patent filed by The Board of Trustees of The Leland Stanford Junior University (application 16/566,675) related to methods of microglia replacement. M. Blurton-Jones, J.P. Chadarevian, H. Davtyan, J. Hasselmann, W. England, and R.C. Spitale are co-inventors on a pending patent filed by the University of California Regents (application 63/169,578) related to genetic modification of cells to confer resistance to CSF1R antagonists. M. Blurton-Jones is a co-inventor of patent WO/2018/160496, related to the differentiation of human pluripotent stem cells into microglia. F.C. Bennett is a consultant for and shareholder in Glia Biotherapeutics Inc. M. Blurton-Jones and R.C. Spitale are co-founders of NovoGlia Inc. No other disclosures were reported.

Figures

None
Graphical abstract
Figure S1.
Figure S1.
Engineering an inhibitor-resistant human CSF1R variant. (A) Example of rendered dot plot derivation from a WT mouse 14 d after receiving a GFP+ microglia transplant. Left image, brain tile scan with magnified inset showing few donor-derived microglia engrafted (GFP/green). Right image, rendered dot plot of engrafted cells overlaid onto DAPI channel. Scale bars, 1,000 µm (brain tile), 50 µm (insets). (B) Quantification of microglia depletion expressed as IBA1+ cell density after 7 d of PLX3397 treatment (25 mg/kg/d, subcutaneous, red bars) relative to saline-treated littermates (black bars). Data represented as mean values ± SEM calculated from three matched sagittal sections from n = 2 independent biological replicates per group. (C) Baseline engraftment of GFP+ microglia, BMDMs, and CIMs intracerebrally transplanted into WT animals on P0, P1, P2, or P3 with or without 2 d of 25 mg/kg PLX3397 pretreatment. CIMs are further described starting in G. All animals were harvested 14 d after transplantation. Data represented as mean values ± SEM calculated from three matched sagittal sections from n = 2–3 independent biological replicates per group. Percent engraftment measured as shown in J. (D) Relative abundance of Ba/F3s transduced with WT-CSF1R (black), G795A-CSF1R (green), or D802V-CSF1R (constitutively active, gray) with or without 50 ng/ml CSF1h, 48 h after transduction. Representative data plotted as mean values ± SEM from two to three technical replicates per group from n = 2 independent experiments. (E) Relative abundance of WT or G7595-transduced Ba/F3s 0–72 h after provision with CSF1h and PLX3397 (247 nM). Data represented as mean values ± SEM from three technical replicates from n = 2 independent biological replicates per group. (F) Data table showing PLX3397 IC50, log IC50, standard error of LogIC50, and R2 of IC50 of Ba/F3s transduced with CSF1R variants. + denotes ligand independent mutant, ++ denotes constitutively active control, # denotes variants unable to sustain growth, and ## denotes catalytically dead control. Values calculated from the average of n = 3 independent replicates. (G) Representative image of CIM engraftment in the Csf1r−/− murine brain. P2 cell injection, P16 harvest. IBA1 (red), DAPI (blue). Scale bars, 1,000 and 50 µm (inset). (H) Brightfield images of WT- and G795A-expressing macrophages derived from Csf1r−/− CIMs, 7 d after estrogen removal and CSF1h treatment. (I) IC50 curve of WT- and G795A-transduced BMDMs from FVB WT mice. Data represented as mean values ± SEM from three technical replicates from n = 3 independent biological replicates per group. (J) Method used to calculate percent engraftment depicting total brain area (pink outline) and engrafted area (yellow outline). Scale bar, 1,000 µm. (K) Top: Experimental paradigm depicting timing of CIM injection, PLX3397 treatment, and endpoint. Bottom: Representative rendering of G795A-CIM distribution (green) 14 d after injection into PLX3397 treated Rag2+/+;Il2r𝛾+/+;CSF1h+/+ host. Scale bar, 1,000 µm. (L) Top: Experimental paradigm depicting timing of BMDM injection, PLX3397 treatment, and endpoint. Bottom: Rendering showing G795A-BMDM distribution, 28 d after injection into PLX3397 treated Rag2+/+;Il2r𝛾+/+;CSF1h+/+ host. Image is from most well engrafted animal. Scale bar, 1,000 µm. (M) Quantification of percent area engrafted by GFP+ donor macrophages. Dots represent biological replicates calculated as mean engraftment ± SEM across three matched sagittal sections. G795A-CIMs on PLX3397, n = 18; WT-CIMs on PLX3397, n = 6; G795A-CIMs untreated (no PLX3397), n = 4; G795A-BMDMs on PLX3397, n = 3; WT-BMDMs on PLX3397, n = 4. For CIMs, one-way ANOVA (P = 0.0009). For BMDMs, two-tailed unpaired t test (P = 0.1152). (N and O) Percent engraftment of whole brain (N) and cortical cell density (O) in PLX3397-treated adult Rag2−/−;Il2r𝛾/;CSF1h+/+ mice transplanted with G795A- or WT-CIMs. Dots represent biological replicates calculated as mean engraftment ± SEM across three matched sagittal sections. G795A-CIMs on PLX3397, n = 7; off PLX3397, n = 3; WT-CIMs on PLX3397, n = 5; and G795A untreated (no PLX3397), n = 2. One-way ANOVA (% engraftment: P = 0.0010; cell density: P = 0.0014). (P) Top: Experimental paradigm depicting timing of stereotactic BMDM injection, PLX3397 treatment, and endpoint using 9–12-wk-old Rag2−/−;Il2r𝛾/;CSF1h+/+ mice. Bottom: Representative rendering of G795A-BMDM distribution. (Q) Quantification of percent engraftment of G795A- and WT-BMDMs. Dots represent biological replicates calculated as mean engraftment ± SEM across two matched sagittal sections. G795A-BMDMs, n = 4; WT-BMDMs, n = 2. Unpaired two-tailed t test (P = 0.0324). Unless otherwise noted, P values calculated as Tukey’s HSD: #P < 0.12, *P < 0.05, **P < 0.01.
Figure 1.
Figure 1.
Engineering an inhibitor-resistant CSF1R variant. (A) Model of hCSF1R-PLX3397 crystal structure (Tap et al., 2015), highlighting proximity of candidate variants to PLX3397 binding site (magenta) in kinase pocket (green). (B) PLX3397 inhibition curves for Ba/F3s transduced with CSF1R variants. G795A shown in green; WT shown in black. Representative experiment, repeated twice independently. Best fit lines generated from an average of three technical replicates. (C) Inhibition curves for WT and G795A expressing CIMs generated on the Csf1r−/− background. Curves plotted from mean values ± SEM calculated from three technical replicates from n = 3 independently derived lines per group. (D) Average cell counts per well ± SEM for G795A (green) and WT (white) differentiated CIMs from no PLX3397/no CSF1h conditions at assay endpoint in C. P values calculated using unpaired t test corrected for multiple comparisons using Bonferroni Dunn method. (E) Immunoblots showing pCSF1R Y723, total hCSF1R, pERK, and Actin expression in WT- and G795A-CIMs at a range of PLX3397 concentrations, 3 min following spike-in of 360 ng/ml CSF1h, annotated with mass of protein ladder (kD, on right). Representative of n = 3 independent experiments. Source data are available for this figure: SourceData F1.
Figure 2.
Figure 2.
Widespread engraftment and persistence of transplanted G795A but not WT CIMs in the PLX3397-treated brain. (A) Experimental paradigm depicting the timing of neonatal CIM injection, PLX treatment (290 mg/kg chow) and endpoints at P14 (“On PLX”) and P21 (“Off PLX”). (B) Representative rendering of donor cell distribution and mean engraftment ± SEM, 14 d after cell injection, with continuous PLX treatment. Box i denotes field shown in F. Scale bar, 1,000 µm. (C) Representative rendering showing donor cell distribution 21 d after cell injection. PLX was stopped 7 d prior to harvest. Boxes ii and iii denote fields shown in F. (D) Quantification of brain engraftment by G795A-CIMs in hosts on or off PLX, and WT-CIMs in hosts on PLX. G795A-On PLX: n = 3; G795A-Off Plx: n = 3; WT-On Plx: n = 4. One-way ANOVA (P = 0.0001). (E) Quantification of donor cell density in cortex. G795A-On PLX: n = 3; G795A-Off Plx: n = 3; WT-On Plx: n = 4. One-way ANOVA (P = 0.0070). Dotted gray line represents average endogenous IBA1+ cells from n = 3 age-matched controls. (F) Representative images of G795A- and WT-CIMs following neonatal transplant, showing donor cell GFP (green), IBA1 immunostaining (red), and DAPI (blue) On and Off PLX. Row 4 displays endogenous microglia repopulation after PLX removal from box iii in C. Scale bar, 50 µm. (G) Experimental paradigm depicting timing of adult CIM injection, PLX treatment, and endpoints at D14 (On PLX) and D21 (Off PLX). (H) Representative rendering of G795A-CIM distribution and mean engraftment ± SEM, 14 d after cell injection, with continuous PLX treatment. Scale bar, 1,000 µm. (I) Representative image of G795A-CIM distribution and mean engraftment ± SEM, 21 d after cell injection. PLX was stopped 7 d prior to harvest. Scale bar, 1,000 µm. (J) Quantification of cortical engraftment area by G795A and WT donor CIMs. G795A-On PLX: n = 6; G795A-Off Plx: n = 3; WT-On Plx: n = 5. One-way ANOVA (P < 0.0001). (K) Quantification of donor cell density in cortex. One-way ANOVA (P = 0.0019). (L) Representative images of G795A and WT CIMs following adult transplant, showing donor cell GFP (green), IBA1 immunostaining (red), and DAPI (blue) both On (rows 1 and 2) and Off PLX (row 3). Scale bar, 50 µm. (M) Top: Representative confocal image of G795A-CIM morphology (green), IBA1 immunostaining (red), TMEM119 immunostaining (white), and DAPI (blue). Scale bar, 25 µm. Bottom: Representative confocal image of G795A-CIM morphology (green), IBA1 immunostaining (red), Ms4a7 in situ (white), and DAPI (blue). Scale bar, 25 µm. In D, E, J, and K, dots represent biological replicates, each the average of three matched sagittal sections. Error bars represent SEM. P values calculated as Tukey’s HSD: *P < 0.05, **P < 0.01, ***P < 0.001, ****P < 0.0001.
Figure 3.
Figure 3.
Human G795A iPSC-derived microglia exhibit robust viability and minimal alterations to gene expression in response to CSF1R inhibitors. (A) Crystal structure of hCSF1R-PLX3397 and hCSF1R-PLX5622 highlighting G795 residue in the kinase domain. (B) Molecular modeling of G795 variants G795A, G795C, and G795V demonstrating increasing R-group sizes. (C and D) Caspase 3/7 levels imaged over 24 h in iMG cultured in complete medium treated with 0.1% DMSO, 250 nM, 500 nM, or 1 µM PLX3397 (C) and equivalent concentrations of PLX5622 (D). Data captured from four images/well from n = 6 independent wells. Data represented as mean values ± SEM. (E and F) Quantification of cell death by fluorescent Caspase 3/7 Dye for Apoptosis after 24 h in culture with PLX3397 (E) and PLX5622 (F). Data captured from four images/well from n = 6 independent wells. Data represented as mean values ± SEM. P value, one-way ANOVA (P < 0.0001). Tukey’s HSD; ****P < 0.0001. (G–J) Bulk RNA-seq analysis of WT-, G795A-, and G795C-iMG. (G) Principal component analysis using the top 2,000 most variably expressed genes between WT-, G795A-, and G795C-iMG cultured for 24 h with 0.1% DMSO or 250 nM PLX5622 (n = 4 replicates per line, per condition) revealing that the primary source of variation is the WT response to PLX5622. (H) Linear regression analysis and the coefficient of determination between DMSO-treated G795A or G795C and WT microglia, confirming a high degree of concordance when comparing either the full transcriptome (G795A, R2 = 0.96–0.99; G795C, R2 = 0.97–0.98) or a 249-gene microglia signature (G795A, R2 = 0.97–0.99; G795C, R2 = 0.97–0.98). (I–K) Volcano plots comparing 24-h treatment with 250 nM PLX5622, revealing significant transcriptomic alterations (Log2(FC) ≥ 1; FDR ≤ 0.05) in WT microglia (I), but no significant changes in G795A microglia compared with DMSO-treated cells (J) nor G795C microglia compared with DMSO-treated cells (K).
Figure S2.
Figure S2.
Human G795A and G795C iPSC-derived microglia are resistant to multiple CSF1Ri. (A) Chromatograms of CRISPR-modified isogenic set of CSF1R-G795A, G795C, and G795V human iPSC lines. (B and C) Quantification of iMG cell death by fluorescent Caspase 3/7 Dye for Apoptosis over 24 h in culture with complete medium treated with 0.1% DMSO, 250 nM, 500 nM, or 1 µM Edicotinib (B) and equivalent concentrations of BLZ945 (C). (D) Live (Calcein-AM) versus dead (ethidium homodimer-1) percent quantification of WT and G795A microglia cultured with 0.1% DMSO or 500 nM of PLX3397, PLX5622, Edicotinib, or BLZ945. Data captured from four images/well from n = 6 independent wells using an Incucyte S3 live-cell imaging system. Data represented as percent mean values. (E–G) Percent confluency of iMG normalized to t = 0 h over 24 h in culture with complete medium treated with 0.1% DMSO or 500 nM PLX3397 (E), PLX5622 (F), Edicontinib (G), or BLZ945 (H). Data captured from four images/well from n = 6 independent wells using an Incucyte S3 live-cell imaging system. Data represented as mean values ± SEM. (I and J) Hierarchical clustering and Pearson correlation of normalized RNA counts of the whole transcriptome (I) and a 249-gene microglia signature (J) between WT (black), G795A (green), and G795C (blue) iMG cultured with 0.1% DMSO or 250 nM PLX5622 (n = 4 replicates per cell line, per condition). Lightest shade of blue in I and J indicates correlations of R = 0.93; darkest shade of blue indicates R = 1.0 correlation.
Figure 4.
Figure 4.
CSF1R-G795A microglia engraft and respond to neuroinflammation in the adult murine brain. (A) Schematic depicting neonatal HPC injection paradigm, with endpoints (black ticks) at 60 d and after LPS injections, and LPS injection paradigm (blue line). (B) Volcano plot comparing differential gene expression by RNA-seq between G795A- and WT-xMG 2 mo after transplantation (FDR ≤ 0.05; log2(FC) ≥ ±1). (C and D) Linear regression analysis and the coefficient of determination between WT- and G795A-xMG when examining the full transcriptome (C; R2 = 0.74–0.95) and a 249-gene microglia signature (D; R2 = 0.78–0.97). (E) Immunostaining for IBA1+ (green)/Ku80+ (red) WT- and G795A-xMG demonstrates decreased expression of P2RY12 (purple) in response to LPS treatment. (F and G) Conversely, WT- and G795A-xMG increase expression of CD45 (F; white) and MX1 (G; blue) in response to LPS treatment. Representative 40× images. Scale bar, 50 µm. (H–K) Quantification of E–G. One-way ANOVA IBA1 (P = 0.5061); P2RY12 (P < 0.0001); CD45 (P = 0.0007); MX1 (P = 0.0003). Tukey’s HSD; **P < 0.01, ***P < 0.001, ****P < 0.0001. Data represented as mean intensity normalized to number of Ku80+/IBA1+ human microglia per FOV for all antibodies calculated from three matched coronal sections per animal (n = 3 biological replicates). Error bars, SEM.
Figure 5.
Figure 5.
CSF1R inhibition enables the replacement of murine microglia with human G795A microglia in adult mice. (A) Schematic depicting timing of stereotactic iMG injection, PLX3397 treatment (red, 600 mg/kg chow) and endpoints at 90 (10 d of treatment or no treatment [black]), 120 d (30 d of treatment), 120 d (30 d on/30 d off treatment), and 150 d (60 d of treatment). (B) IBA1+ (green) and Ku80+ (red) G795A (top) and WT (bottom) human microglia exhibit limited engraftment within the adult murine brain without PLX3397 treatment (left). G795A microglia remain viable and progressively expand from the injection site across 10–60 (left-right) days of PLX3397 treatment while endogenous murine (Ku80−/IBA1+) and transplanted WT human microglia (bottom) are depleted by CSF1R inhibition. Brain stitch scale bar, 500 µm. Representative 40× scale bar, 50 µm. (C) Quantification of percent human (Ku80+/IBA1+) versus mouse (Ku80−/IBA1+) microglia reveal a progressive replacement of endogenous microglia, with 99% of microglia expressing the human nuclear marker Ku80 within 60 d. Counts calculated from three matched coronal sections per animal (n = 3 biological replicates per condition). (D) G795A microglia proliferate from the initial injection sites throughout the murine brain with a distinctive Ki67+ wavefront (blue, arrows). Scale bar, 100 µm. (E) G795A microglia persist in engrafted regions after cessation of 30 d PLX3397 treatment and immunostain for homeostatic microglia marker P2RY12 (purple). Brain stitch scale bar, 500 µm. Representative 20× scale bar, 100 µm.
Figure S3.
Figure S3.
G795A microglia proliferate along distinct wavefronts in the murine brain. (A) Representative confocal 10× stitch image of engrafted and proliferating G795A microglia after 30 d of CSF1Ri. Ki67+ mitotic cells (blue), Ku80+ human nuclei (red), and IBA1+ microglia (green). (B) 40× representative images of Ki67+ G795A microglia in proliferating wavefront and Ki67− G795A microglia within the initial hippocampal injection site. (C) Proliferating microglia in the wavefront exhibit significantly higher levels of human nuclear marker Ku80. Unpaired t test t(4) = 3.008, *P = 0.0396. (D) Representative 10× stitch image of P2RY12 expressing G795A microglia after 30 d of CSF1Ri. P2RY12 (purple), Ku80 (red), IBA1 (green). (E) 40× representative images of P2RY12-low G795A microglia in the wavefront and P2RY12-high G795A microglia within the hippocampus. (F) Proliferating microglia in the wavefront exhibit significantly lower levels of microglia homeostatic marker P2RY12. Unpaired t test t(4) = 7.545, **P = 0.0017. (G) Representative 10× stitch image of LGALS-3 expressing G795A microglia after 30 d of CSF1Ri. LGALS-3 (orange), Ku80 (red), IBA1 (green). (H) 40× representative images of G795A microglia expressing LGALS-3 within the proliferative wavefront with diminished expression within the hippocampus. (I) Proliferating microglia in the wavefront exhibit significantly higher levels of microglia activation marker LGALS-3. Unpaired t test t(4) = 9.511, ***P = 0.0007. Data represented as integrated density normalized to number of Ku80+/IBA1+ human microglia per FOV for all antibodies calculated from three matched coronal sections per animal (n = 3 biological replicates per region). Error bars, SEM. Representative 10× stitch scale bar, 100 µm. Representative 40× scale bar, 25 µm.

Comment in

  • Engineering mighty microglia.
    Walsh AE, Lukens JR. Walsh AE, et al. J Exp Med. 2023 Mar 6;220(3):e20222070. doi: 10.1084/jem.20222070. Epub 2023 Jan 17. J Exp Med. 2023. PMID: 36648421 Free PMC article.

References

    1. Abud, E.M., Ramirez R.N., Martinez E.S., Healy L.M., Nguyen C.H.H., Newman S.A., Yeromin A.V., Scarfone V.M., Marsh S.E., Fimbres C., et al. . 2017. iPSC-derived human microglia-like cells to study neurological diseases. Neuron. 94:278–293.e9. 10.1016/j.neuron.2017.03.042 - DOI - PMC - PubMed
    1. Amin, S., Carling G., and Gan L.. 2022. New insights and therapeutic opportunities for progranulin-deficient frontotemporal dementia. Curr. Opin. Neurobiol. 72:131–139. 10.1016/j.conb.2021.10.001 - DOI - PubMed
    1. Andrews, S. 2014. FastQC a quality-control tool for high-throughput sequence data. http://www.bioinformatics.babraham.ac.uk/projects/fastqc/
    1. Bennett, F.C., Bennett M.L., Yaqoob F., Mulinyawe S.B., Grant G.A., Hayden Gephart M., Plowey E.D., and Barres B.A.. 2018. A combination of ontogeny and CNS environment establishes microglial identity. Neuron. 98:1170–1183.e8. 10.1016/j.neuron.2018.05.014 - DOI - PMC - PubMed
    1. Bennett, M.L., Bennett F.C., Liddelow S.A., Ajami B., Zamanian J.L., Fernhoff N.B., Mulinyawe S.B., Bohlen C.J., Adil A., Tucker A., et al. . 2016. New tools for studying microglia in the mouse and human CNS. Proc. Natl. Acad. Sci. USA. 113:E1738–E1746. 10.1073/pnas.1525528113 - DOI - PMC - PubMed

Publication types

MeSH terms

Substances