. 2023 Feb:59:102582.
doi: 10.1016/j.redox.2022.102582. Epub 2022 Dec 22.

Microbiota-induced lipid peroxidation impairs obeticholic acid-mediated antifibrotic effect towards nonalcoholic steatohepatitis in mice

Affiliations

Microbiota-induced lipid peroxidation impairs obeticholic acid-mediated antifibrotic effect towards nonalcoholic steatohepatitis in mice

Aoxiang Zhuge et al. Redox Biol. 2023 Feb.

Abstract

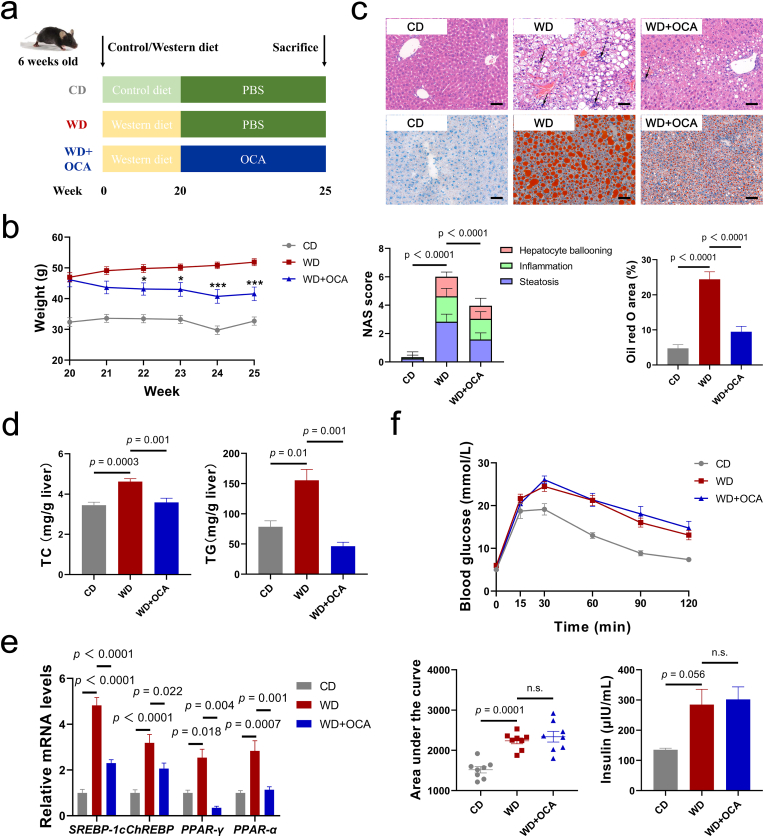
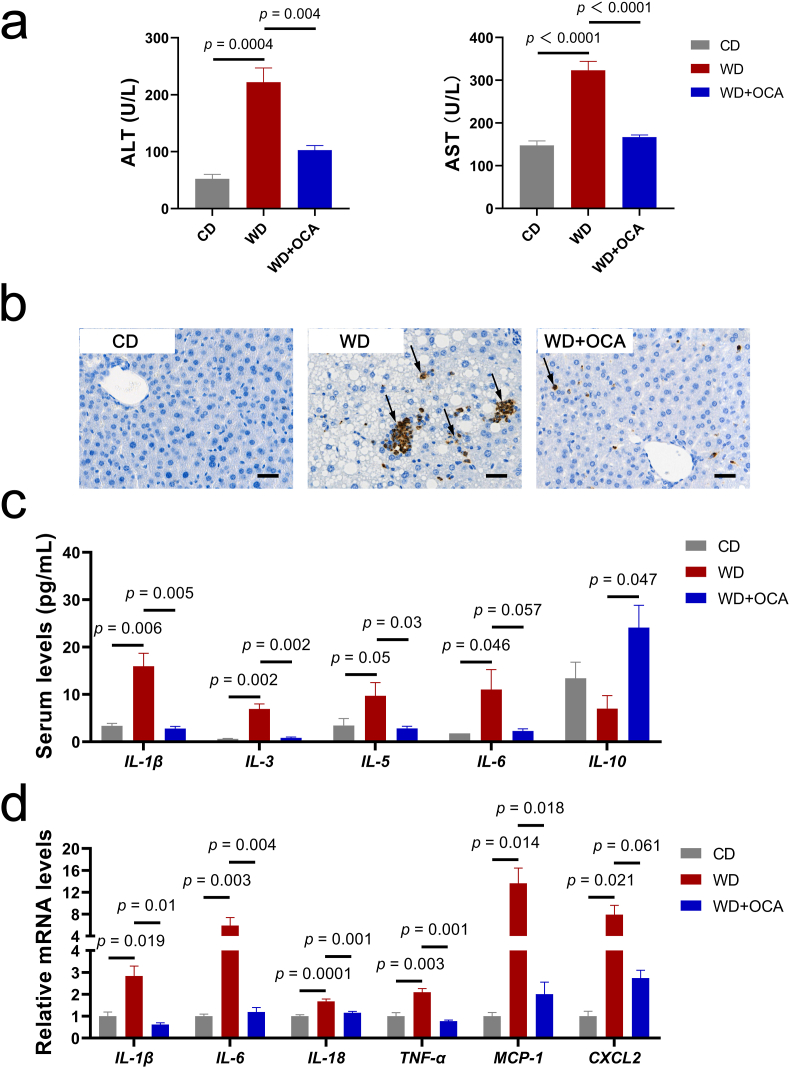
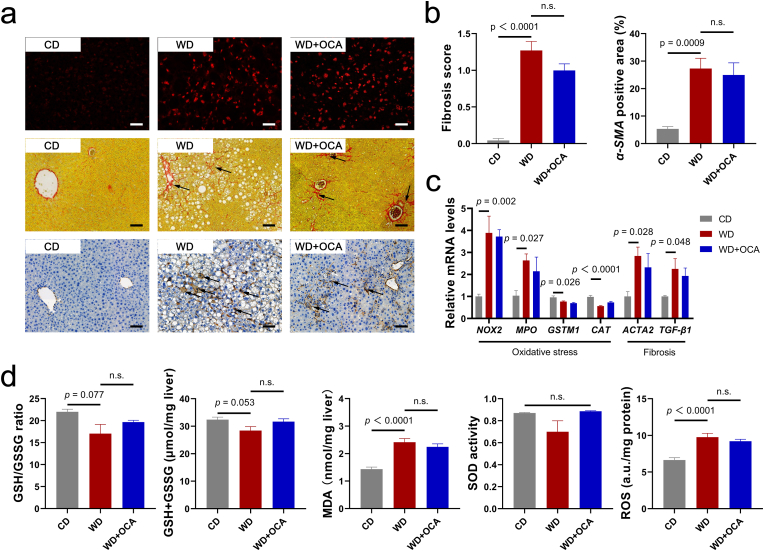
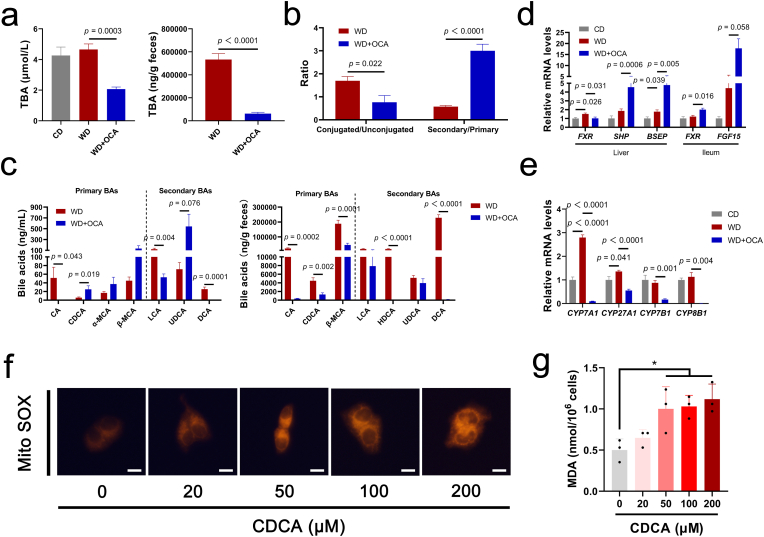
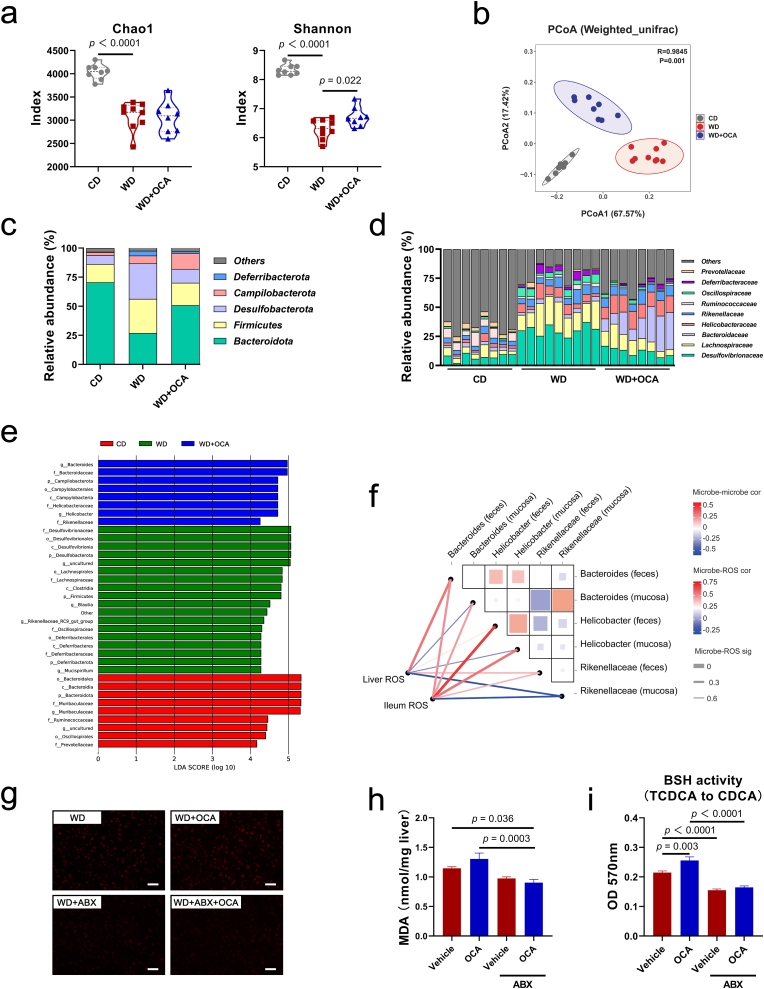
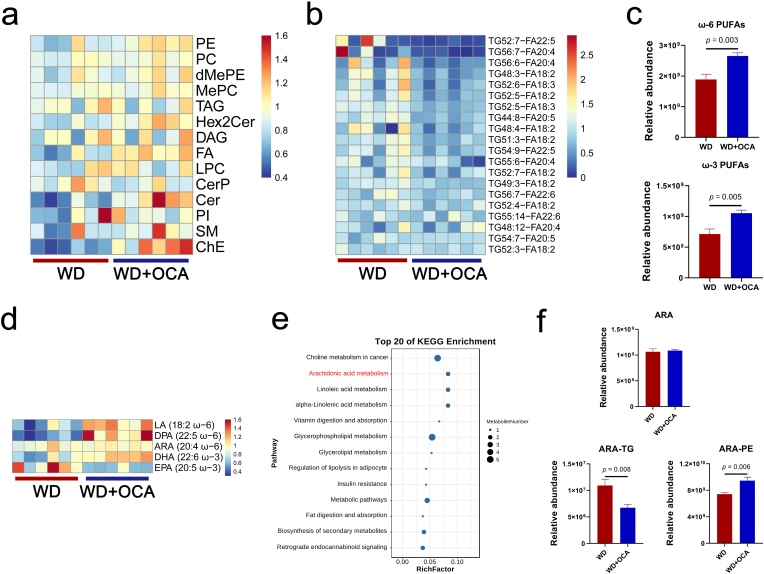
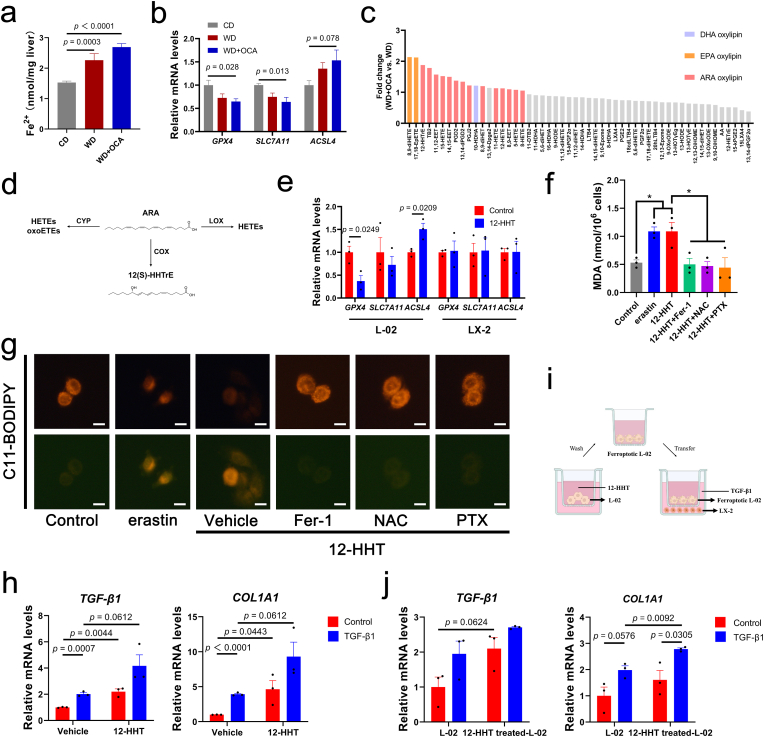
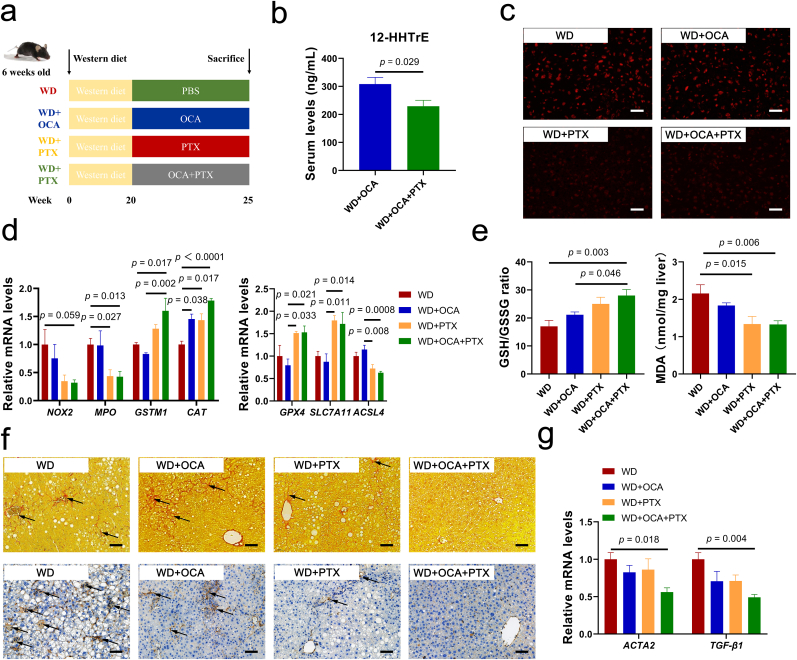
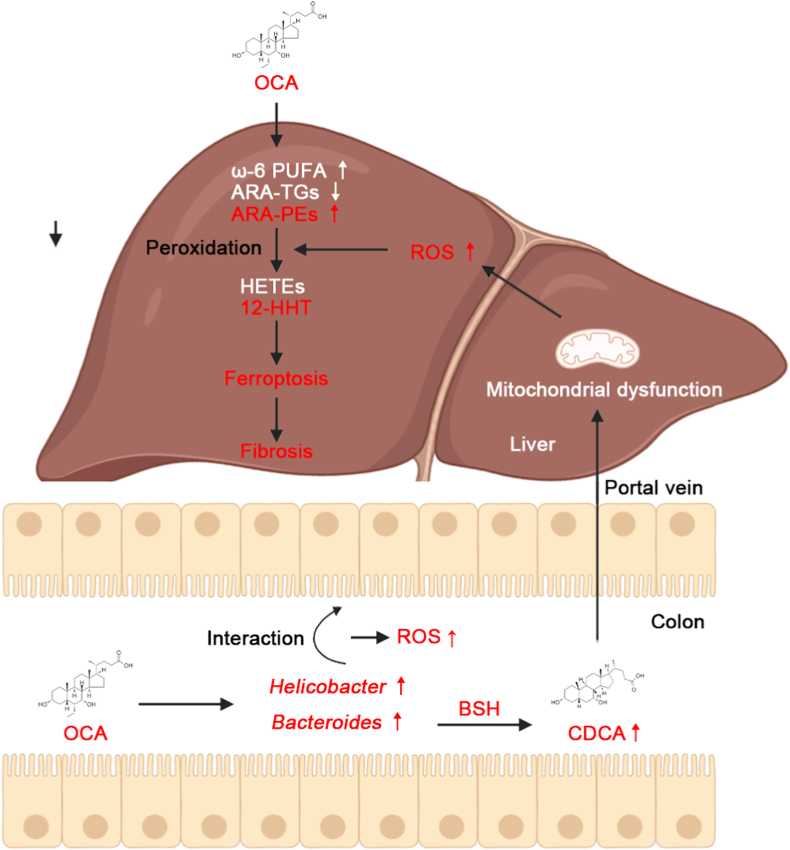
Obeticholic acid (OCA) has been examined to treat non-alcoholic steatohepatitis (NASH), but has unsatisfactory antifibrotic effect and deficient responsive rate in recent phase III clinical trial. Using a prolonged western diet-feeding murine NASH model, we show that OCA-shaped gut microbiota induces lipid peroxidation and impairs its anti-fibrotic effect. Mechanically, Bacteroides enriched by OCA deconjugates tauro-conjugated bile acids to generate excessive chenodeoxycholic acid (CDCA), resulting in liver ROS accumulation. We further elucidate that OCA reduces triglycerides containing polyunsaturated fatty acid (PUFA-TGs) levels, whereas elevates free PUFAs and phosphatidylethanolamines containing PUFA (PUFA-PEs), which are susceptible to be oxidized to lipid peroxides (notably arachidonic acid (ARA)-derived 12-HHTrE), inducing hepatocyte ferroptosis and activating hepatic stellate cells (HSCs). Inhibiting lipid peroxidation with pentoxifylline (PTX) rescues anti-fibrotic effect of OCA, suggesting combination of OCA and lipid peroxidation inhibitor could be a potential antifibrotic pharmacological approach in clinical NASH-fibrosis.


Conflict of interest statement

Declaration of competing interest The authors declare no conflicts of interest.

Figures

Fig. 1
Fig. 1
OCA ameliorates hepatic lipid accumulation but exhibits limit impact on insulin resistance. (a) Experimental design. (b) Body mass change after OCA administration (n = 8 per group). (c) Representative images of liver sections stained with HE and Oil red O (upper channel) and corresponding NAS score and Oil red O area index (n = 8 per group) (lower channel), scale bar 80 μm. Arrows indicate inflammatory cell infiltration in the liver. (d) Levels of TC and TG in the liver (n = 7–8 per group). (e) Liver expressions of lipid metabolism gene SREBP-1c, ChREBP, PPAR-γ and PPAR-α (n = 6 per group). (f) Intravenous glucose tolerance test (IGTT), area under the curve (AUC) and serum insulin levels (n = 7–8 per group). Data are presented as mean ± SEM. (For interpretation of the references to color in this figure legend, the reader is referred to the Web version of this article.)
Fig. 2
Fig. 2
OCA alleviates hepatic and systemic inflammation. (a) Serum ALT and AST levels (n = 8 per group). (b) Representative images of liver sections with MPO immunohistochemistry staining, scale bar 40 μm. Arrows indicate neutrophil infiltration in the liver. (c) Serum concentrations of inflammatory cytokines IL-1β, IL-3, IL-5, IL-6 and IL-10 (n = 8 per group). (d) Liver expressions of inflammatory genes IL-1β, IL-6, IL-18, TNF-α, MCP-1 and CXCL2 (n = 6 per group). Data are presented as mean ± SEM.
Fig. 3
Fig. 3
OCA exerts limited anti-oxidative and anti-fibrotic effects. (a) Representative images of liver sections with dihydroethidium (DHE) (scale bar 40 μm), Sirius Red and α-SMA (scale bar 80 μm) immunohistochemistry staining. Arrows indicate collagen fibers and α-SMA expressions in the liver. (b) Fibrosis score based on Sirius Red staining according to NAS scoring system and α-SMA positive area (n = 8 per group). (c) Liver expressions of oxidative-damage-related genes NOX2, MPO, GSTM1 and CAT, and fibrosis-related genes ACTA2 and TGF-β1 (n = 6 per group). (d) Hepatic concentrations of oxidative stress biomarkers GSH, MDA, SOD and ROS (n = 8 per group). Data are presented as mean ± SEM. (For interpretation of the references to color in this figure legend, the reader is referred to the Web version of this article.)
Fig. 4
Fig. 4
OCA-derived CDCA induces mitochondrial ROS accumulation. (a) Total bile acid (TBA) levels in the serum and stool (n = 7–8 per group). (b) Compositions of BA in the serum (n = 7–8 per group). (c) BA profiles in the serum and stool (n = 7–8 per group). (d) Expression of FXR signals and its target genes SHP, BSEP and FGF15 (n = 6 per group). (e) Hepatic mRNA expression levels of BA synthetic enzymes CYP7A1, CYP27A1, CYP7B1 and CYP8B1 (n = 6 per group). Mitochondrial ROS detected by Mito-Tracker Red CMXRos (red, scale bar 10 μm) (f) and MDA levels (g) in the human hepatocyte cell line L-02 treated with different concentrations of CDCA (n = 3 per group). Data are presented as mean ± SEM. *p < 0.05. (For interpretation of the references to color in this figure legend, the reader is referred to the Web version of this article.)
Fig. 5
Fig. 5
OCA-shaped gut microbiota induces lipid peroxidation. (a) α-diversity indexes Chao1 and Shannon (n = 8–9 per group). (b) PCoA analysis based on Weighted UniFrac distance (n = 8–9 per group). Relative abundance at the phylum (c) and family (d) level (n = 8–9 per group). (e) Linear discriminant analysis (LDA) Effect Size (LEfSe) related LDA score of differential taxa. Only the taxa whose LDA score > 4 is displayed. (f) Correlation heatmap between ROS levels and gut microbial taxa based on the Spearman analysis. Color key and square size indicates the strength of correlation between microbes (r value). Color key (r value) and line width (p value) indicates the strength of correlation between microbe and ROS levels. Dark red indicates a more positive correlation; dark blue indicates a more negative correlation; white indicates no correlation. Thicker line indicates a more significant difference. (g) Representative images of liver sections with DHE staining in mice treated with OCA with or without antibiotics, scale bar 40 μm. (h) Hepatic MDA levels in mice treated with OCA with or without antibiotics (n = 8 per group). (i) Gut microbial BSH activity analyzed by ninhydrin assay (TCDCA to CDCA) (n = 8 per group). Data are presented as mean ± SEM. ABX, antibiotics. (For interpretation of the references to color in this figure legend, the reader is referred to the Web version of this article.)
Fig. 6
Fig. 6
OCA selectively alters hepatic lipid profiles. (a) Heatmap of hepatic lipid classes. (b) Lipidomic analyses of triglycerides (TG) species containing fatty acid with two or more double bonds (PUFA). (c) Free ω-3 and ω-6 PUFAs quantification. (d) Classes of ω-3 and ω-6 PUFAs. (e) KEGG enrichment analysis between WD-fed and OCA-treated mice. (f) Hepatic concentrations of ARA, ARA-containing TG and ARA-containing PE. n = 6 per group. Data are presented as mean ± SEM. LA, linoleic acid. DPA, docosa-pentaenoic acid. ARA, arachidonic acid. DHA, doco-sahexaenoic acid. EPA, eicosapentaenoic acid. TG, triglycerides. PE, phosphatidylethanolamine.
Fig. 7
Fig. 7
PUFA-derived lipid peroxide 12-HHTrE induces hepatocyte ferroptosis and activates HSCs. (a) Hepatic Fe2+ quantification (n = 8 per group). (b) Relative mRNA expressions of ferroptosis genes (n = 8 per group) (c) Fold change of differential lipid peroxides between OCA-treated and WD-fed mice based on targeted peroxide omics (n = 6 per group). (d) Metabolic diagram of ARA-derived oxylipins. (e) Expressions of ferroptosis genes of 12-HHT-treated L-02 or LX-2 cells (n = 3 per group). (f) MDA levels of L-02 treated with erastin or 12-HHT with or without ferroptosis inhibitor Fer-1, NAC and PTX (n = 3 per group). (g) Lipid peroxidation of L-02 with different treatments detected by C11-BODIPY, scale bar 10 μm. (h) Expressions of fibrotic genes of LX-2 treated with 12-HHT (n = 3 per group). (i) Co-cultrue model using transwell assay. (j) Expressions of fibrotic genes of LX-2 co-cultured with 12-HHT-treated L-02 (n = 3 per group). Data are presented as mean ± SEM. *p < 0.05. 12-HHTrE, 12S-hydroxy-5Z,8E,10E-heptadecatrienoicacid. Fer-1, ferrostatin-1. NAC, N-Acetyl-l-cysteine. PTX, Pentoxifylline.
Fig. 8
Fig. 8
Combined OCA and lipid peroxidation inhibitor PTX impede ferroptosis and advanced fibrosis in NASH. (a) Experimental design. (b) Serum levels of 12-HHT (n = 6–7 per group). (c) Representative images of liver sections with dihydroethidium (DHE) staining, scale bar 40 μm. (d) Liver mRNA expressions of oxidative-damage-related genes NOX2, MPO, GSTM1, CAT and ferroptosis-related genes GPX4, SLC7A11 (n = 5–6 per group). (e) Hepatic concentrations of oxidative stress biomarkers GSH and MDA (n = 5–8 per group). (f) Representative images of liver sections with Sirius Red and α-SMA immunohistochemistry staining, scale bar 80 μm. (g) Liver mRNA expressions of fibrosis biomarkers ACTA2 and TGF-β1 (n = 5–6 per group). Data are presented as mean ± SEM. 12-HHTrE, 12S-hydroxy-5Z,8E,10E-heptadecatrienoicacid. (For interpretation of the references to color in this figure legend, the reader is referred to the Web version of this article.)
Fig. 9
Fig. 9
Proposed mechanism for poor anti-fibrotic effect of OCA against NASH. OCA alters gut microbial composition, notably enriching oxidative stress-corresponding Helicobacter and Bacteroides. Helicobacter is related with gut ROS accumulation, and Bacteroides induces liver ROS overload through BSH-mediated excessive CDCA generation from deconjugation of conjugated bile acids. Additionally, OCA selectively regulates hepatic lipid profiles, characterized as reductions in ARA-TGs and elevations in ω-6 PUFAs and ARA-PEs, which are susceptible to lipid peroxidation. 12-HHT is identified as a key effector impairing anti-ferroptotic and anti-fibrotic effect of OCA.

References

    1. Sinal C.J., Tohkin M., Miyata M., Ward J.M., Lambert G., Gonzalez F.J. Targeted disruption of the nuclear receptor FXR/BAR impairs bile acid and lipid homeostasis. Cell. 2000;102:731–744. - PubMed
    1. Huang W., Ma K., Zhang J., Qatanani M., Cuvillier J., Liu J., Dong B., Huang X., Moore D.D. Nuclear receptor-dependent bile acid signaling is required for normal liver regeneration. Science. 2006;312:233–236. - PubMed
    1. Ma K., Saha P.K., Chan L., Moore D.D. Farnesoid X receptor is essential for normal glucose homeostasis. J. Clin. Invest. 2006;116:1102–1109. - PMC - PubMed
    1. Zhang Y., Castellani L.W., Sinal C.J., Gonzalez F.J., Edwards P.A. Peroxisome proliferator-activated receptor-gamma coactivator 1alpha (PGC-1alpha) regulates triglyceride metabolism by activation of the nuclear receptor FXR. Genes Dev. 2004;18:157–169. - PMC - PubMed
    1. Sun L., Cai J., Gonzalez F.J. The role of farnesoid X receptor in metabolic diseases, and gastrointestinal and liver cancer. Nat. Rev. Gastroenterol. Hepatol. 2021;18:335–347. - PubMed

Publication types

MeSH terms