. 2023 Jan 9;41(1):210-225.e5.
doi: 10.1016/j.ccell.2022.12.005. Epub 2022 Dec 29.

Determinants of resistance to engineered T cell therapies targeting CD19 in large B cell lymphomas

Affiliations

Determinants of resistance to engineered T cell therapies targeting CD19 in large B cell lymphomas

Brian J Sworder et al. Cancer Cell. .

Abstract

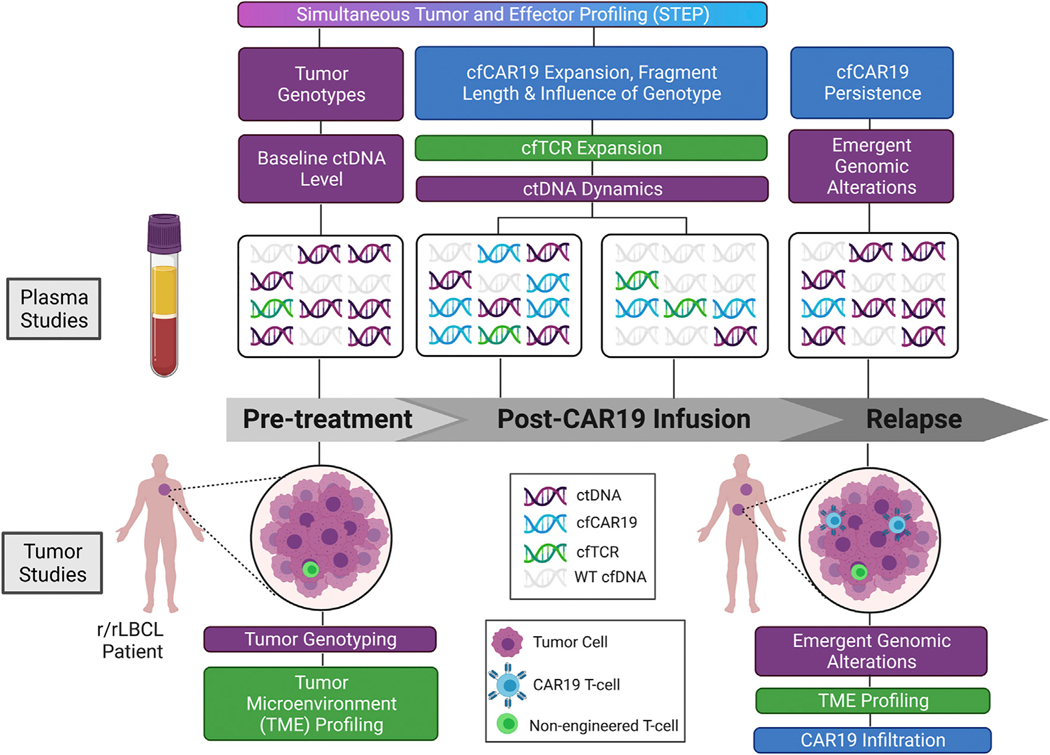
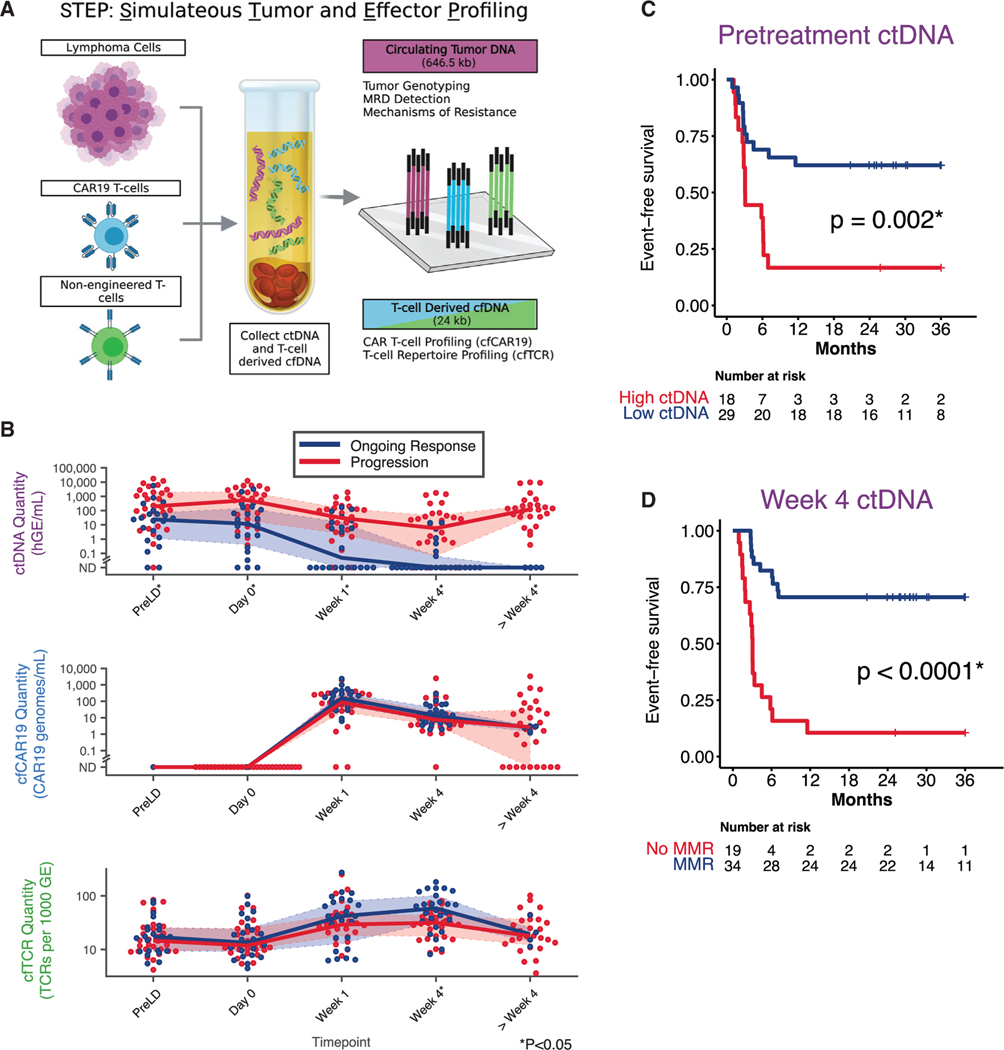
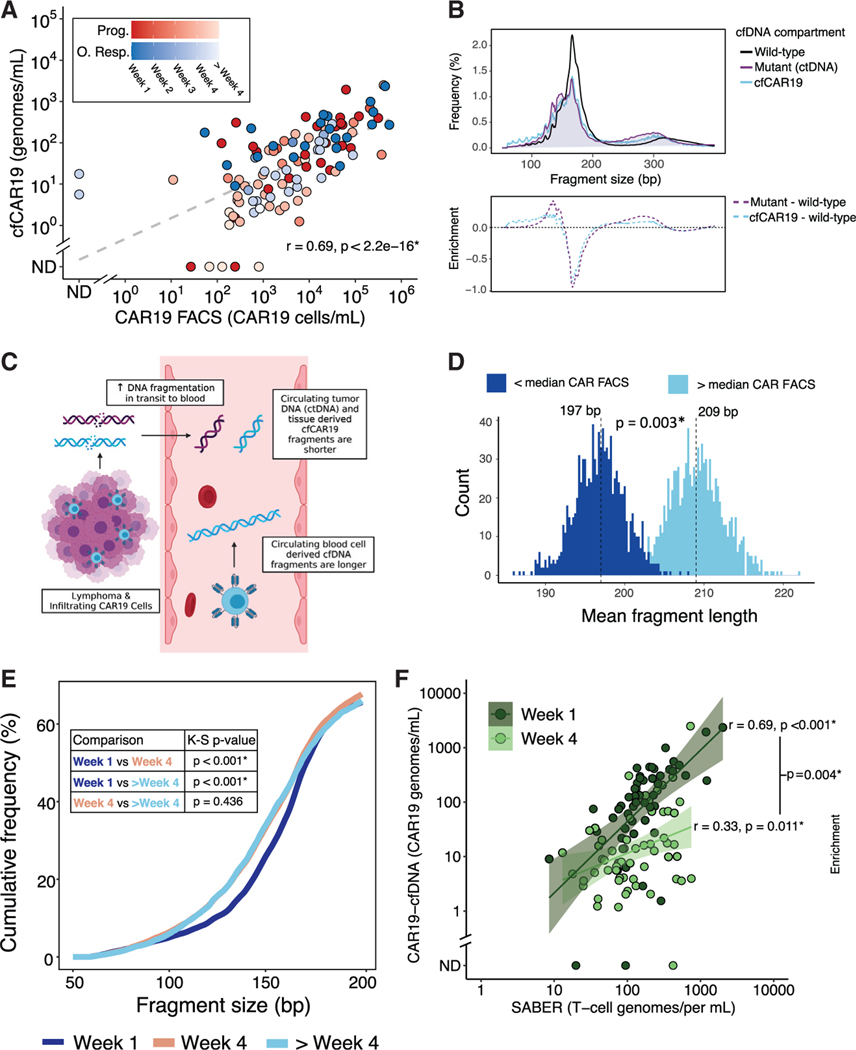
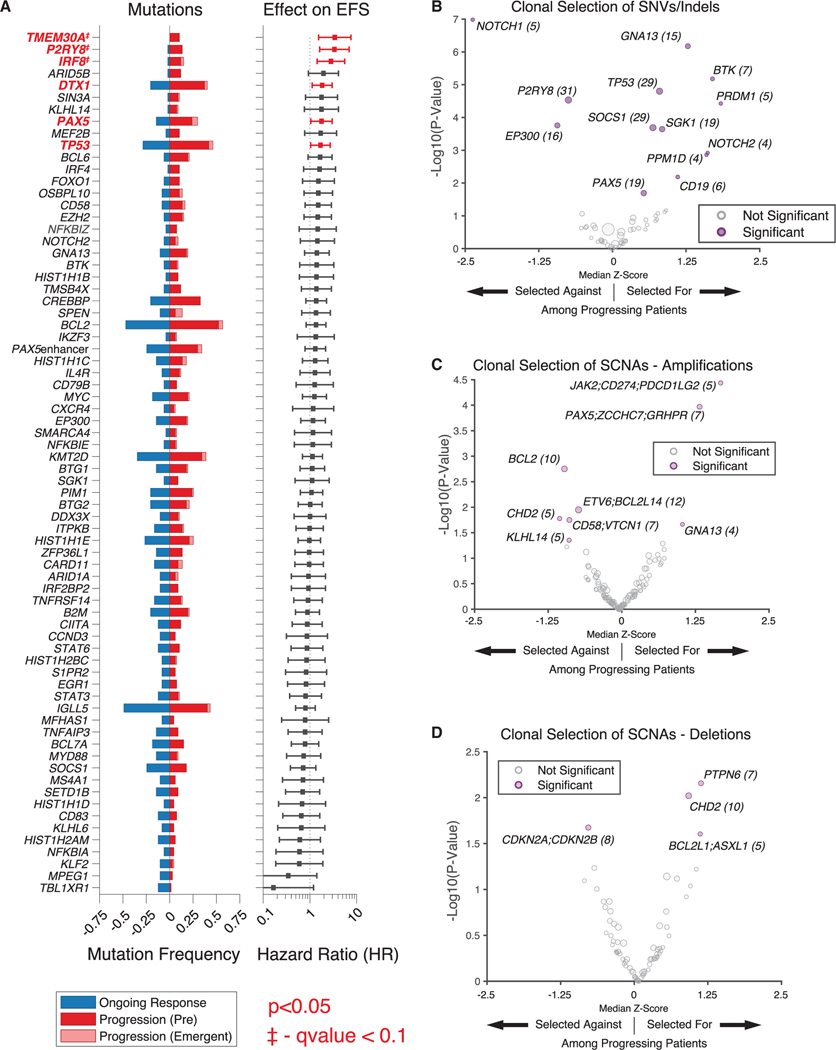
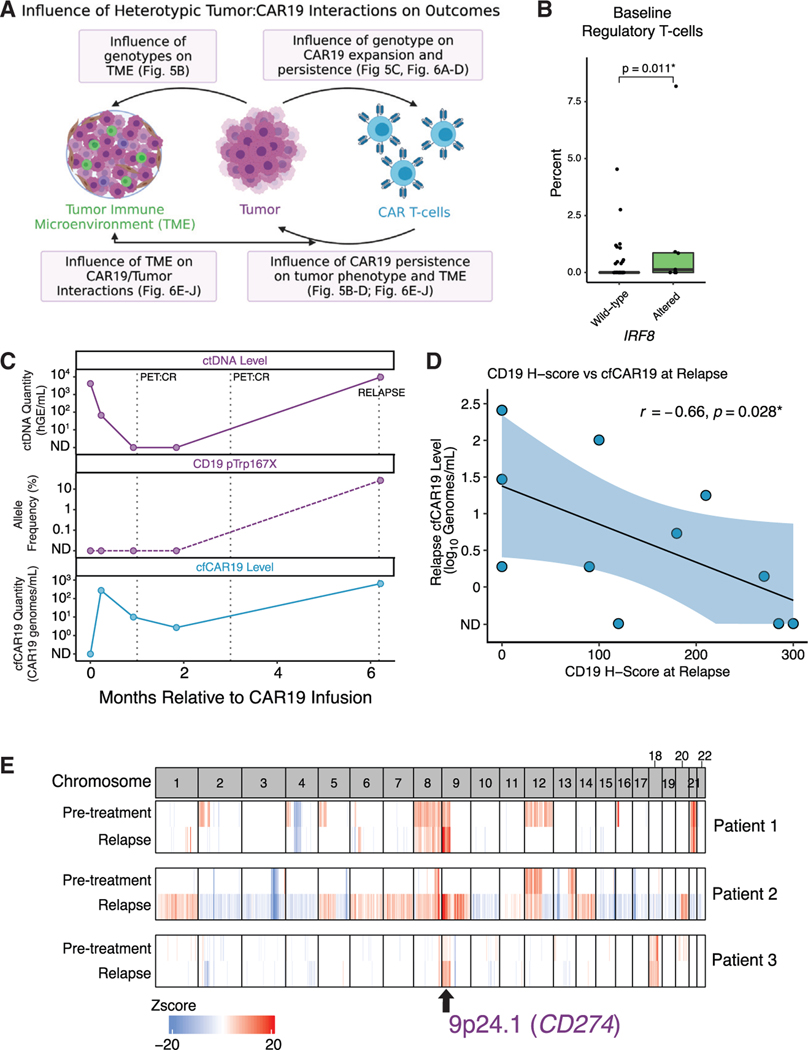
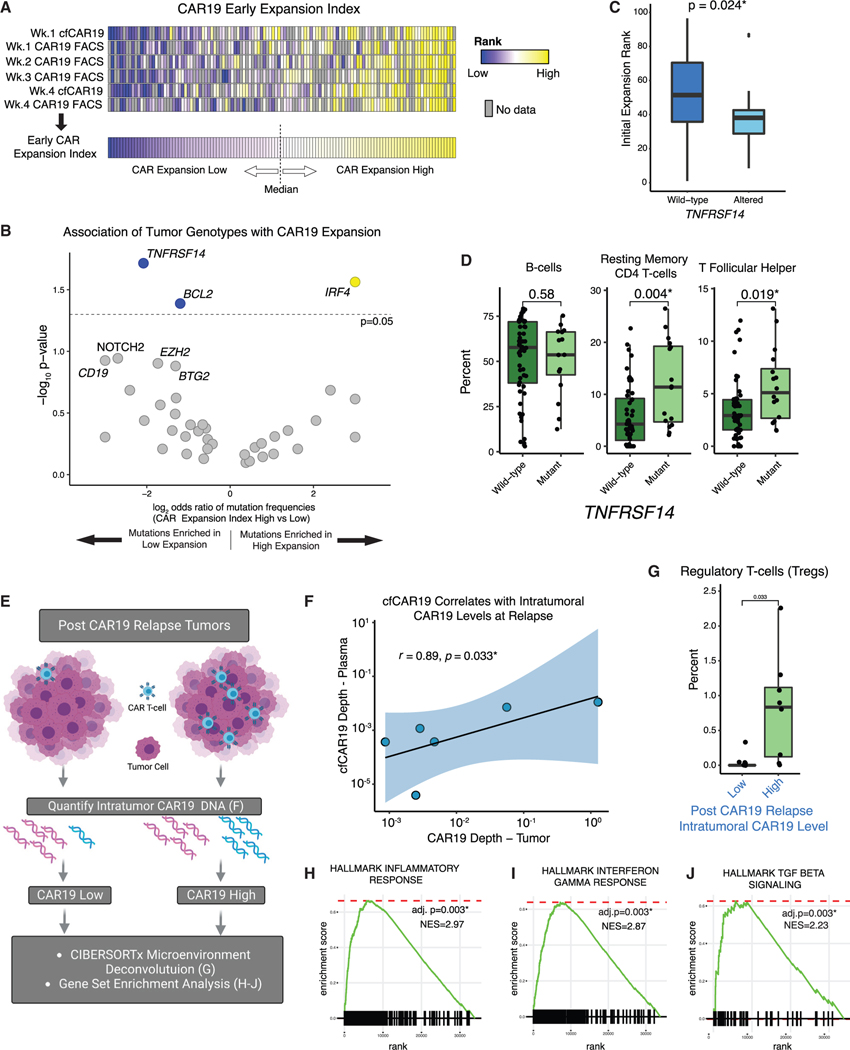
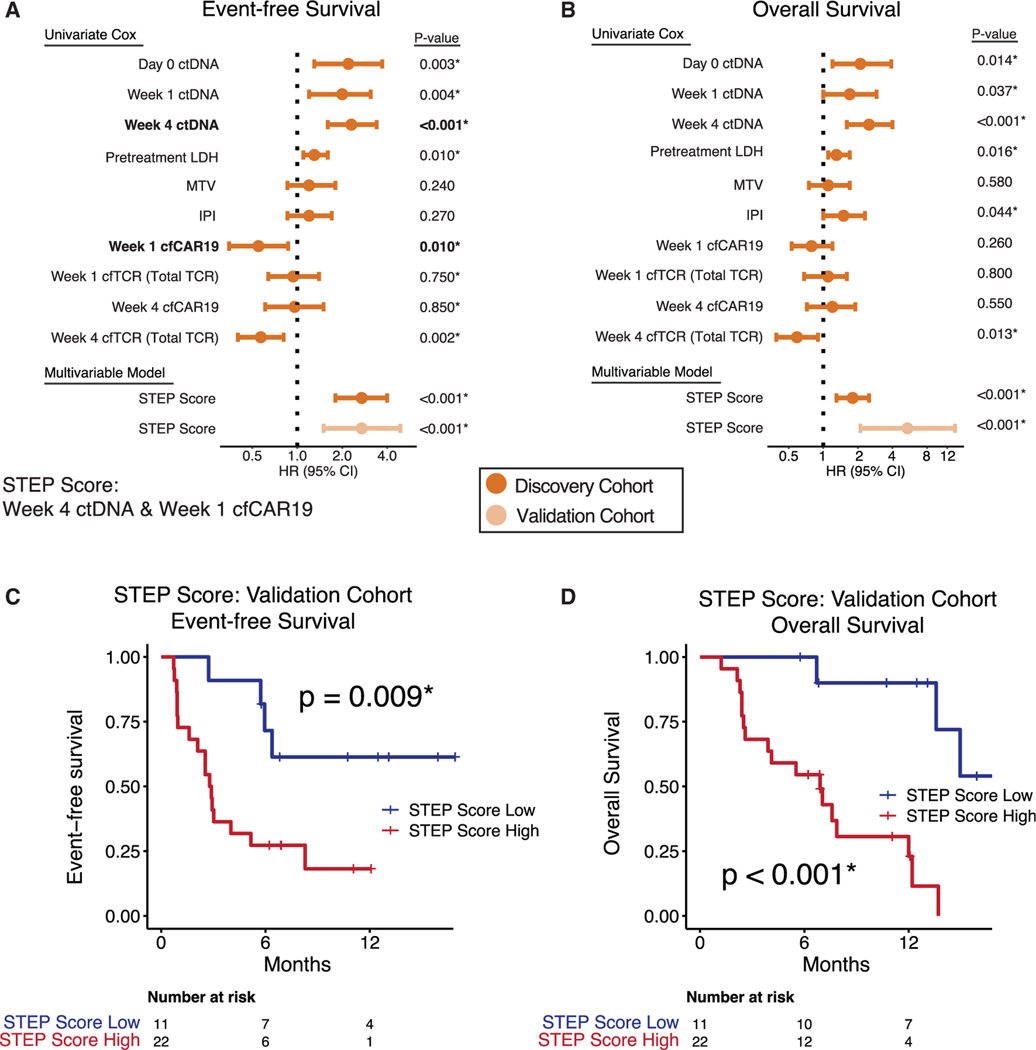
Most relapsed/refractory large B cell lymphoma (r/rLBCL) patients receiving anti-CD19 chimeric antigen receptor (CAR19) T cells relapse. To characterize determinants of resistance, we profiled over 700 longitudinal specimens from two independent cohorts (n = 65 and n = 73) of r/rLBCL patients treated with axicabtagene ciloleucel. A method for simultaneous profiling of circulating tumor DNA (ctDNA), cell-free CAR19 (cfCAR19) retroviral fragments, and cell-free T cell receptor rearrangements (cfTCR) enabled integration of tumor and both engineered and non-engineered T cell effector-mediated factors for assessing treatment failure and predicting outcomes. Alterations in multiple classes of genes are associated with resistance, including B cell identity (PAX5 and IRF8), immune checkpoints (CD274), and those affecting the microenvironment (TMEM30A). Somatic tumor alterations affect CAR19 therapy at multiple levels, including CAR19 T cell expansion, persistence, and tumor microenvironment. Further, CAR19 T cells play a reciprocal role in shaping tumor genotype and phenotype. We envision these findings will facilitate improved chimeric antigen receptor (CAR) T cells and personalized therapeutic approaches.

Keywords: MRD; cell-free DNA; chimeric antigen receptor T cells; circulating tumor DNA; ctDNA; genomics; immunotherapy; large B cell lymphoma; oncology; precision medicine.


Conflict of interest statement

Declaration of interests B.J.S. reports consultancy for Foresight Diagnostics. D.M.K. reports consultancy for Roche, Adaptive Biotechnologies, and Genentech and equity ownership interest in Foresight Diagnostics S.K.A. reports speaker honoraria from Takeda. M.J.F. reports consultancy and research funding from Adaptive Biotechnologies, research funding from Kite/Gilead, stock options from Allogene Therapeutics, and equity in Roche/Genentech. M.S.E. reports consultancy for Foresight Diagnostics. J.H.B. reports research funding from Kite Pharma. S.B. reports employment and stock ownership at Kite-a Gilead company. J.W. has research funding from Kite/Gilead, BMS, Novartis, Genentech/Roche, Morphosys/Incyte, AstraZeneca, and ADC Therapeutics, and consulting funding for Kite/Gilead, BMS, Novartis, Genentech/Roche, Morphosys/Incyte, AstraZeneca, ADC Therapeutics, Merck, MonteRosa, Umoja, and Ikusda. M.S.K. reports research funding from CRISPR Therapeutics and Nutcracker Therapeutics, and advisory committee membership for Myeloid Therapeutics and Daiichi Sankyo. Y.N. reports consulting for Leica Biosystems and Roche, and research funding from Kite Pharma. C.L.M. holds several patents focused on CAR T cells therapies; is a co-founder and holds equity in Lyell Immunopharma, CARGO Therapeutics, and Link Cell Therapies, which are developing CAR-based therapies; and consults for Lyell, CARGO, Link, Apricity, Nektar, Immatics, Mammoth, and Ensoma. R.G.M. is a co-founder of and holds equity in Link Cell Therapies and Syncopation Life Sciences. R.G.M. is a consultant for Lyell Immunopharma, NKarta, Arovella Pharmaceuticals, Innervate Radiopharmaceuticals, GammaDelta Therapeutics, Aptorum Group, Zai Labs, ImmunAI, Gadeta, FATE Therapeutics (DSMB), and Waypoint Bio. M.D. reports research funding from AstraZeneca, Genentech, Varian Medical Systems, and Illumina; ownership interest in CiberMed and Foresight Diagnostics; and consultancy from AstraZeneca, Boehringer Ingelheim, Bristol Myers Squibb, Genentech, Gritstone Oncology, Illumina, Novartis, and Roche. D.B.M. holds a patent with Pharmacyclics supporting ibrutinib for chronic graft-versus-host disease and receives consulting or research fees or serves as an advisor for Pharmacyclics, Kite Pharma, Adaptive Biotechnologies, Novartis, BMS, Janssen Pharmaceuticals, Roche, Genentech, Precision Bioscience, Allogene, Miltenyi Biotec, Fate Therapeutics, 2Seventy, and Adicet. A.A.A. reports consultancy for Celgene, Chugai, Genentech, Gilead, Janssen, Pharmacyclics, and Roche; scientific advisory board membership in the Lymphoma Research Foundation; professional affiliations with the American Society of Hematology, American Society of Clinical Oncology, American Society of Clinical Investigation, and Leukemia & Lymphoma Society; research funding from the National Cancer Institute, National Heart, Lung, and Blood Institute, National Institutes of Health, Celgene, Bristol Myers Squibb, and Pfizer; patent filings, including patent issued, licensed, and with royalties paid from FortySeven, a patent pending and Licensed to Foresight, a patent pending relating to MARIA, a patent issued and licensed to CiberMed, a patent issued, a patent pending to CiberMed, a patent issued to Idio-type Vaccines, and a patent issued, licensed, and with royalties paid From Roche; and equity ownership interests in CiberMed Inc., Foresight Diagnostics, FortySeven Inc., and CARGO Therapeutics. B.J.S., D.M.K., M.S.E., M.D., and A.A.A. also report patent filings related to cancer biomarkers. The remaining authors declare no competing interests.

Figures

Figure 1.
Figure 1.. Study overview
Schematic illustrating the integrative approach to characterize mechanisms of CAR19 resistance undertaken in this study. An r/rLBCL patient undergoing CAR19 therapy is depicted from prior to infusion to relapse. (Above timeline) Plasma samples for simultaneous profiling of ctDNA, cfCAR19, and cfTCR were obtained from pretreatment and multiple post-infusion time points, including relapse, when applicable. Analyses performed at each time point are indicated in colored boxes. Colors reflect the compartment being analyzed: tumor/ctDNA (purple), CAR19/cfCAR19 (blue), immune microenvironment/cfTCR (green). (Below timeline).
Figure 2.
Figure 2.. STEP platform and impact of ctDNA molecular thresholds on outcome
(A) Illustration summarizing the strategy through which ctDNA, cfCAR19, and cfTCR are simultaneously profiled from a plasma sample using the simultaneous tumor and effector profiling (STEP) platform. (B) Dynamic changes in ctDNA (top), cfCAR19 (middle), and cfTCR levels (bottom) following CAR19 infusion in patients who progress (red), and those who achieve an ongoing response (blue). Wilcoxon rank-sum test used to compare variables at each noted time point. (C and D) Kaplan-Meier estimates show EFS for patients stratified by pretreatment (day 0; C) or dynamic (week 4; D) ctDNA levels using optimized molecular thresholds in the discovery cohort. High ctDNA defined as ≥2.5 log10hGE/mL. MMR defined as ≥2.5 log decrease in ctDNA level relative to day 0. hGE, haploid genome equivalent; SABER, sequence affinity capture and analysis by enumeration of cell-free receptors; MMR, major molecular response, GE, genome equivalent. *p < 0.05. See also Figure S1.
Figure 3.
Figure 3.. Profiling of engineered and other effector T cells from cfDNA
(A) Correlation between CAR19 T cell levels as quantified by flow cytometry and STEP (cfCAR19) determined using Spearman’s rank-order method in samples from patients in the discovery cohort. Color depicts outcome and shading depicts time point of blood draw. Dashed line depicts linear regression line. (B) (Top) Aggregate fragment length profiles of wild-type cfDNA (black), ctDNA (purple), and cfCAR19 (blue) molecules across all evaluable plasma sam-ples. (Bottom) Enrichment of ctDNA (purple) and cfCAR19 (blue) relative to wild-type cfDNA across the fragment length spectrum. (C) Illustration demonstrating model in which increased fragmentation of tissue-derived DNA oc-curs in transit to the blood. (D) Histograms of mean cfCAR19 DNA fragment lengths for samples with low (dark blue) and high (light blue) CAR19 FACS over n = 1,000 random samplings of cfCAR19 DNA fragments. (E) Cumulative frequency of cfCAR19 fragments shorter than a given length in three temporal bins following CAR19 infusion: week 1, week 4, and > week 4. Bins compared using the Kolmogorov-Smirnov (K-S) test, and p values are indicated in the table. (F) Correlation between cfTCR levels measured by SABER and cfCAR19 levels 1 week after CAR19 infusion (dark green), and 4 weeks following CAR19 infusion (light green) using samples from patients in the discovery cohort. Correlation coefficients were compared using Fisher’s z-transformation. Prog., progressor; O. Resp., ongoing responder; ND, not detected; FACS, fluorescence-activated cell sorting. *p < 0.05. See also Figure S2.
Figure 4.
Figure 4.. Genomic determinants of resistance to CAR19 therapy
(A) (Left) Recurrently mutated genes in patients receiving CAR19 therapy, stratified by ongoing response versus progression among pooled patients from the discovery and validation cohorts. (Right) Effect of mutations in given gene on EFS (HR from proportional hazard model); significant values (p < 0.05) shown in red. The proportion of emergent mutations is depicted in light red. Genes that remained statistically significant after adjusting for multiple hypothesis testing (Benjamini-Hochberg method, q < 0.1) are annotated. Genes mutated in greater than 5% of patients pre-CAR19 are displayed. (B) Clonal selection of mutations in specific genes in patients experiencing disease progression shown as a volcano plot. Mutated genes under significant selection are shown on the right in purple; size of dot proportional to number of mutations (also shown in parentheses). (C and D) Clonal selection of somatic copy-number alterations (SCNAs)—amplifications (C) and deletions (D)—at the level individual genes, in patients experiencing progression shown as a volcano plot. Genes listed in groups that are included in single 500-kb regions. SCNAs under significant selection are shown in purple; size of dot proportional to number of SCNAs (also shown in parentheses). HRSNV, single-nucleotide variant; indel, small insertions/deletions. *p < 0.05. See also Figure S3.
Figure 5.
Figure 5.. Tumor-intrinsic factors influence outcomes and CAR19 interactions via diverse mechanisms
(A) Tumor and CAR19 T cells influence tumor biology, CAR19 expansion and persistence, and the tumor microenvironment via reciprocal interactions. Boxes highlight interactions discussed in this article with references to relevant figures. (B) Comparison of regulatory T cell levels in pre-CAR19 r/rLBCL tumors (n = 68) as measured using CIBERSORTx in IRF8 altered (light green) or wild-type (dark green) tumors. (C) Dynamic changes in ctDNA (top) and cfCAR19 (bottom) and an emergent CD19 nonsense mutation in an exemplar patient that relapses following CAR19 therapy. cfCAR19 re-expands along with the re-expansion of ctDNA levels and appearance of CD19 mutation. (D) Correlation between CD19 membrane expression levels quantified using immunohistochemistry (H score) at relapse (x axis) and relapse cfCAR19 levels (y axis). (E) Genome-wide heatmap reflecting the copy number profile of three exemplar patients prior to therapy (top), and at the time of relapse (bottom). Each column is representative of a cytoband. Amplifications in cytoband 9p24.1 at the time of relapse in all three patients are highlighted. TME, tumor microenvironment; AF, allele frequency. *p < 0.05. See also Figure S4.
Figure 6.
Figure 6.. Reciprocal interactions between tumor and CAR T cells influence CAR19 expansion and tumor microenvironment
(A) Overview of schema used to calculate the early CAR19 expansion index for each patient (see STAR Methods for detail). Patients greater than or equal to the median expansion rank were considered to have a high early CAR19 expansion index, and those below the median were considered to have a low early expansion index. Gray boxes indicate sample time points with no available data. (B) Enrichment of genomic alterations in individual genes in patients with high and low initial CAR expansion as determined using early CAR19 expansion index,depicted as a volcano plot. Genes significantly associated with expansion are colored blue (enriched in low expansion) or yellow (enriched in high expansion). (C) Comparison of early CAR19 expansion as quantified using the early CAR19 expansion index in TNFRSF14-mutated (light blue) versus wild-type (dark blue) patients. (D) Comparison of select immune cell subsets in pre-CAR19 r/rLBCL tumors (n = 68) as inferred using CIBERSORTx in TNFRSF14-mutated (light green) and wild-type (dark green) tumors. (E) Intratumoral CAR19 T cell levels in post-CAR19 relapse tumors were quantified using CAPP-seq. Gene expression and tumor immune microenvironment composition were compared between tumors with high versus low relapse CAR19 levels. (F) Correlation between intratumoral CAR19 levels (CAR19 depth/total sequencing depth, x axis) versus matched plasma cfCAR19 levels (CAR19 depth/total sequencing depth, y axis) in six cases with both available matched plasma and tumor samples at the time of relapse. (G) Comparison of regulatory T cell levels as measured using CIBERSORTx in post-CAR19 relapse tumors (n = 14) with high versus low intratumoral axi-cel levels(stratified to cohort-wise median). (H–J) Gene set enrichment analysis (GSEA) enrichment plots demonstrating enrichment of (H) inflammatory, (I) interferon gamma, and (J) TGF-β gene sets in post-CAR19 relapsed tumors (n = 14) with high versus low axi-cel content (stratified to cohort-wise median). GSEA*p < 0.05. See also Figures S5 and S6.
Figure 7.
Figure 7.. A multivariable model incorporating integrating tumor B cell and effector T cell molecular features predicts outcomes following CAR19 therapy
(A and B) Results of univariate Cox proportional hazards for EFS (A) and OS (B) and indicated variables in the discovery cohort. Using multivariable stepwise forward selection with Bayesian information criterion (BIC), two variables were selected (week 4 ctDNA and week 1 cfCAR19, emphasized in bold) as the optimal covariates to predict EFS in the discovery cohort. A multivariable Cox model (STEP score) was trained using these variables on EFS in the discovery cohort and applied to the independent validation cohort. (C and D) Kaplan-Meier estimates show EFS (C) and OS (D) for patients in the validation cohort stratified by high versus low STEP score. EFS, event-free survival; OS, overall survival; ND, not detected; hGE, haploid genome equivalent; Pre-LD, pre-lymphodepletion; IPI, internal prognostic index; TMTV, total metabolic tumor volume.*p < 0.05. See also Figure S7.

Comment in

References

    1. Neelapu SS, Locke FL, Bartlett NL, Lekakis LJ, Miklos DB, Jacobson CA, Braunschweig I, Oluwole OO, Siddiqi T, Lin Y, et al. (2017). Axicabtagene ciloleucel CAR T-cell therapy in refractory large B-cell lymphoma. N. Engl. J. Med 377, 2531–2544. 10.1056/NEJMoa1707447. - DOI - PMC - PubMed
    1. Maude SL, Laetsch TW, Buechner J, Rives S, Boyer M, Bittencourt H, Bader P, Verneris MR, Stefanski HE, Myers GD, et al. (2018). Tisagenlecleucel in children and young adults with B-cell lymphoblastic leukemia. N. Engl. J. Med 378, 439–448. 10.1056/NEJMoa1709866. - DOI - PMC - PubMed
    1. Wang M, Munoz J, Goy A, Locke FL, Jacobson CA, Hill BT, Timmerman JM, Holmes H, Jaglowski S, Flinn IW, et al. (2020). KTE-X19 CAR T-cell therapy in relapsed or refractory mantle-cell lymphoma. N. Engl. J. Med 382, 1331–1342. 10.1056/NEJMoa1914347. - DOI - PMC - PubMed
    1. Munshi NC, Anderson LD Jr., Shah N, Madduri D, Berdeja J, Lonial S, Raje N, Lin Y, Siegel D, Oriol A, et al. (2021). Idecabtagene vicleucel in relapsed and refractory multiple myeloma. N. Engl. J. Med 384, 705–716. 10.1056/NEJMoa2024850. - DOI - PubMed
    1. Schuster SJ, Bishop MR, Tam CS, Waller EK, Borchmann P, McGuirk JP, Jager U, Jaglowski S, Andreadis C, Westin JR,€ et al. (2019). Tisagenlecleucel in adult relapsed or refractory diffuse large B-cell lymphoma. N. Engl. J. Med 380, 45–56. 10.1056/NEJMoa1804980. - DOI - PubMed

Publication types

MeSH terms