. 2023 Jan 9;41(1):196-209.e5.
doi: 10.1016/j.ccell.2022.12.003. Epub 2022 Dec 29.

Genetic and pharmacological modulation of DNA mismatch repair heterogeneous tumors promotes immune surveillance

Affiliations

Genetic and pharmacological modulation of DNA mismatch repair heterogeneous tumors promotes immune surveillance

Vito Amodio et al. Cancer Cell. .

Abstract

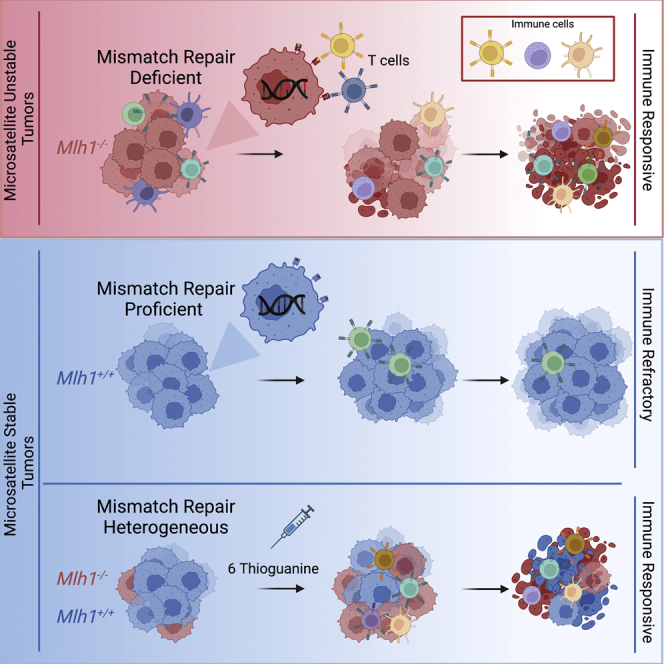
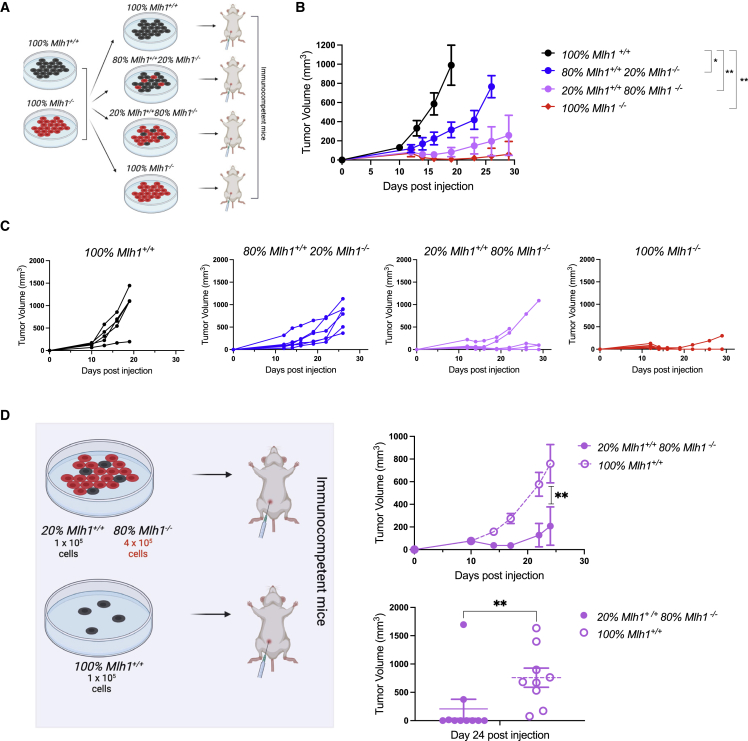
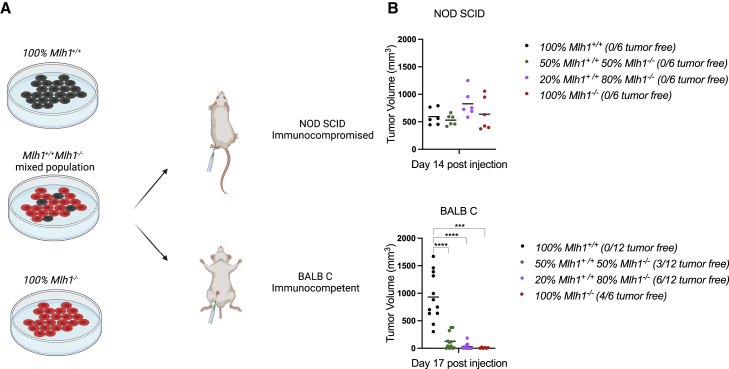
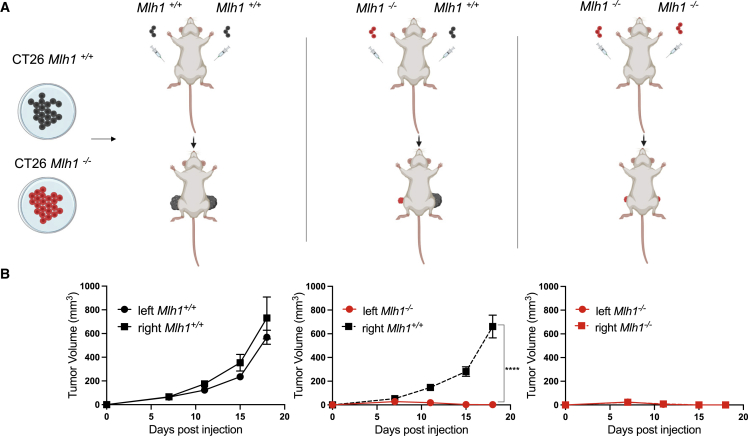
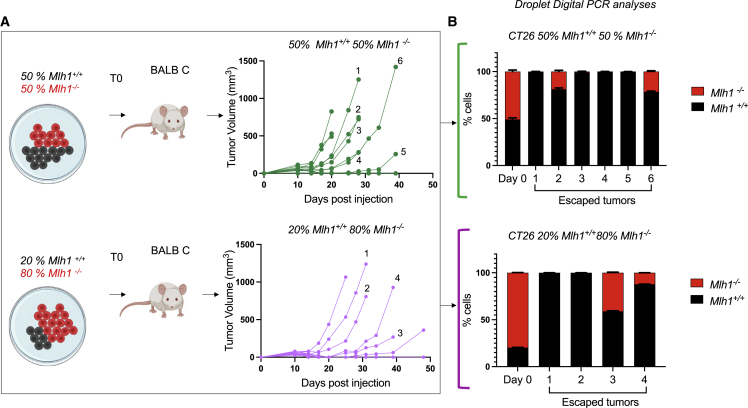
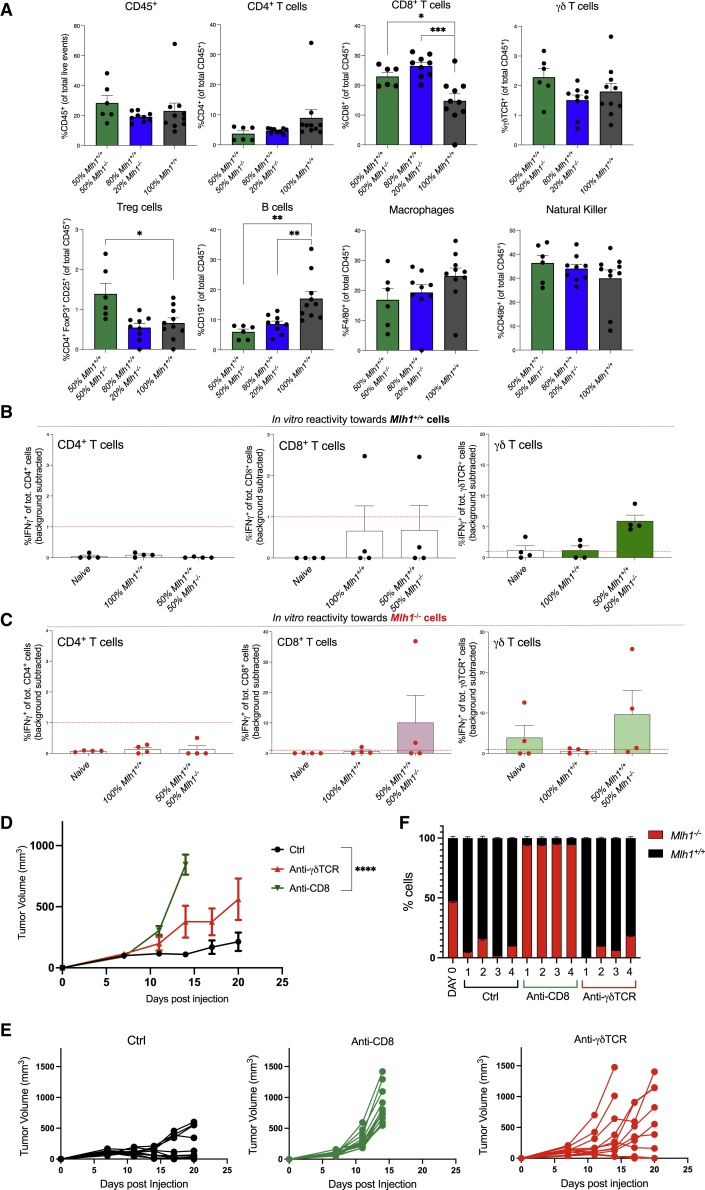
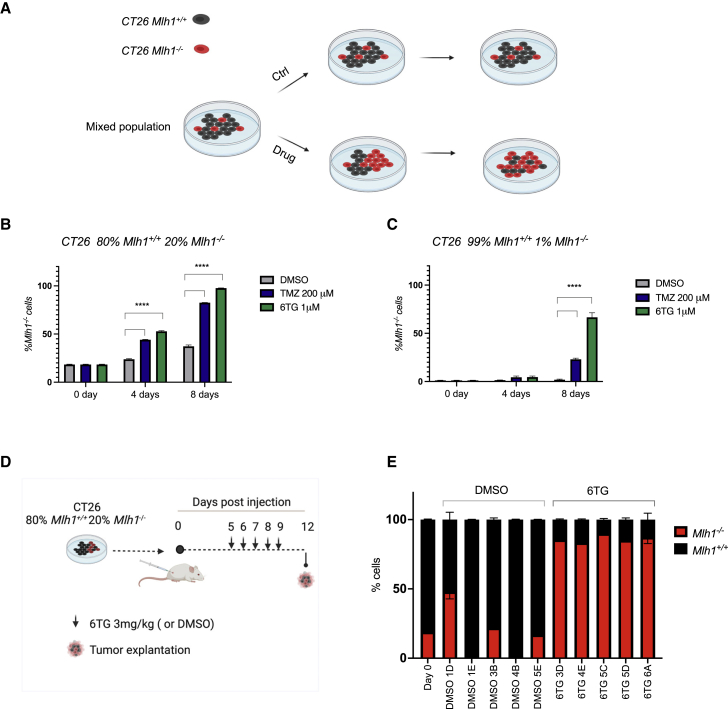
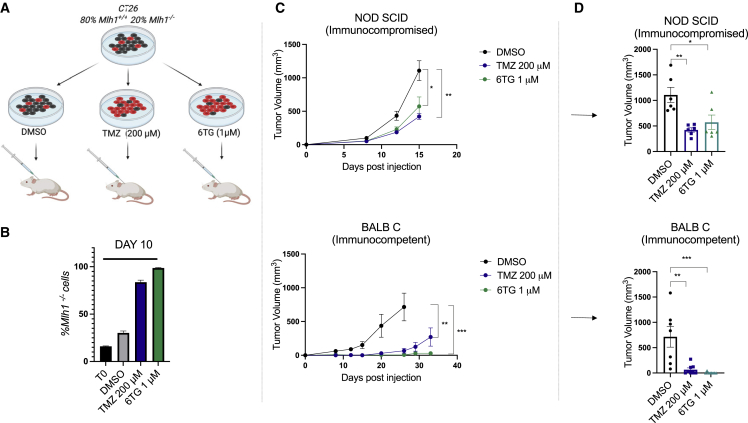
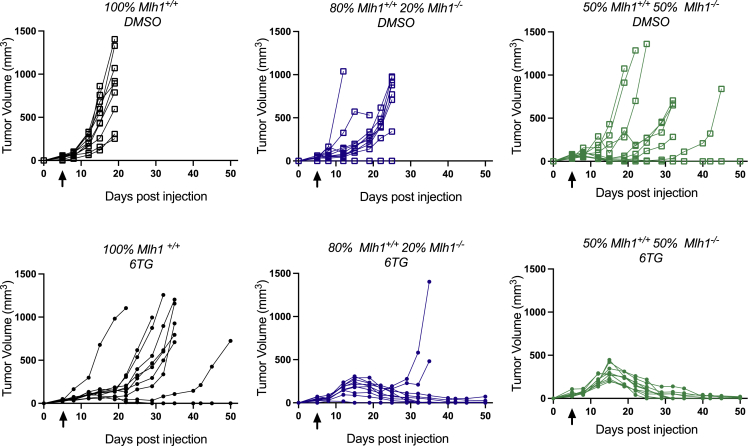
Patients affected by colorectal cancer (CRC) with DNA mismatch repair deficiency (MMRd), often respond to immune checkpoint blockade therapies, while those with mismatch repair-proficient (MMRp) tumors generally do not. Interestingly, a subset of MMRp CRCs contains variable fractions of MMRd cells, but it is unknown how their presence impacts immune surveillance. We asked whether modulation of the MMRd fraction in MMR heterogeneous tumors acts as an endogenous cancer vaccine by promoting immune surveillance. To test this hypothesis, we use isogenic MMRp (Mlh1+/+) and MMRd (Mlh1-/-) mouse CRC cells. MMRp/MMRd cells mixed at different ratios are injected in immunocompetent mice and tumor rejection is observed when at least 50% of cells are MMRd. To enrich the MMRd fraction, MMRp/MMRd tumors are treated with 6-thioguanine, which leads to tumor rejection. These results suggest that genetic and pharmacological modulation of the DNA mismatch repair machinery potentiate the immunogenicity of MMR heterogeneous tumors.

Keywords: 6-thioguanine; heterogeneity; immune checkpoint blockade; immune evasion; immune surveillance; microsatellite unstable tumors (MSI); mismatch repair; temozolomide.


Conflict of interest statement

Declaration of interests A.Bardelli served in a consulting/advisory role for Illumina, Inivata and Guardant Health. The transfer of certain materials to third parties is subject to terms contained within license and intellectual property agreements held between NeoPhore, the University of Turin, A.Bardelli and G.G. A.Bardelli and G.G. are cofounders and shareholders of NeoPhore limited. S.A. is a cofounder and shareholder of CheckMab SRL. A.Bardelli is a member of the scientific advisory board of Neophore, Inivata, and Roche Genentech CRC Advisory Board. A. Bardelli reports grants/research support from Neophore, AstraZeneca, and Inivata. C.M. reports personal consultancy fees from Bayer, Roche and Daichii Sankyo-AstraZeneca outside the scope of the present work. G.M. received honoraria from COR2ED outside the scope of the present work. The remaining authors declares no conflict of interest.

Figures

None
Graphical abstract
Figure 1
Figure 1
MMR heterogeneity affects tumor growth (A) Heterogeneous cell populations (100% Mlh1+/+, 80% Mlh1+/+ 20% Mlh1−/−, 20% Mlh1+/+ 80% Mlh1−/−, and 100% Mlh1−/−) were subcutaneously injected in immunocompetent BALB C mice (5 × 105 cells per mouse). (B) Tumor growth was monitored twice a week and is reported in the graph as average of tumor volumes (mm3) ± standard error of the mean. (C) Tumor volumes (mm3) of single mice are listed. Each experimental group was composed at least of five animals. (D) CT26 20%Mlh1+/+ 80%Mlh1−/− (1 × 105Mlh1+/++ 4 × 105Mlh1−/− cells) mixed population and the relative control (1 × 105Mlh1+/+cells alone) were injected in immunocompetent syngeneic mice. Ten mice were included in each group. Tumor growth was monitored twice a week. The average tumor volume (mm3) ± standard error of the mean and single tumor volumes at day 24 are reported. These experiments were performed once. Mann-Whitney statistical analyses was performed: p < 0.05; ∗∗p < 0.01. See also Figure S1A.
Figure 2
Figure 2
MMR heterogeneity impairs tumorigenesis exclusively in immunocompetent animals (A) Mlh1+/+/Mlh1−/− mixed populations (100%/0%, 50%/50%, 20%/80%, and 0%/100%) were injected simultaneously in immunocompetent (BALB C) and immunocompromised (NOD SCID) mice (5 × 105 cells per mouse). (B) Tumor volumes (mm3) of single mice are represented. NOD SCID tumor volumes are indicated at day of sacrifice (day 14). BALB C tumor volumes are depicted at day in which 100% Mlh1+/+ were sacrificed (day 17). The black dash represents the mean of each group. Tumor growth was followed until ethical endpoints. The number of tumor free mice at the end of the experiment/total number of mice is reported for each group. This experiment was performed once. Statistical significance was evaluated by Mann-Whitney test: ∗∗∗p = 0.0001; ∗∗∗∗p < 0.0001. See also Figure S2.
Figure 3
Figure 3
Injection of MMRp and MMRd tumors in contralateral flanks of individual mice (A) Graphical summary: 100% Mlh1+/+ and 100% Mlh1−/− CT26 cells were simultaneously injected in the two flanks of the same animal (BALB C). Different combinations were studied (left Mlh1+/+right Mlh1+/+; left Mlh1−/−right Mlh1−/−; left Mlh1−/− right Mlh1+/+). A total of 2.5 × 105 cells were injected in each flank to parallel the number of cells per mice used in the other experiments. (B) Tumor growth was monitored twice a week and is reported in the graph as average of tumor volumes (mm3) ± SEM. Each experimental group was composed of 12 animals, with the exception of left Mlh1−/− right Mlh1−/− group (n = 11). This experiment was performed once. Statistical significance was evaluated by Mann-Whitney test: ∗∗∗∗p < 0.0001.
Figure 4
Figure 4
The MMRp component drives immune evasion of MMR heterogeneous tumors Tumor escaped from immune control of BALB C during the experiment reported in Figures 2 and S2 are depicted as single mouse tumor growth and analyzed at molecular level. (A) 50% Mlh1+/+ 50% Mlh1−/− and 20% Mlh1+/+ 80% Mlh1−/− CT26 cell populations were subcutaneously injected in immunocompetent BALB C mice (see Figures 2 and S2) and the growth is reported in the graph as single tumor volumes (mm3). Tumors were allowed to expand until ethical endpoint, then they were explanted. (B) DNA was extracted from the heterogeneous cell populations before the injection (day 0) and then from the whole tumor mass grown in randomly selected animals (n = 6 for 50% Mlh1+/+ 50% Mlh1−/− group; n = 4 for 20% Mlh1+/+ 80% Mlh1−/− group). Two or three samplings for each tumor were analyzed by ddPCR to determine the Mlh1−/− and Mlh1+/+ cell fractions. Data are represented as average % of cells ± standard deviation for each tumor. The experiment was performed once. See also Figure S1B.
Figure 5
Figure 5
Immune profiling of MMR heterogeneous tumors reveals the involvement of CD8+ and γδ T cells (A) MMR heterogeneous tumors (100% Mlh1+/+, 80% Mlh1+/+ 20% Mlh1−/−, 50% Mlh1+/+ 50% Mlh1−/−) were analyzed 13 days after injection in immunocompetent BALB C mice. Immune cell infiltrate was evaluated by flow cytometry. Percentages of CD8+ T, CD4+ T, γδ T (γδ-TCR+), T reg (CD4+ FoxP3+ CD25+), B (CD19+), natural killer cells (CD49b+), and macrophages (F4/80+), were calculated normalizing the absolute number of each population with the viable CD45+ fraction. The total amount of CD45+ alive cells is reported. Data are represented as average % ± standard error of the mean. The experiment was performed once. Tumors with insufficient material for immunophenotypical characterization were excluded from the analyses; n = 10 for 100% Mlh1+/+ group, n = 9 for 80% Mlh1+/+ 20% Mlh1−/− group, n = 6 for 50% Mlh1+/+ 50% Mlh1−/−group. Statistical significance for each mixed population compared to the 100% Mlh1+/+ control group was calculated by one-way ANOVA: p < 0.05 ∗∗p < 0.005 ∗∗∗p < 0.0005; (B) Ex vivo reactivity assays; CT26 100% Mlh1+/+ and 50% Mlh1+/+ 50% Mlh1−/− were injected in immunocompetent BALB C mice. On day 13, mice were sacrificed and blood was taken. PBMCs were isolated and cocultured with Mlh1+/+or Mlh1−/− separately (ratio PBMCs to tumor cells of 1:1). PBMCs harvested from naive mice were used as controls. IFN-γ expression was analyzed by flow cytometry as marker of activation after 5 h of coculture. The analyses of IFN-γ+ CD8+ T, IFN-γ+ CD4+ T, IFN-γ+ γδ T cells obtained from the coculture with Mlh1+/+ cells or (C) Mlh1−/− cells is reported. At least three biological replicates were performed for each of the immune cell populations. Each dot represents a single biological replicate. Only conditions in which at least two biological replicates were above the threshold of 1% of IFNγ+ cells (after background subtraction) were considered specifically activated. Mean ± standard error of the mean is reported (D) CT26 50% Mlh1−/− 50% Mlh1+/+ cells were injected in immunocompetent BALB C mice treated with depleting antibody for CD8+ T cells or γδ T cells. Twelve mice per group were used. Untreated mice served as control. Depleting CD8+ T cell antibody was given according to the following schedule: 400 μg at the day of the injection, 200 μg at the day 2, and then every 3 days after injection. Depleting γδ T cell antibody was administered according to the following schedule: 400 μg 2 days and 1 day before the injection, 400 μg at days 3 and 6 after injection followed by 400 μg every 7 days. Tumors were measured twice a week and volumes are reported as average tumor volume (mm3) ± standard error of the mean; Mann-Whitney statistical analyses was performed, ∗∗∗∗p < 0.0001. (E) Single mice graphs of the experiment shown in Figure 5D are reported. (F) gDNA was extracted from four immune escaped tumors per arm (randomly selected), and ddPCR analyses was performed to determine the Mlh1+/+Mlh1−/− cell content. Two or three sampling for each tumor were analyzed. Day 0 indicates the day of tumor cell injection. Data are represented as average % of cells ± standard deviation for each tumor. The experiment was performed once. See also Figure S3.
Figure 6
Figure 6
In vitro pharmacological treatments of MMR heterogeneous populations (A) Mlh1−/− and Mlh1+/+ mixed population were plated (1 × 105 per well). After 24 h, cells were treated with TMZ 200 μM, 6TG 1 μM, or DMSO. gDNA was extracted after 4 and 8 days and ddPCR analyses were performed. (B) The 80% Mlh1+/+ 20% Mlh1−/− and (C) 99% Mlh1+/+ 1% Mlh1−/− populations were tested. Data are presented as average % of Mlh1−/− cells ± standard deviation. Experiment was performed three times, and each condition represents the average of a technical triplicate. This figure reports one representative experiment. Two-way ANOVA (multiple comparisons) was used for statistical analyses: ∗∗∗∗p < 0.0001. (D) CT26 Mlh1+/+/Mlh1−/− mixed population (80%/20%) was injected subcutaneously in immunocompetent BALB C mice. On day 5 after injection, intraperitoneal treatment with 6TG 3 mg/kg was initiated and repeated daily until day 9. On day 12 after injection, mice were sacrificed, tumors were harvested and gDNA was extracted. (E) ddPCR to determine Mlh1+/+/Mlh1−/− cell percentage was performed. Results are reported in the bar graph. Two or three sampling for each tumor were analyzed. Day 0 represents the percentage of Mlh1+/+and Mlh1−/− cells in the population at day of the injection. Data are represented as average % of cells ± standard deviation for each tumor. The experiment was performed once, n = 5 per group. See also Figure S4.
Figure 7
Figure 7
Pharmacological selection of MMRd cells increases immune surveillance in vivo (A) Experimental scheme: CT26 (80% Mlh1+/+ 20% Mlh1−/−) cells were plated in 10-cm dishes (1 × 105 cells, T0). After 24 h, drug selection (TMZ 200 μM, 6TG 1 μM, or DMSO) was administered for 10 days. (B) Percentage of Mlh1−/− cells after 10 days of drug treatment in vitro. To define the percentage of knock out cells, gDNA was extracted and analyzed for Mlh1−/− content by ddPCR. Two sampling for each condition were tested. Data are represented as average % of Mlh1−/− cells ± standard deviation. (C) Mixed populations obtained from (A) were injected in NOD SCID (immunocompromised) and BALB C (immunocompetent) mice (5 × 105 cells per mouse). Tumor growth was monitored and is reported in the graph as average of tumor volumes (mm3) ± standard error of the mean. (D) Tumor volumes (mm3) of single mice on day 15 (NOD SCID, day of sacrifice) and 26 (BALB C, day of sacrifice of DMSO arm) are reported. Data are represented as average tumor volumes (mm3) ± standard error of the mean, while each dot represents one single mouse value. The number of tumor free BALB C mice on day 26 were none of eight for the DMSO group, four of eight for the TMZ group, and seven of eight for the 6TG group. NOD SCID experimental groups n = 6; BALB C experimental groups n = 8. The experiment was performed once. Statistical significance was evaluated by Mann-Whitney test: p < 0.05, ∗∗p < 0.005, ∗∗∗p < 0.0005.
Figure 8
Figure 8
In vivo treatment with 6TG induces regression of MMR heterogeneous tumors CT26 MMR heterogeneous populations (100% Mlh1+/+, 80% Mlh1+/+20% Mlh1−/−, 50% Mlh1+/+ 50% Mlh1−/−) were injected in immunocompetent BALB C mice (5 × 105 cells per mouse). Five days after injection, mice were treated with 6TG 3 mg/kg for 5 days. The arrows indicate the start of 6TG treatment. DMSO treated mice served as controls. Single tumor volumes (mm3) until day 50 (the day of sacrifice of the last growing tumor) are reported. Tumor-free mice and mice with small stabilized tumors were followed for at least 120 days after injection. Each experimental group was composed of 10 animals. The experiment was performed once. See also Figure S5.

Comment in

Similar articles

Cited by

References

    1. Germano G., Amirouchene-Angelozzi N., Rospo G., Bardelli A. The clinical impact of the genomic landscape of mismatch repair-deficient cancers. Cancer Discov. 2018;8:1518–1528. doi: 10.1158/2159-8290.CD-18-0150. - DOI - PubMed
    1. Jiricny J. The multifaceted mismatch-repair system. Nat. Rev. Mol. Cell Biol. 2006;7:335–346. doi: 10.1038/nrm1907. - DOI - PubMed
    1. Turajlic S., Litchfield K., Xu H., Rosenthal R., McGranahan N., Reading J.L., Wong Y.N.S., Rowan A., Kanu N., Al Bakir M., et al. Insertion-and-deletion-derived tumour-specific neoantigens and the immunogenic phenotype: a pan-cancer analysis. Lancet Oncol. 2017;18:1009–1021. doi: 10.1016/S1470-2045(17)30516-8. - DOI - PubMed
    1. Saridaki Z., Souglakos J., Georgoulias V. Prognostic and predictive significance of MSI in stages II/III colon cancer. World J. Gastroenterol. 2014;20:6809–6814. doi: 10.3748/wjg.v20.i22.6809. - DOI - PMC - PubMed
    1. Amodio V., Mauri G., Reilly N.M., Sartore-Bianchi A., Siena S., Bardelli A., Germano G. Mechanisms of immune escape and resistance to checkpoint inhibitor therapies in mismatch repair deficient metastatic colorectal cancers. Cancers. 2021;13:2638. doi: 10.3390/cancers13112638. - DOI - PMC - PubMed

Publication types

Supplementary concepts