. 2023 Feb 7;35(2):316-331.e6.
doi: 10.1016/j.cmet.2022.12.005. Epub 2022 Dec 29.

Metabolic adaptation supports enhanced macrophage efferocytosis in limited-oxygen environments

Affiliations

Metabolic adaptation supports enhanced macrophage efferocytosis in limited-oxygen environments

Ya-Ting Wang et al. Cell Metab. .

Abstract

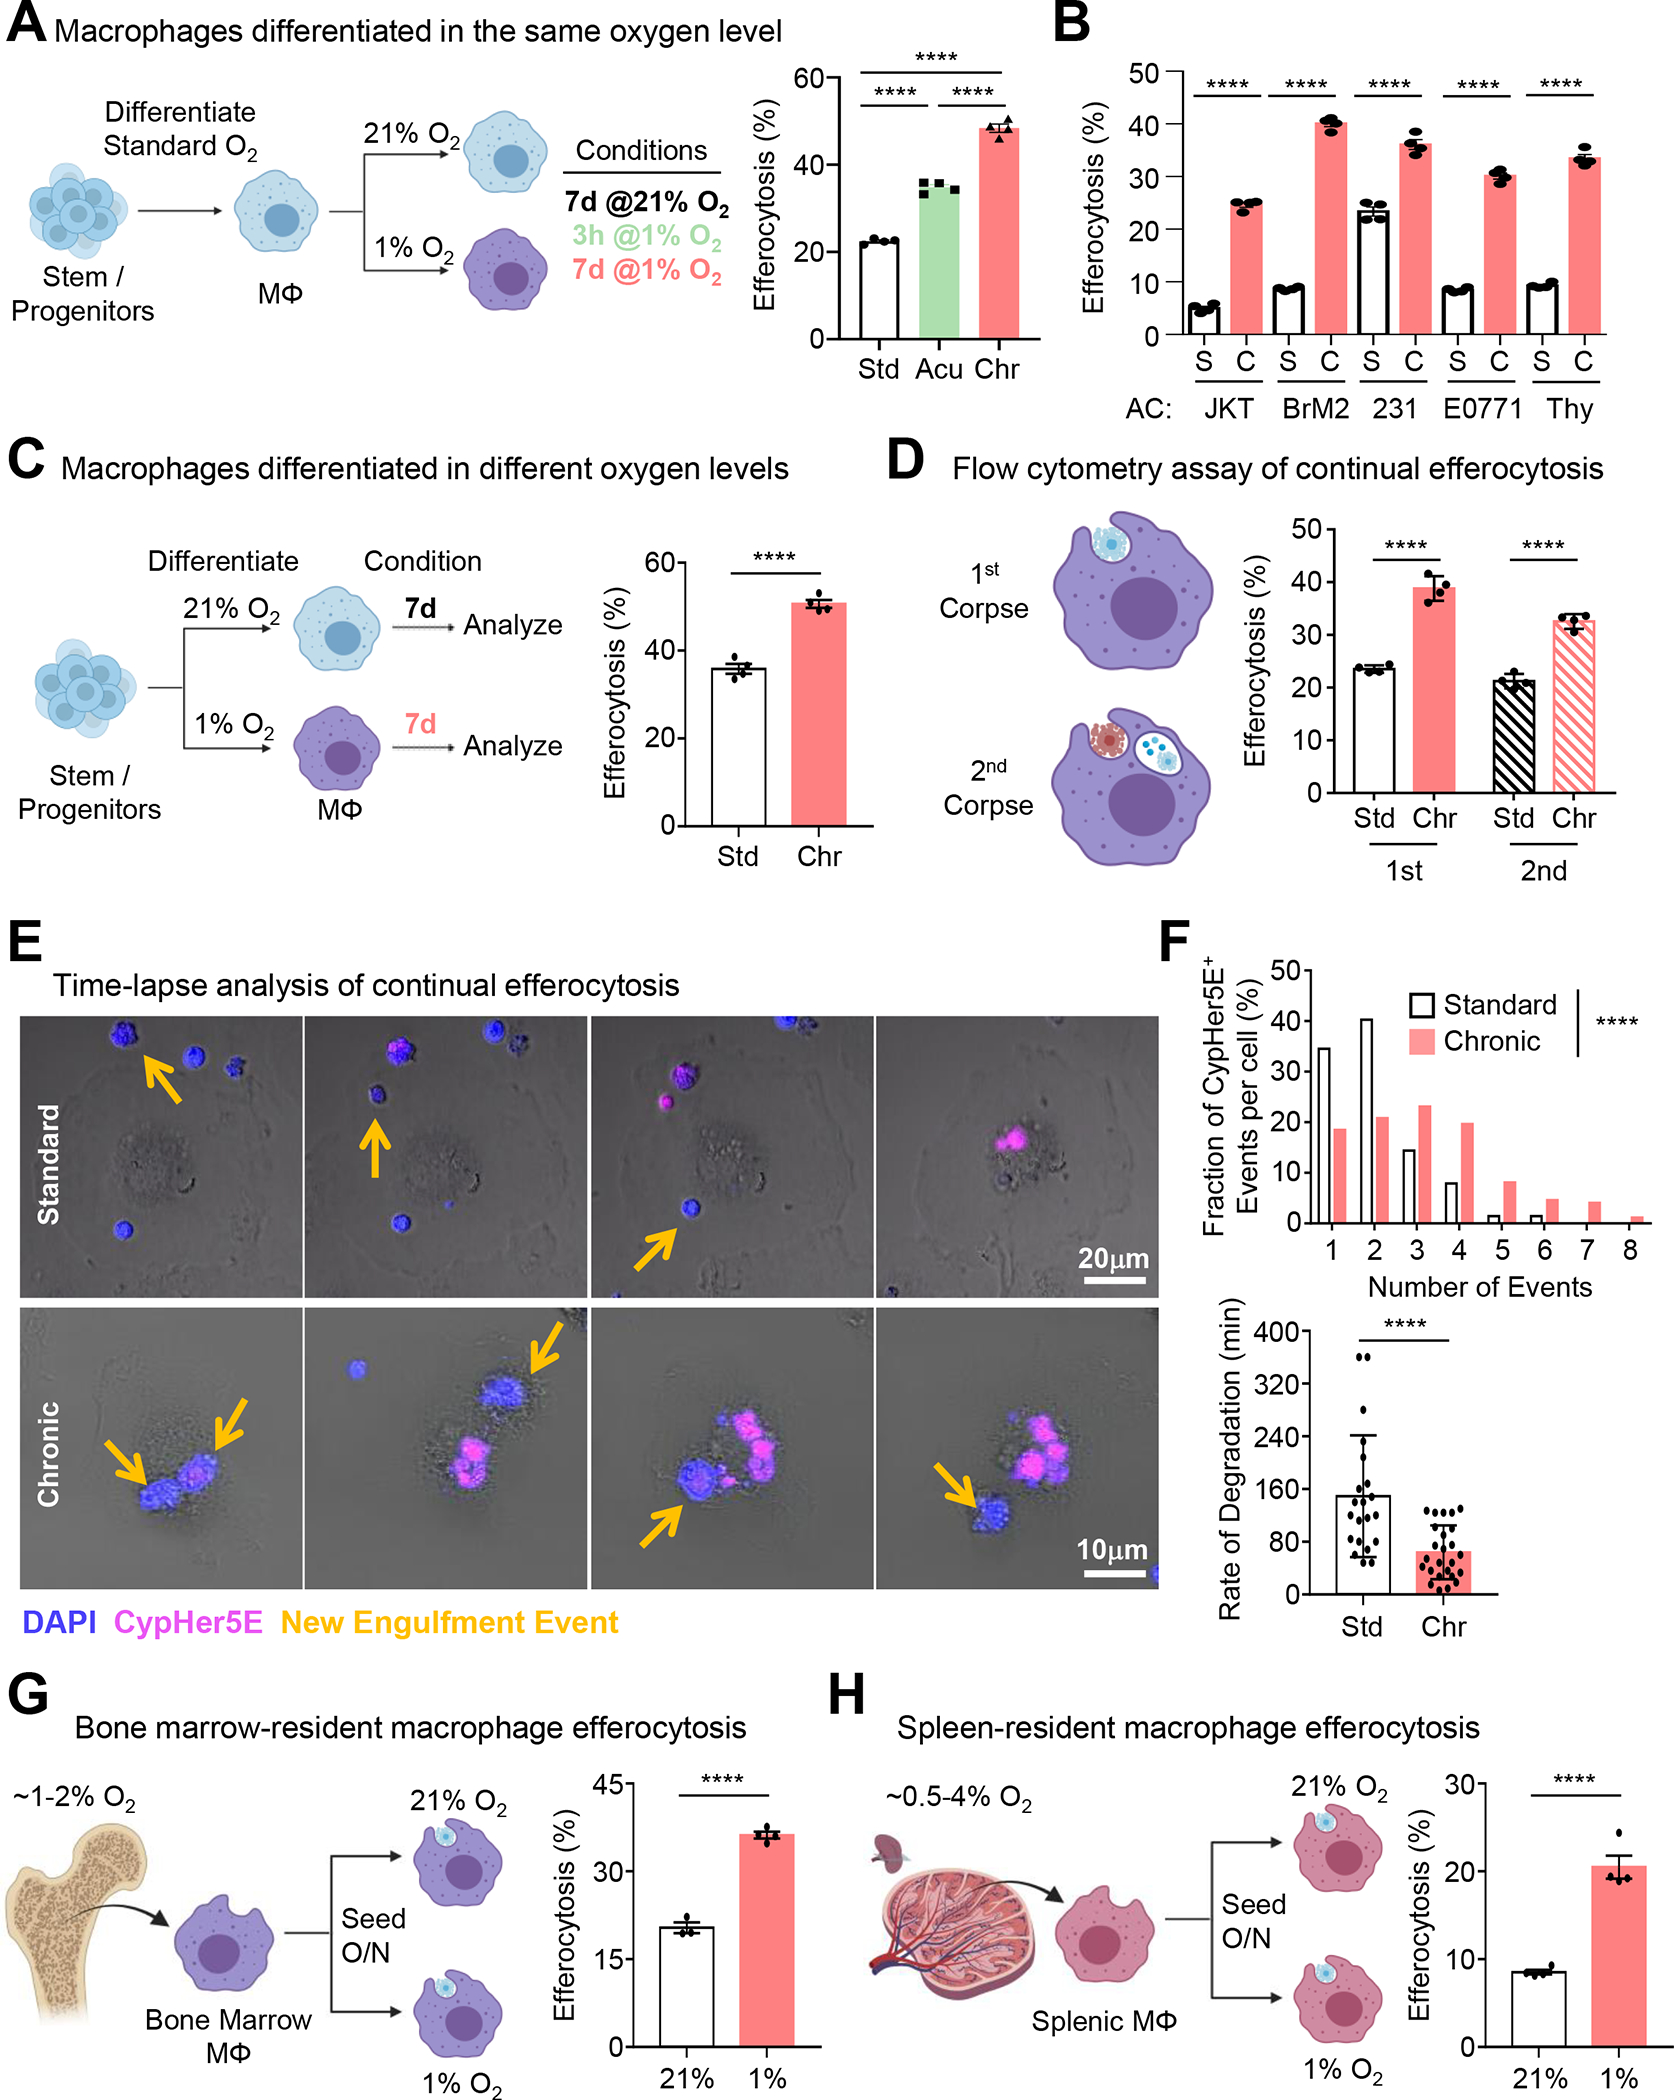
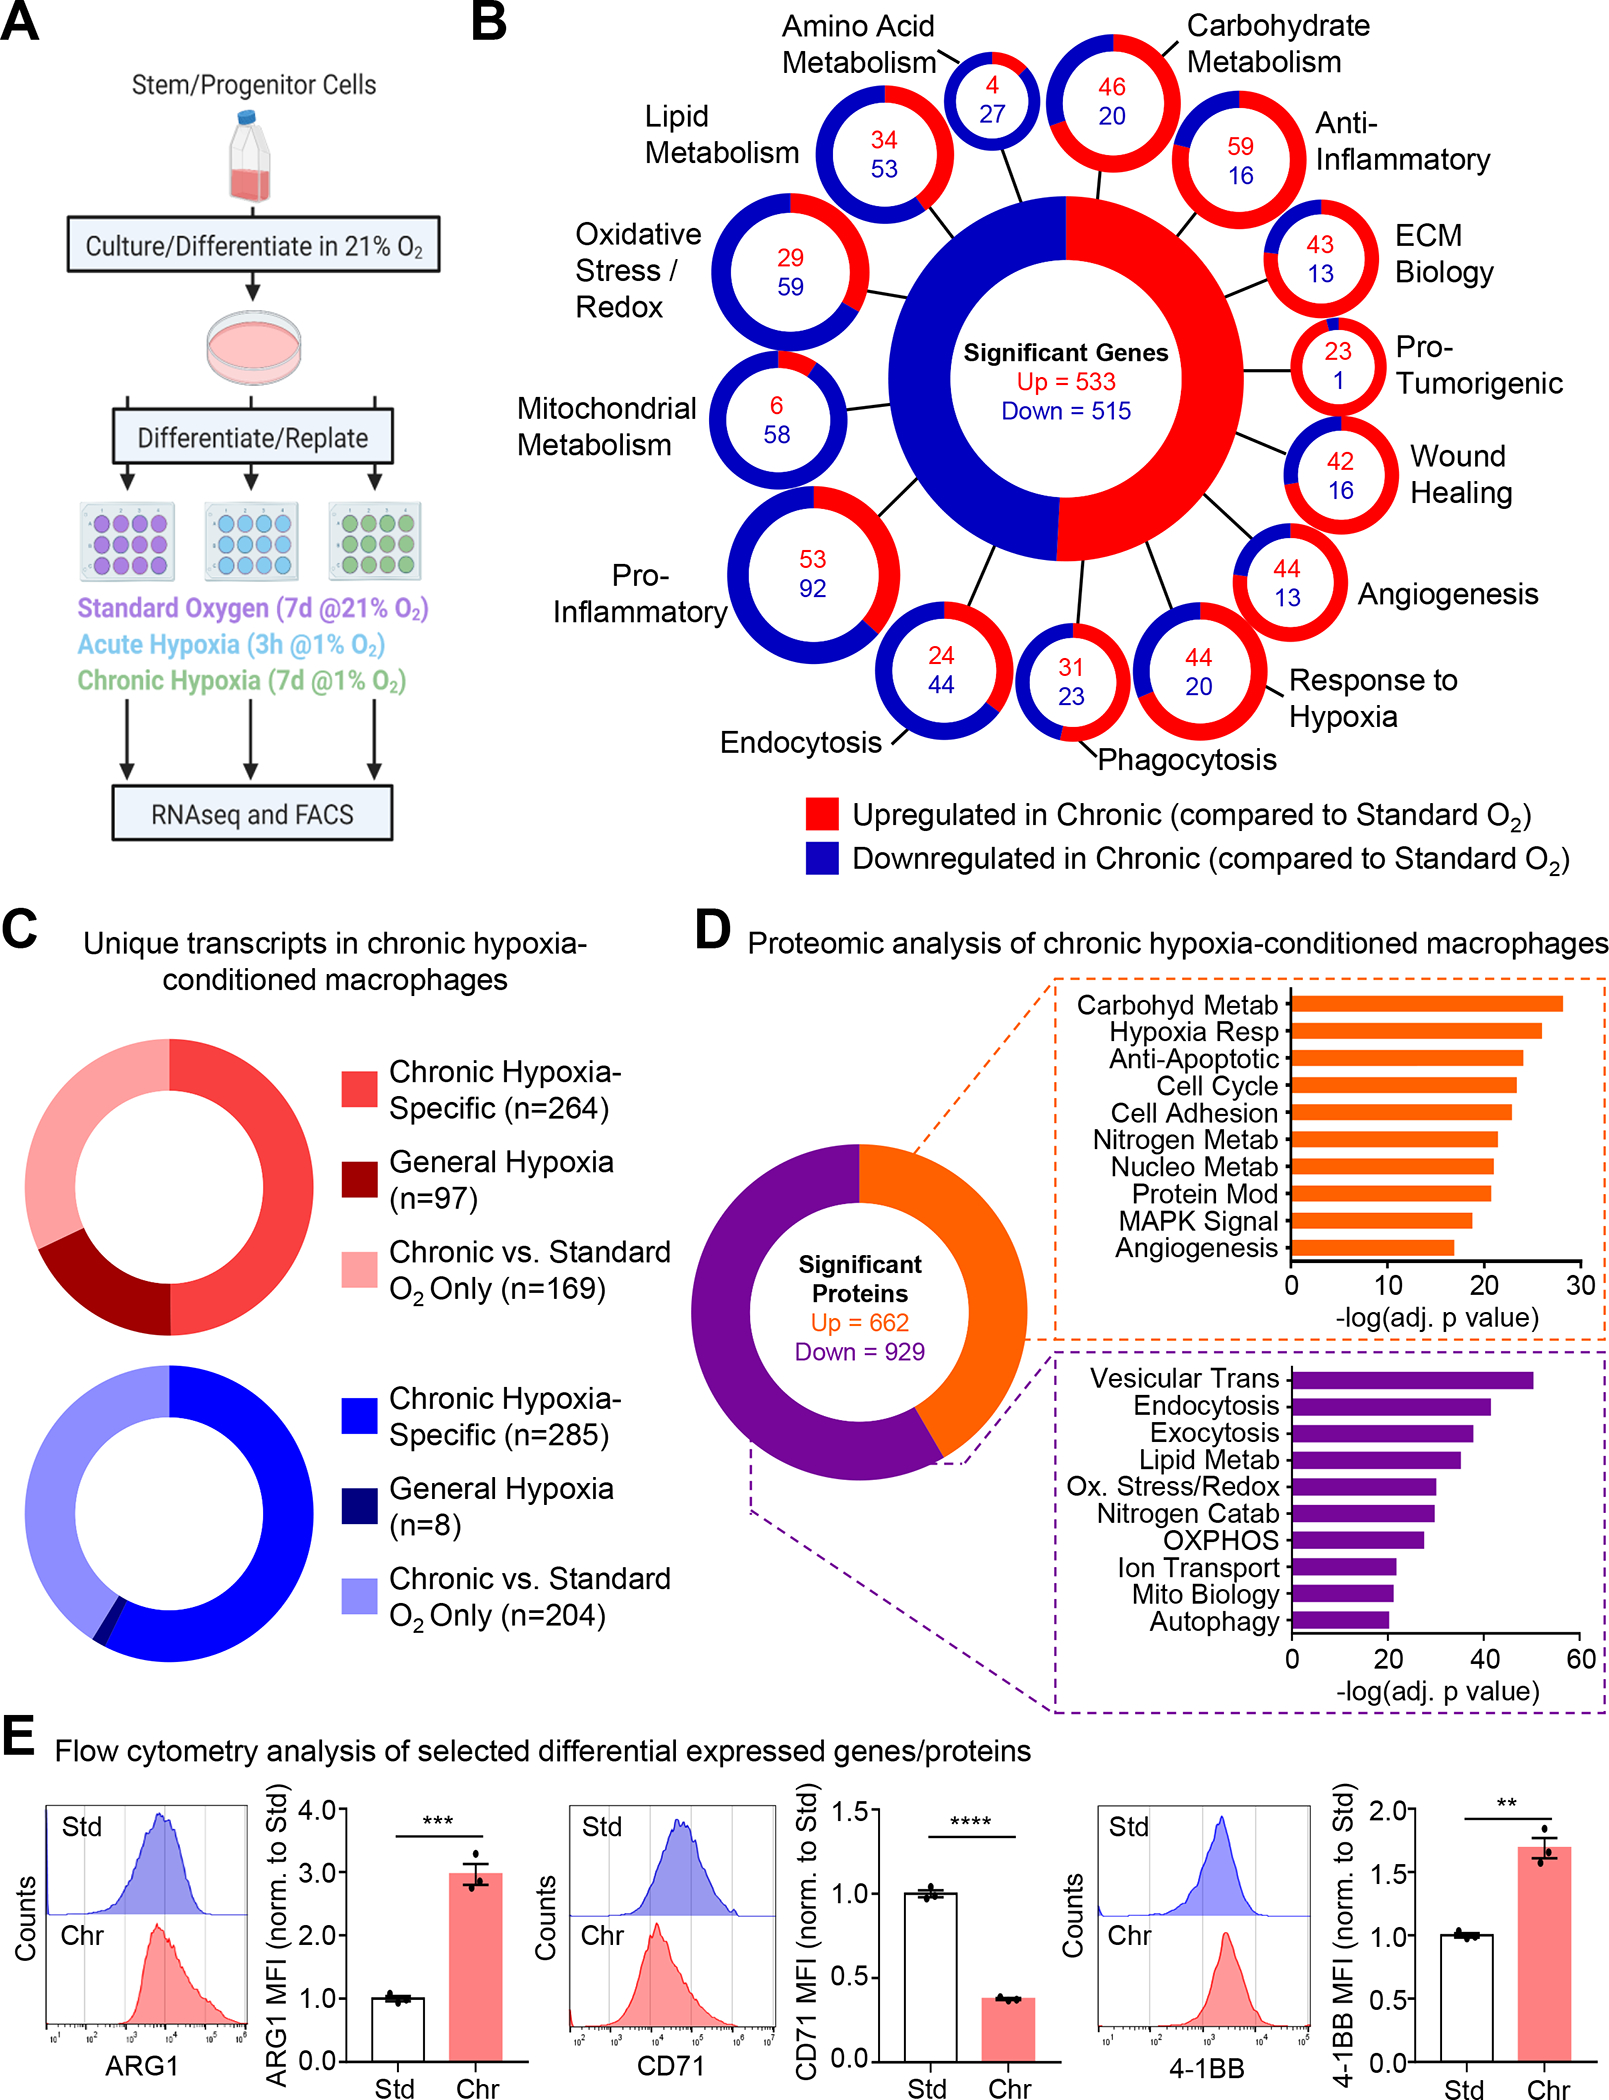
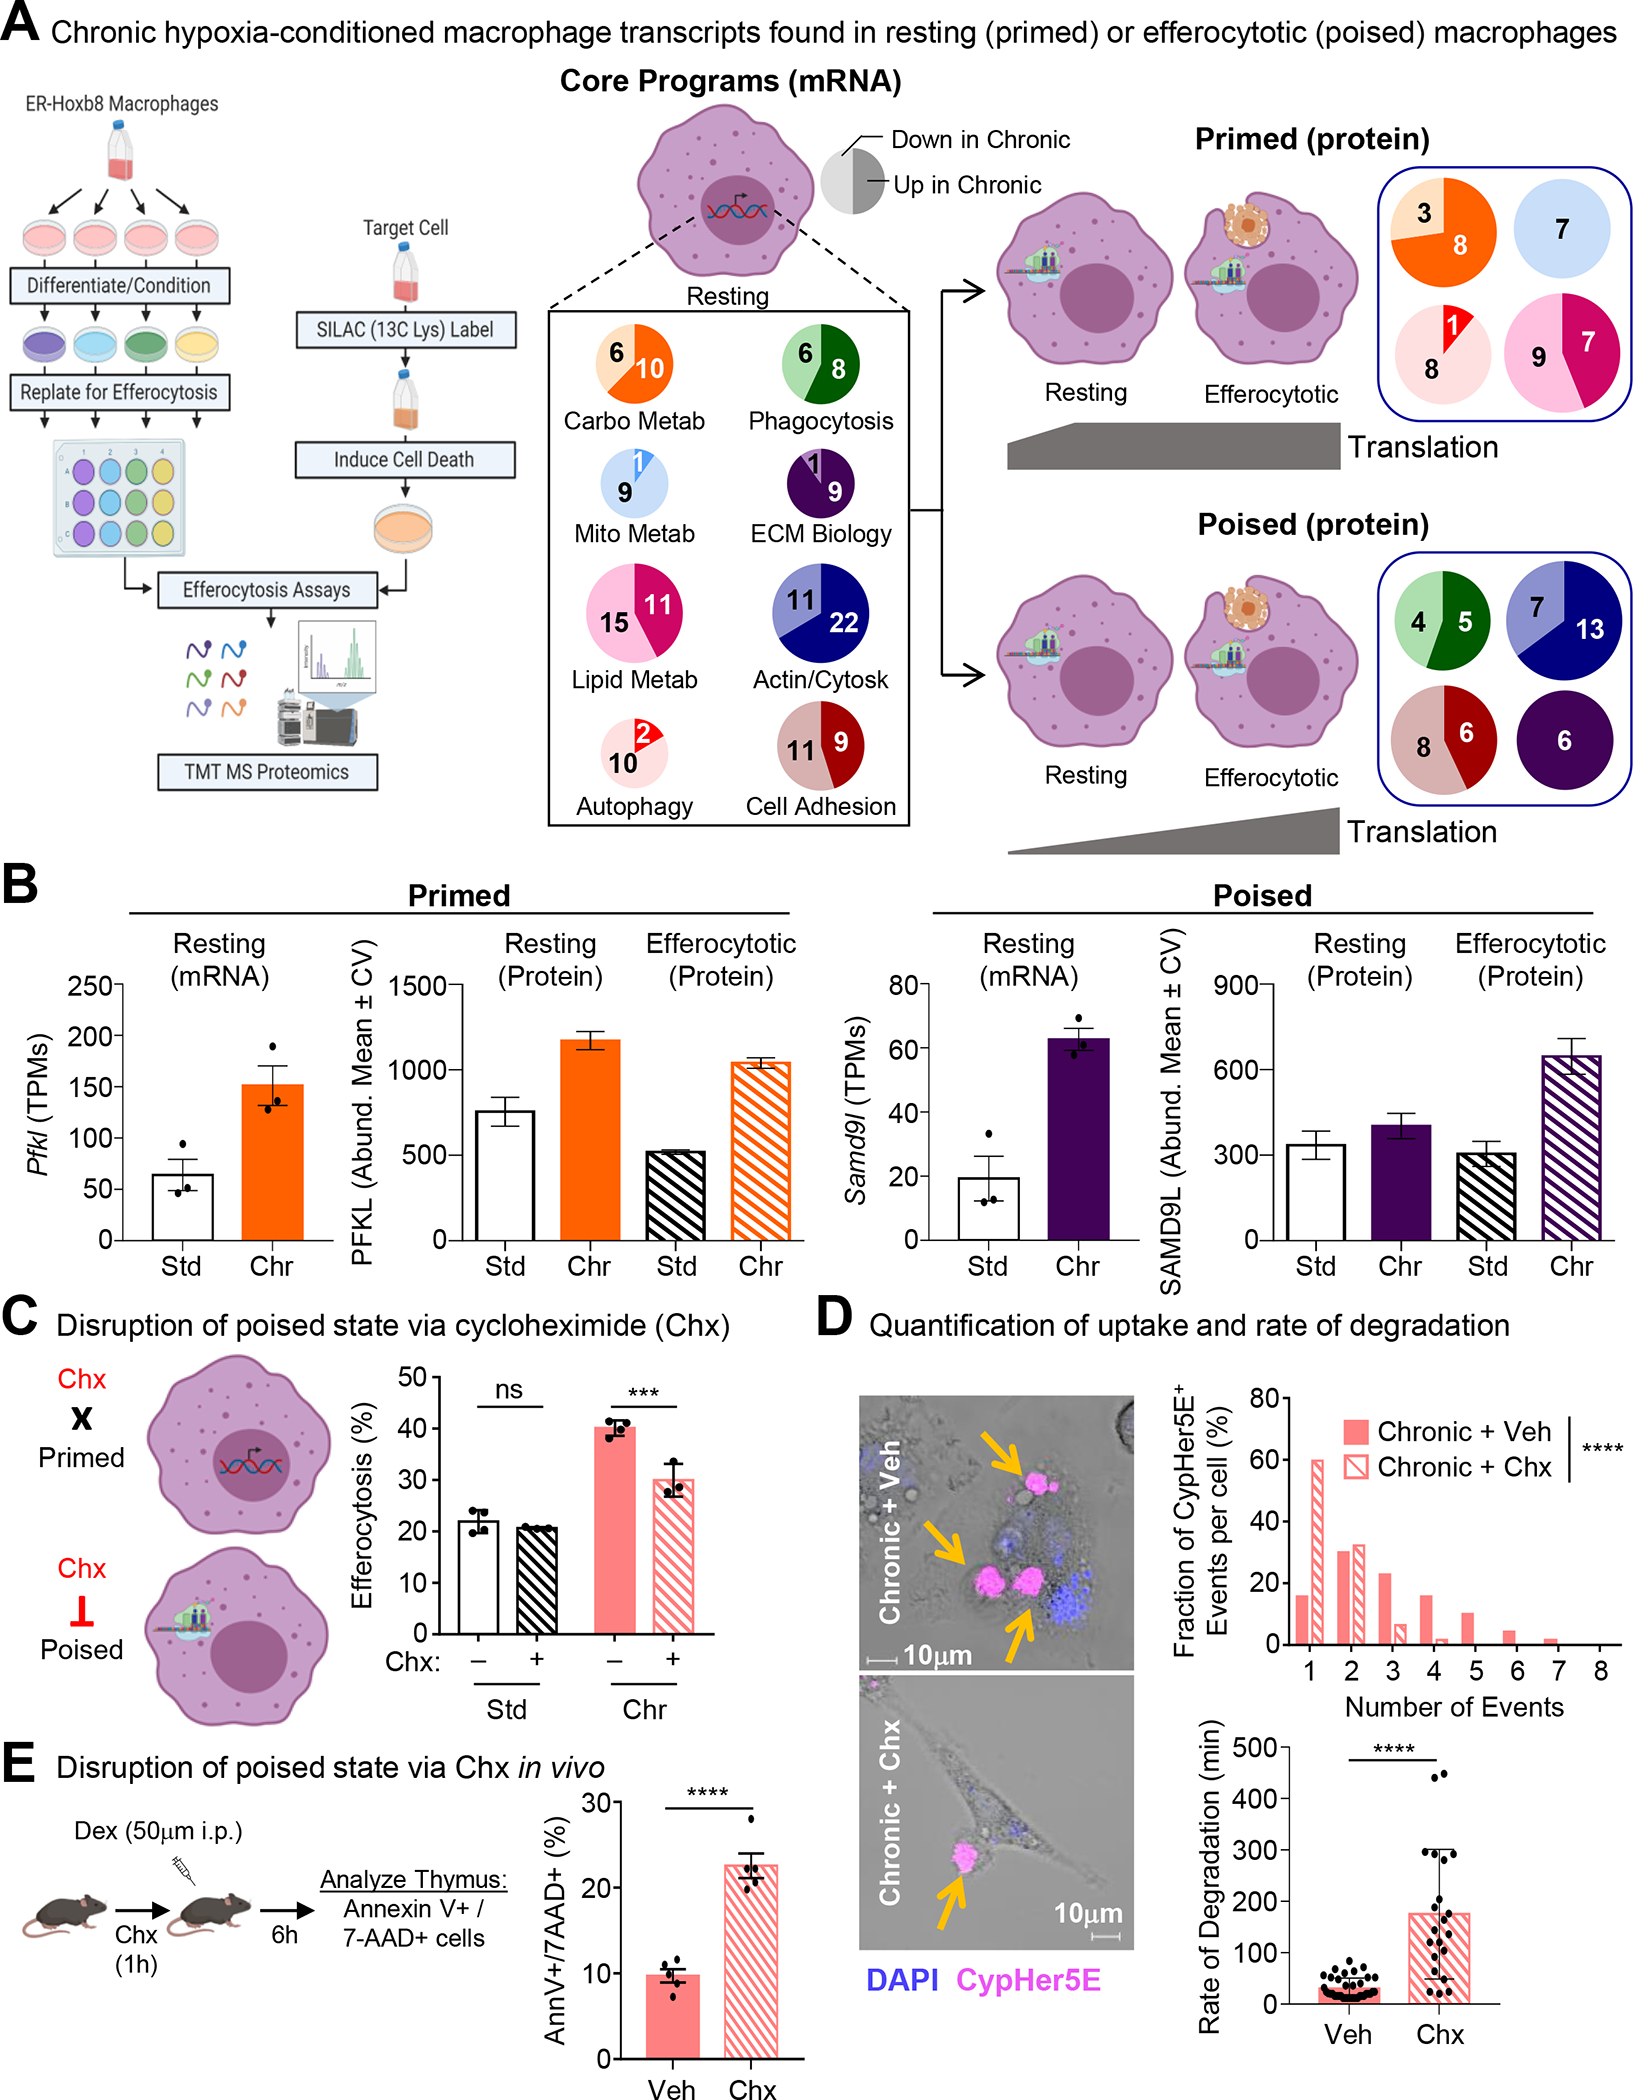
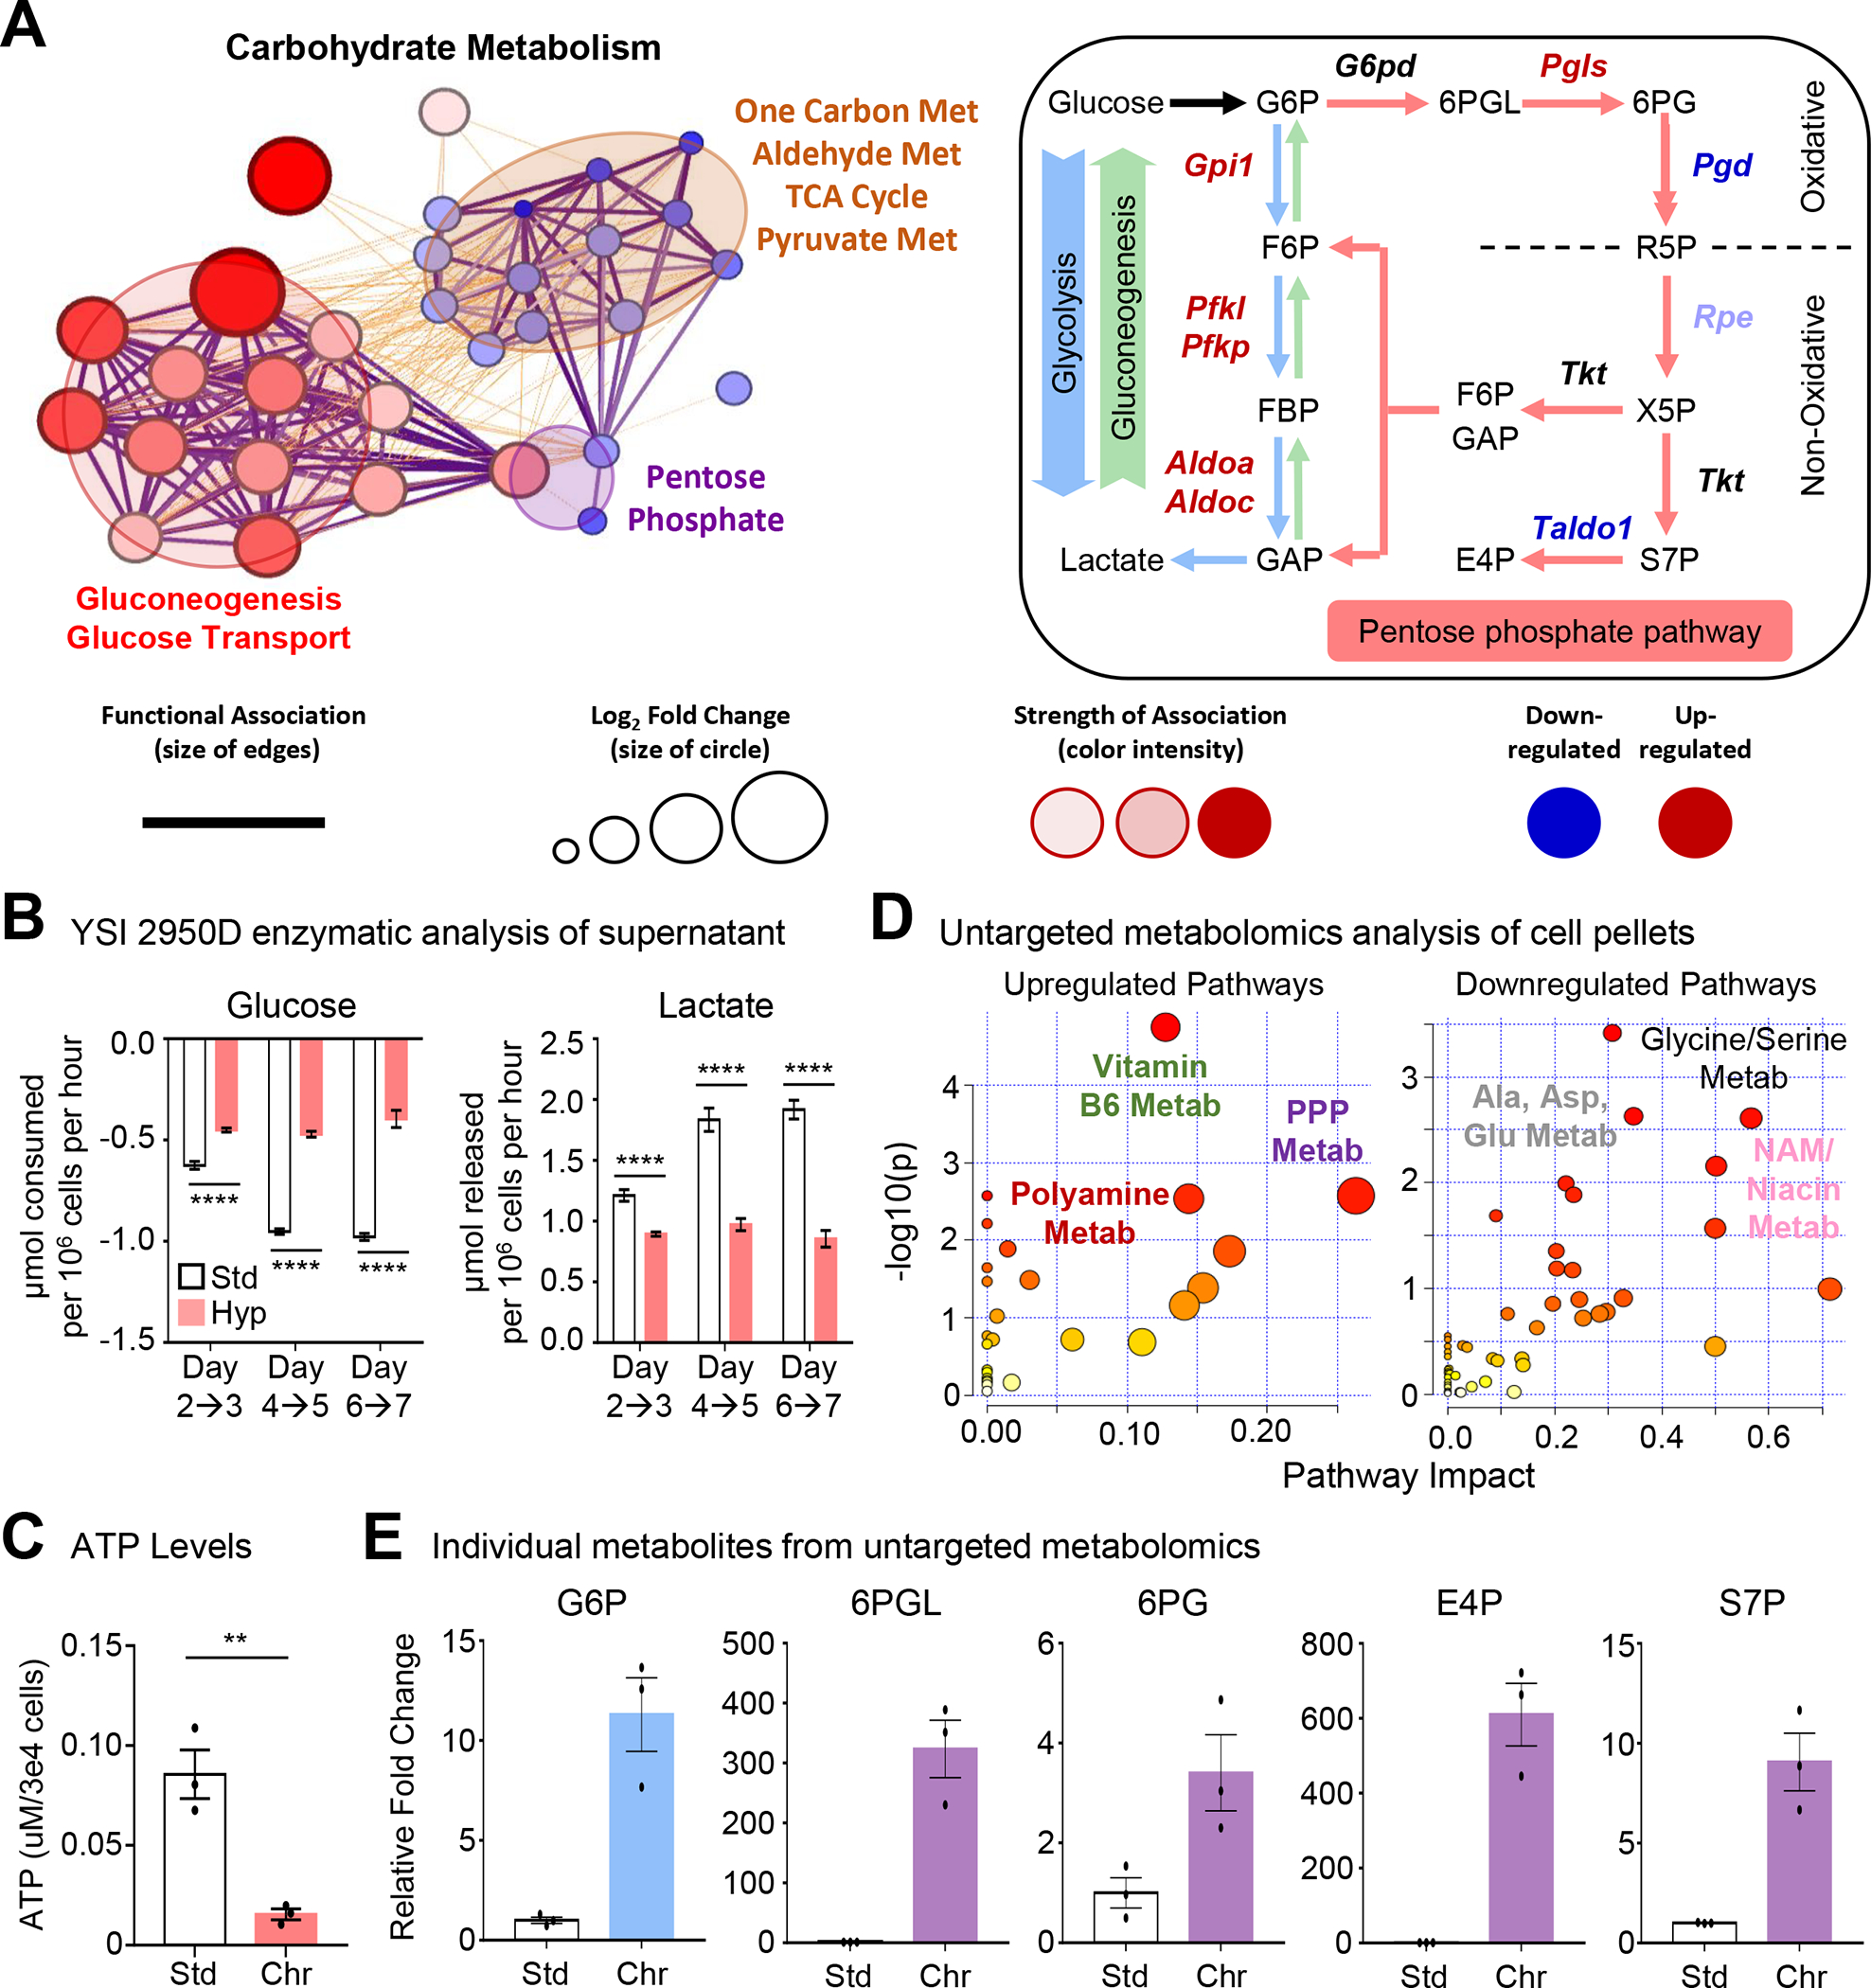
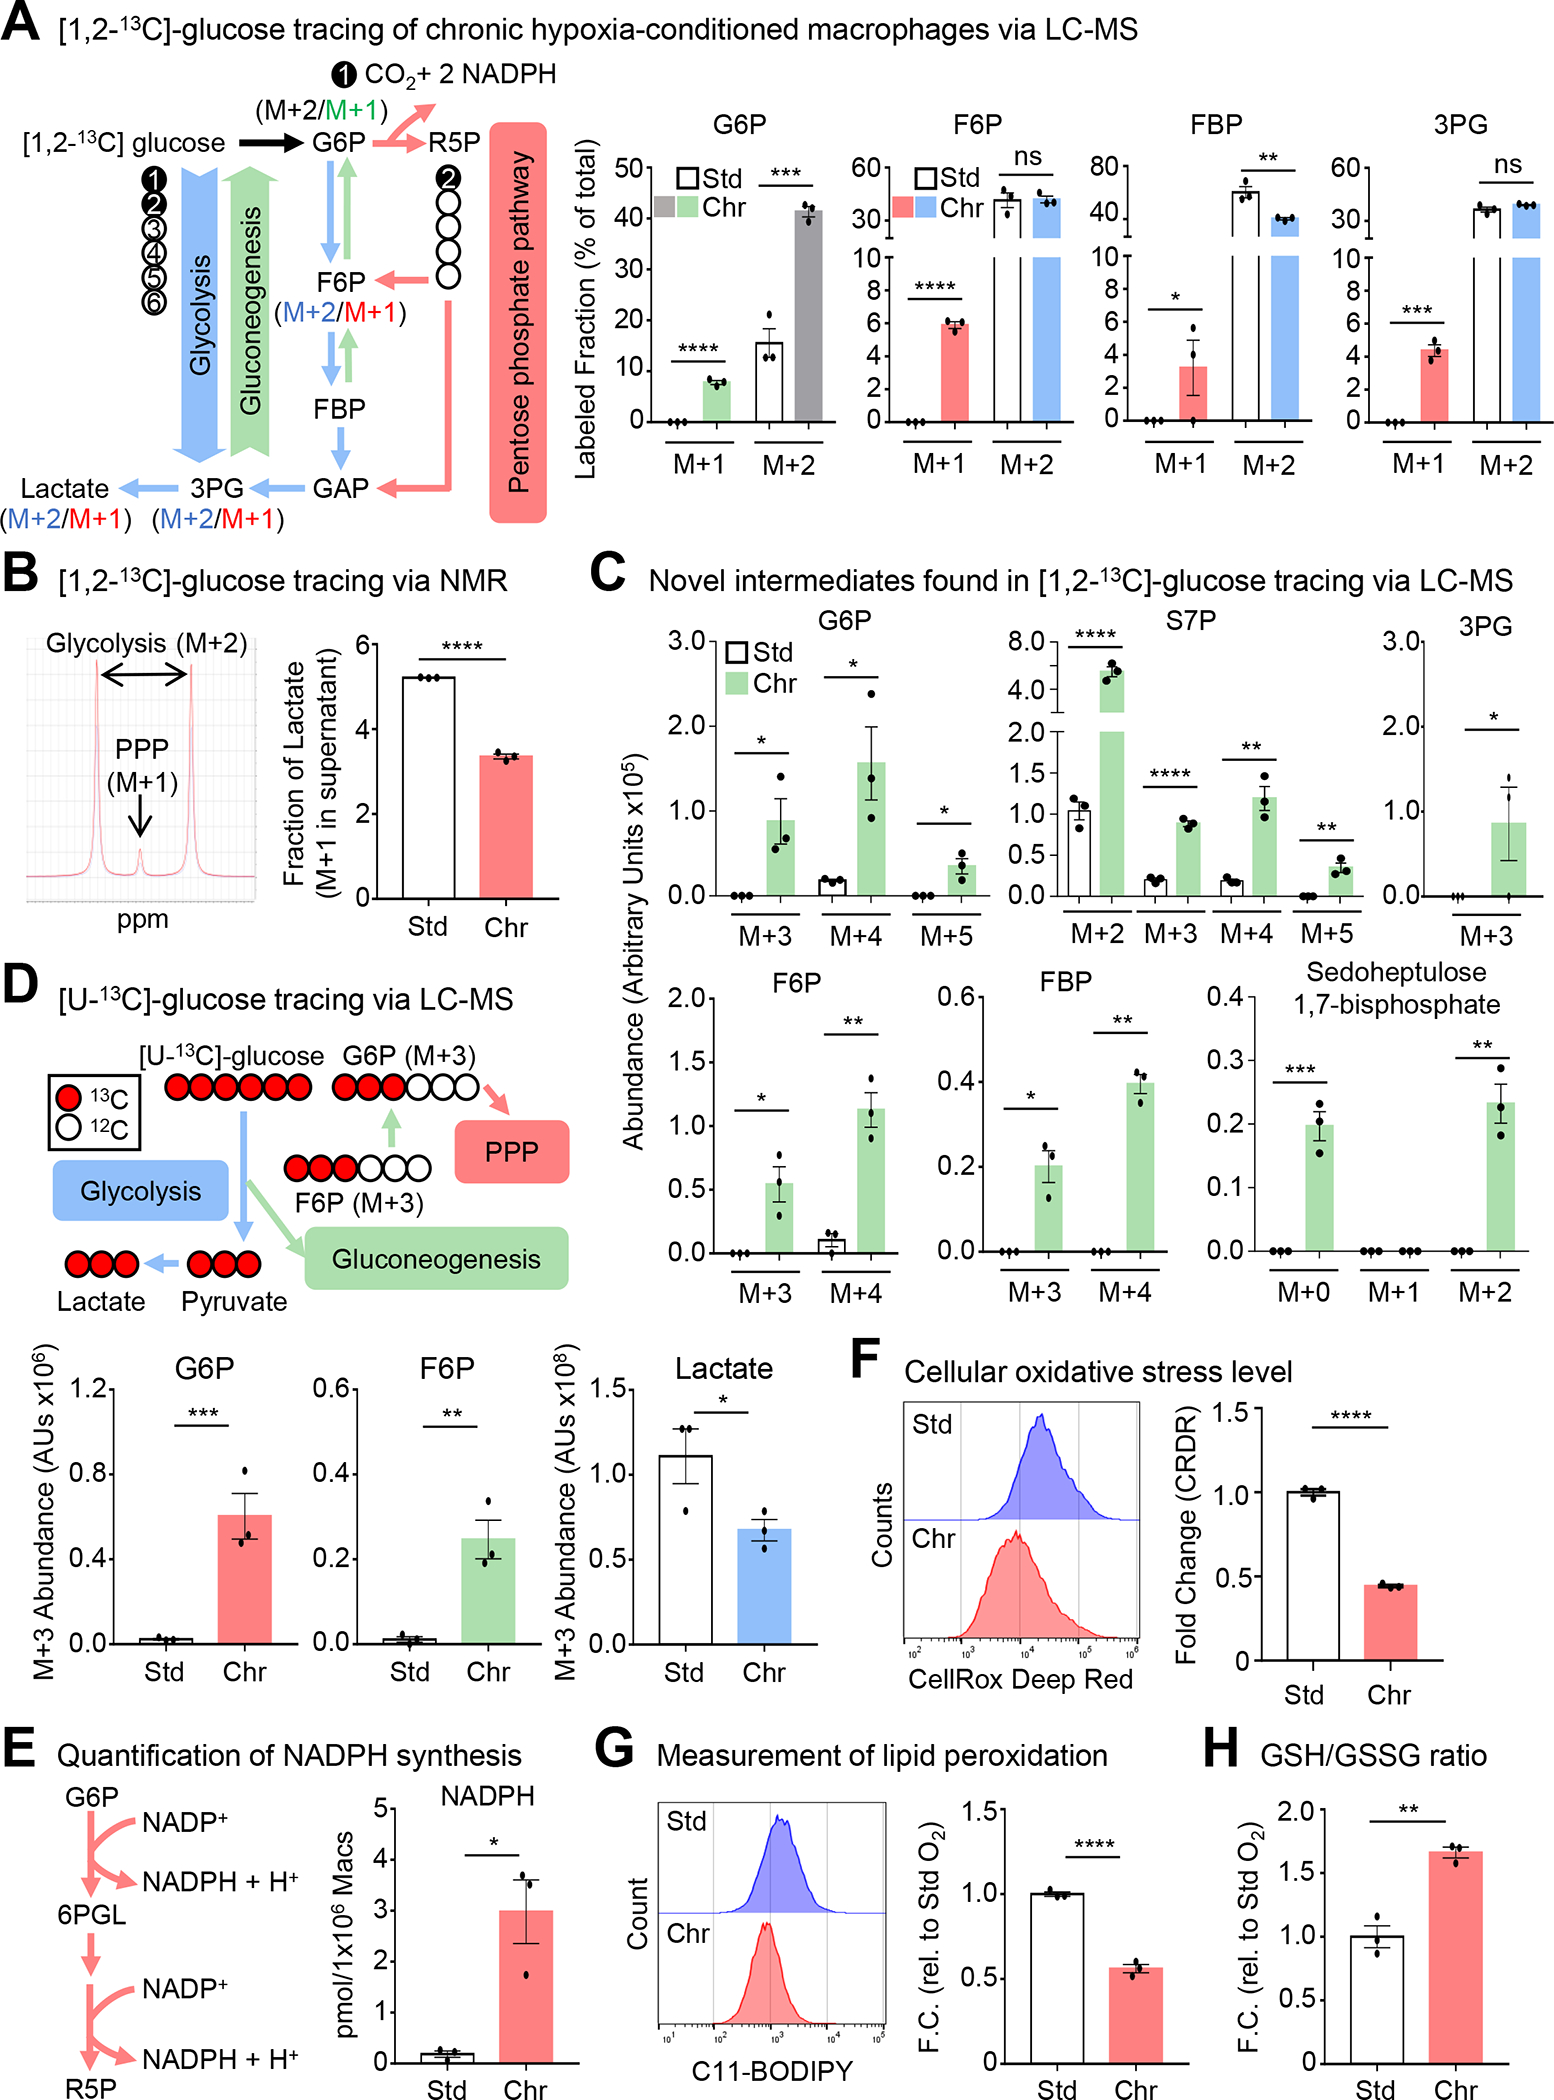
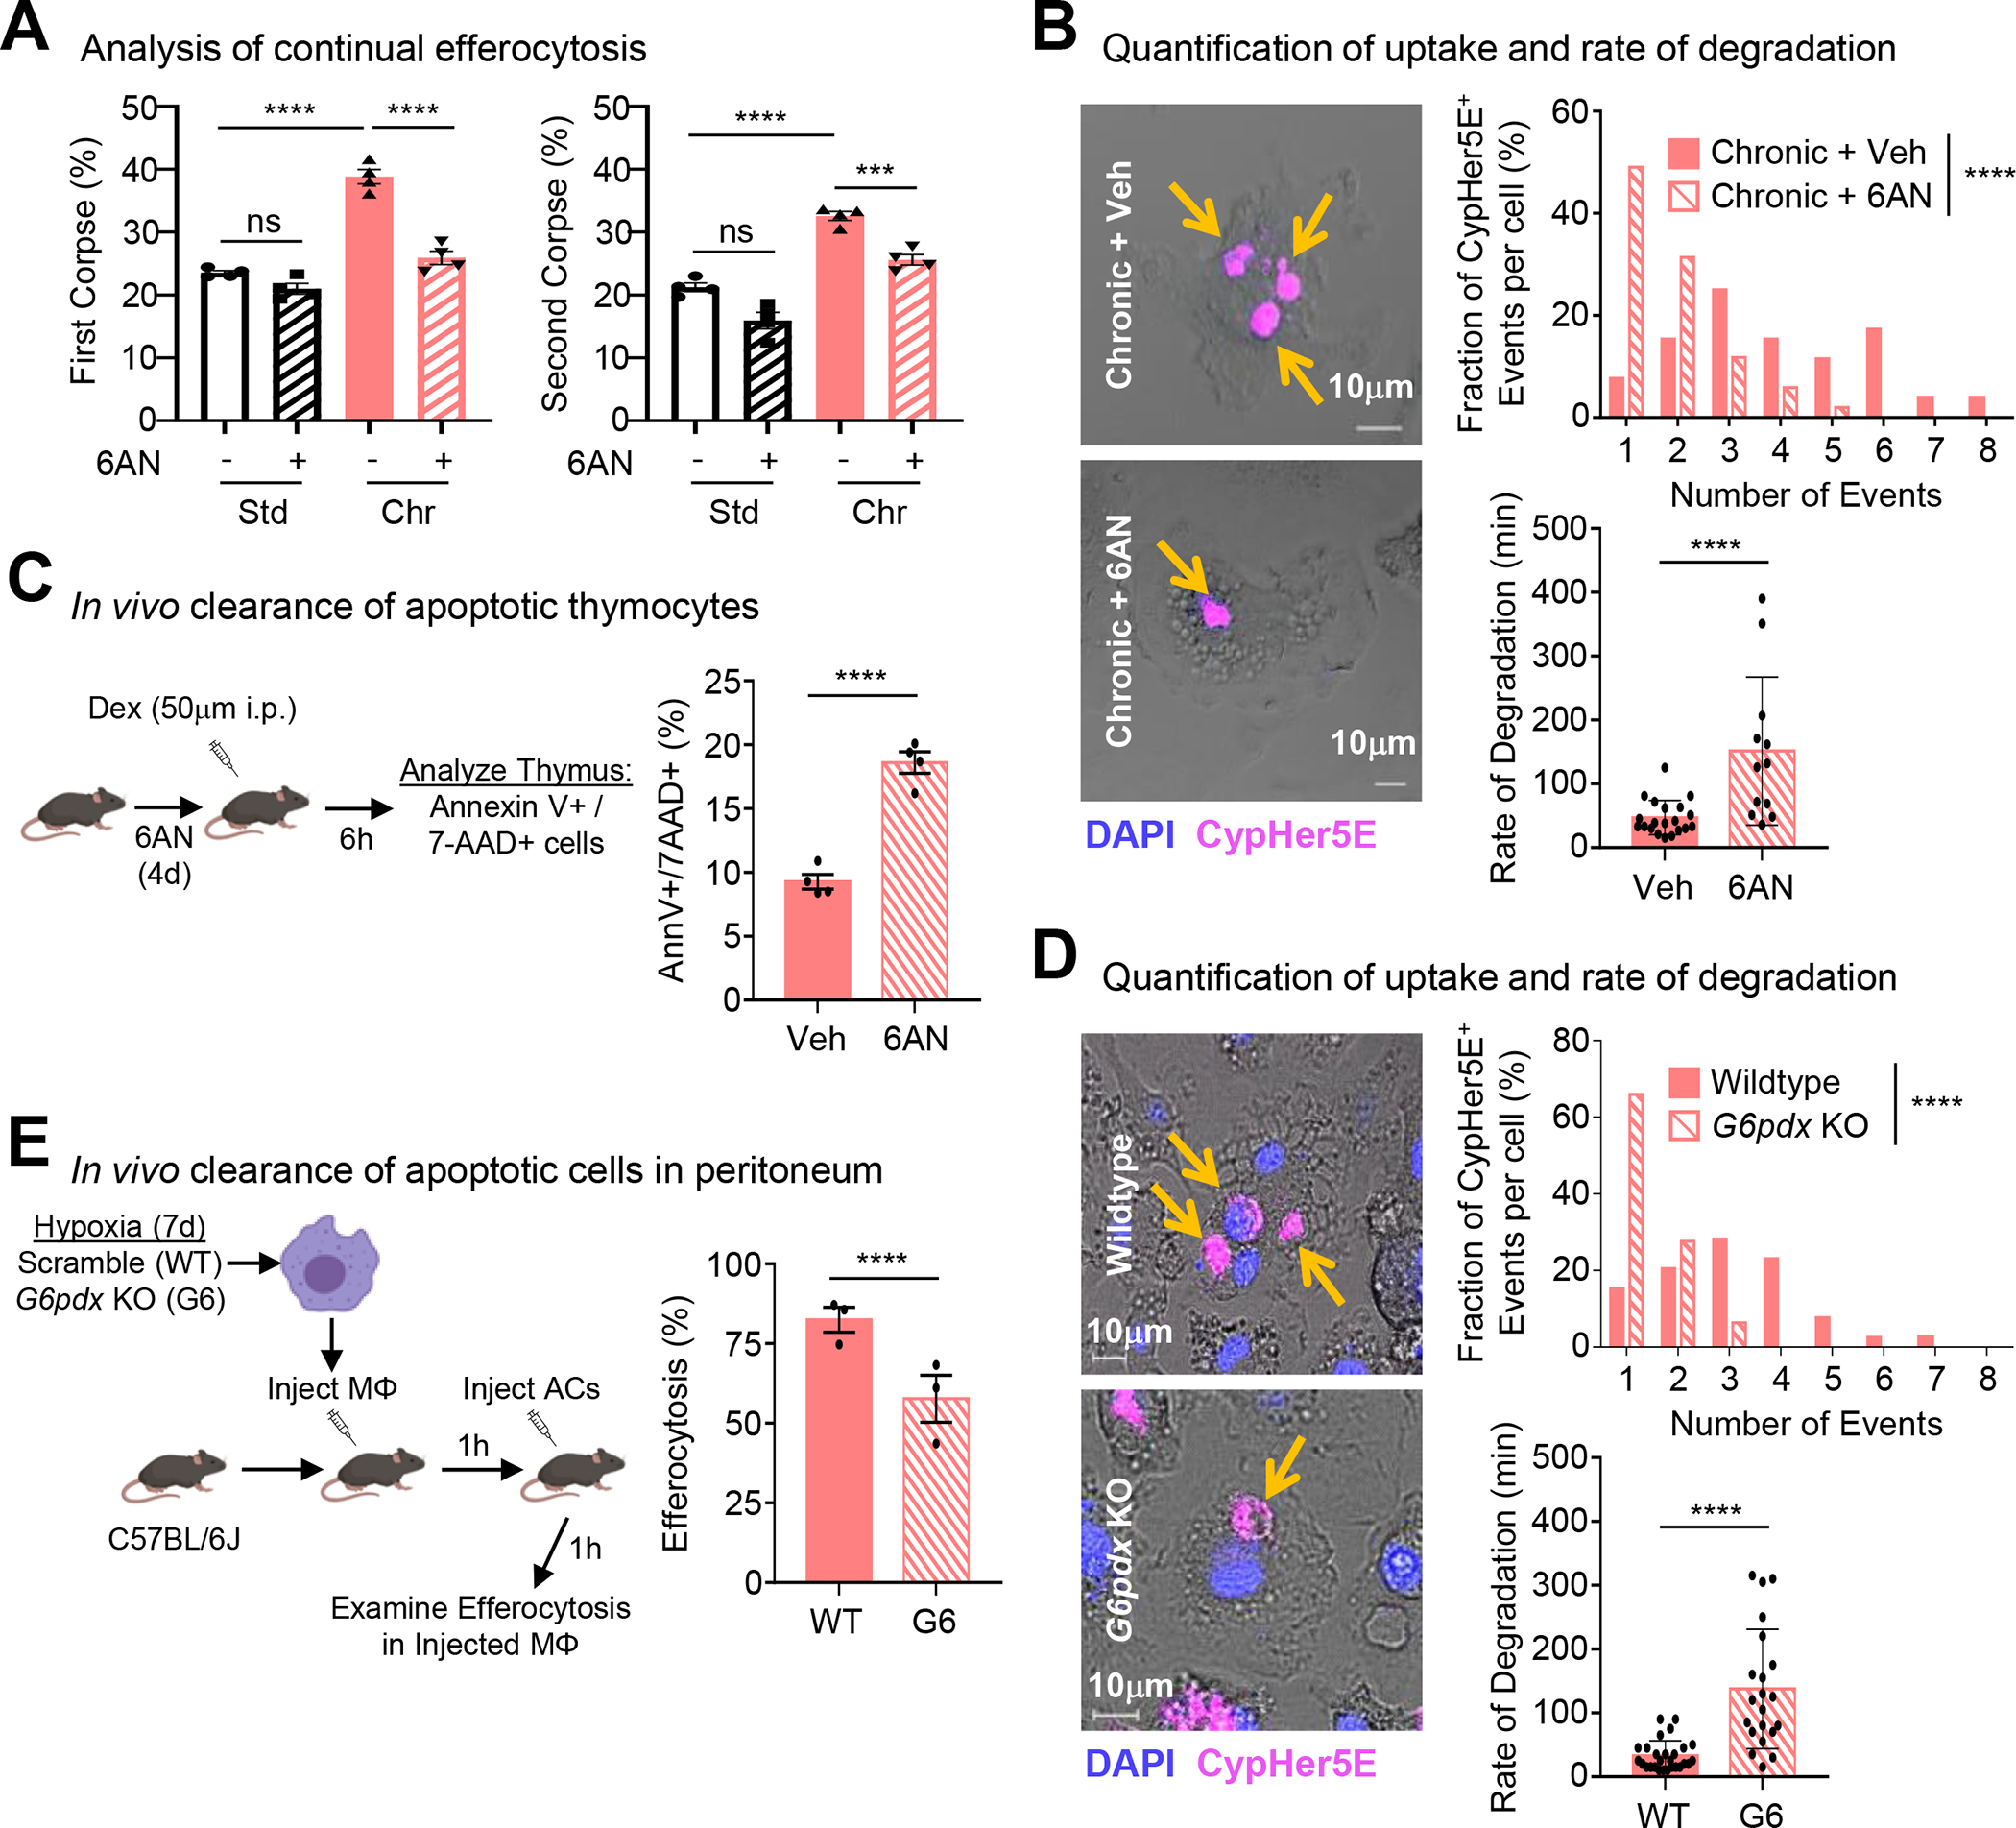
Apoptotic cell (AC) clearance (efferocytosis) is performed by phagocytes, such as macrophages, that inhabit harsh physiological environments. Here, we find that macrophages display enhanced efferocytosis under prolonged (chronic) physiological hypoxia, characterized by increased internalization and accelerated degradation of ACs. Transcriptional and translational analyses revealed that chronic physiological hypoxia induces two distinct but complimentary states. The first, "primed" state, consists of concomitant transcription and translation of metabolic programs in AC-naive macrophages that persist during efferocytosis. The second, "poised" state, consists of transcription, but not translation, of phagocyte function programs in AC-naive macrophages that are translated during efferocytosis. Mechanistically, macrophages efficiently flux glucose into a noncanonical pentose phosphate pathway (PPP) loop to enhance NADPH production. PPP-derived NADPH directly supports enhanced efferocytosis under physiological hypoxia by ensuring phagolysosomal maturation and redox homeostasis. Thus, macrophages residing under physiological hypoxia adopt states that support cell fitness and ensure performance of essential homeostatic functions rapidly and safely.

Keywords: apoptotic cell clearance; cellular adaptation; efferocytosis; homeostasis; metabolism; oxygen; pentose phosphate pathway; physiological hypoxia.


Conflict of interest statement

Declaration of interests K.R.K. serves on the scientific advisory board of NVision Imaging Technologies. J.S.A.P. and K.R.K. holds patents related to imaging and modulation of cellular metabolism.

Figures

Figure 1:
Figure 1:. Efferocytosis is enhanced under prolonged (‘chronic’) physiological hypoxia
(A) Conditioned macrophages (left) were co-cultured with CypHer5E-labeled apoptotic MDA-MB-231s for 1h, then assessed via flow cytometry. Data are from four independent experiments, shown as mean ± SEM. (B) Experiments performed as in (A), with the following targets: Jurkats, BrM2s, MDA-MD-231s, E0771s, and thymocytes. Data are from four independent experiments, shown as mean ± SEM. (C) Conditioned macrophages (left) were co-cultured with CypHer5E-labeled apoptotic MDA-MB-231s for 1h, then assessed via flow cytometry. Data are from three independent experiments, shown as mean ± SEM. (D) Experiments performed as in (A) but used to assess continual efferocytosis. Data are from three independent experiments, shown as mean ± SEM. (E, F) Experiments performed as in (A), but imaged via time-lapse confocal microscopy. Yellow arrows indicate newly internalized ACs. (F) Quantification of CypHer5E+ events (top) and rate of degradation of internalized ACs (bottom). For quantification, 115 efferocytotic macrophages from 8 standard oxygen scenes and 155 efferocytotic macrophages from 6 chronic hypoxia scenes were analyzed. Data were binned as number of events per-cell and presented as a fraction of 100%. For analysis of degradation rate, 21 (standard oxygen) and 25 (chronic hypoxia) efferocytotic macrophages were analyzed. Degradation time = time to shrink internalized AC 50% after acidification (CypHer5E+). (G, H) Bone marrow (G) or splenic (H) macrophages were isolated and seeded at either 1% or 21% oxygen overnight, then co-cultured with CypHer5E-labeled apoptotic MDA-MD-231 cells for 1h. Efferocytosis was assessed via flow cytometry. Data are from four independent experiments, shown as mean ± SEM. Significance was determined by Student’s t-test in C,F-H, and by one-way ANOVA in A,B,D,F, ****p < .0001.
Figure 2:
Figure 2:. Characterization of macrophages under chronic physiological hypoxia
(A, B) (A) Schematic of method used for RNA sequencing analysis. (B) Shown are classifications of differentially expressed genes according to known or putative function. Three independent experiments were analyzed for each condition. ECM, extracellular matrix. (C) Analysis of data from (A) to identify unique transcripts in chronic hypoxia-conditioned macrophages compared to standard oxygen and acute hypoxia (‘Chronic Hypoxia-Specific’), differentially regulated under acute hypoxia and maintained during chronic conditioning (‘General Hypoxia’), or differentially regulated in chronic hypoxia-conditioned macrophages compared to standard oxygen (‘Chronic vs. Standard O2 Only’). (D) Similar to (A) but instead analyzed via TMT-labeled mass spectrometry. Shown are differentially expressed proteins classified according to known or putative function. Six independent experiments were analyzed for each condition. MAPK, mitogen-activated protein kinase. OXPHOS, oxidative phosphorylation. Pathway significance was determined using Fisher’s Exact Tests. (E) Representative flow cytometry histograms and normalized mean fluorescence intensity (MFI) from analysis of macrophages conditioned as in (A). Data represent three independent experiments, shown as mean ± SEM. Significance was determined by Student’s t-test. **p < 0.01. ***p < 0.001. ****p < .0001.
Fig 3:
Fig 3:. Chronic hypoxia induces states both primed and poised for efferocytosis
(A) Similar to Figure 1A, except macrophages were co-cultured with apoptotic MDA-MB-231s labeled with 13C-Lysine then analyzed via mass spectrometry. Four independent experiments were analyzed for each condition. (Middle/Right) Differentially regulated mRNA transcripts (Core Programs; Middle) were either concomitantly differentially regulated at the protein level in AC-naïve macrophages (Primed; Top Right) or not differentially regulated in AC-naïve macrophages but instead were differentially regulated in efferocytotic macrophages (Poised; Bottom Right). Numbers represent genes/proteins differentially regulated, with light shading representing downregulated and dark shading representing upregulated. (B) Shown are representative transcripts/proteins from each state observed in Figure 3A. PFKL/Pfkl, ATP-dependent 6-phosphofructokinase, liver-type. SAMD9L/Samd9l, Sterile alpha motif domain-containing protein 9-like. (C) (Left) Schematic illustrating the differential effect of cycloheximide (Chx) treatment on ‘primed’ versus ‘poised’ programs. (Right) Experiments performed as in Figure 1A, but with the addition of cycloheximide treatment. Data represent three independent experiments, shown as mean ± SEM. (D) Experiments performed and analyzed as in Figure 1E. Shown are representative images (Left), quantification of CypHer5E+ events per-cell (Top Right), and analysis of degradation rate (Bottom Right). For quantification, 70 efferocytotic macrophages from 5 vehicle-treated scenes and 62 efferocytotic macrophages from 7 Chx-treated scenes were analyzed. For degradation rate, 38 (vehicle-treated) and 21 (Chx-treated) efferocytotic macrophages were analyzed. Data shown as mean ± SEM. (E) Schematic of experimental design (Left) and summary plot (Right) of AnnexinV+ 7-AAD+ thymocytes 6h post-dexamethasone (Dex) injection in vehicle (n=5) or cycloheximide (Chx)-treated mice (n=5). Data shown as mean ± SEM. Significance was determined by Student’s t-test in D,E, and by one-way ANOVA in C,D, ***p < .001, ****p < .0001. ns = not significant.
Figure 4:
Figure 4:. Metabolic pathway use in chronic physiological hypoxia-conditioned macrophages
(A) (Left) Differentially regulated metabolic genes (Figure 2) are represented using network analysis. (Right) Schematic of routes of glucose use. Genes in red are significantly upregulated whereas genes in blue are downregulated. (B) Macrophages cultured as in Figure 1A but with glucose and lactate media levels in the media analyzed. Data is from two independent experiments, with four biological replicates per experiment. Data are shown as mean ± SEM. (C) Macrophages cultured as in Figure 1A but analyzed for cellular ATP levels. Data is from three independent experiments, shown as mean ± SEM. (D) Macrophages cultured as in Figure 1A then isolated for untargeted metabolomic analysis. (Left) upregulated and (Right) downregulated pathways in chronic hypoxia-conditioned macrophages are shown. Three independent experiments were performed for each condition. (E) Shown are representative metabolites from Figure 4C. Data are shown as mean ± SEM. All metabolites are significant, p < .0001. G6P, glucose 6-phosphate. 6PGL, 6-phosphogluconolactone. 6PG, 6-phosphogluconate. E4P, erythrose 4-phosphate. S7P, sedoheptulose 7-phosphate. Significance was determined by Student’s t-test in C, and by one-way ANOVA in B, **p < .01, ****p < .0001.
Figure 5:
Figure 5:. Macrophages co-opt noncanonical pentose phosphate loop for redox homeostasis
(A) (Left) Schematic for isotopologue analysis of [1,2-13C]-glucose tracing experiments. (Right) Macrophages conditioned as in Figure 1A, but cultured with media containing [1,2-13C]-glucose for 16h then analyzed via LC-MS. Shown is the fractional enrichment of the indicated isotopologues. Three independent experiments were performed for each condition. Data are shown as mean ± SEM. G6P, glucose 6-phosphate. F6P, fructose 6-phosphate. FBP, fructose 1,6-bisphosphate. 3PG, 3-phosphoglyceric acid. (B) (Left) Macrophages conditioned as in Figure 1A. Representative peaks for PPP- and glycolysis-derived lactate in media analyzed via NMR. (Right) Cumulative data of the M+1 lactate fraction. Data are from four biological replicates, shown as mean ± SEM. (C) Analysis of experiments from Figure 5A. Data shown as mean ± SEM. G6P, glucose 6-phosphate. S7P, sedoheptulose 7-phosphate. 3PG, 3-phosphoglyceric acid. F6P, fructose 6-phosphate. FBP, fructose 1,6-bisphosphate. (D) (Top) Schematic for [U-13C]-glucose flux analysis. (Bottom) Similar to Figure 5A, except using [U-13C]-glucose. Shown is the relative abundance of the indicated isotopologues. Data are from three independent experiments, shown as mean ± SEM. G6P, glucose 6-phosphate. F6P, fructose 6-phosphate. (E) (Left) Schematic of NADPH synthesis via PPP. (Right) Macrophages conditioned as in Figure 5A, followed by NADPH quantification. Data are from three independent experiments, shown as mean ± SEM. (F) Macrophages conditioned as in Figure 5A. Oxidative stress levels were measured using CellRox Deep Red. Shown are representative flow cytometry plots (Left) and summary plots (Right). Data are representative of three independent experiments, shown as mean ± SEM. (G) Experiments performed as in Figure 5A. Lipid peroxidation was measured using C11-BODIPY 581/591. Shown are representative flow cytometry plots (Left) and summary plots (Right). Data are representative of three independent experiments, shown as mean ± SEM. (H) Experiments performed as in Figure 5A, then analyzed for total glutathione, reduced glutathione (GSH), and oxidized glutathione (GSSG). Data are from four independent experiments, shown as mean ± SEM. Significance was determined by Student’s t-test in B,D-H, and by one-way ANOVA in A,C, *p < .05, **p < .01, ***p < .001, ****p < .0001. ns = not significant.
Figure 6:
Figure 6:. Noncanonical pentose phosphate loop supports continual efferocytosis
(A) Continual efferocytosis experiments performed as in Figure 1D. Data represent three independent experiments, shown as mean ± SEM. (B) Experiments performed and analyzed as in Figure 1E. Shown are representative images (Left), quantification of CypHer5E+ events per-cell (Top Right), and analysis of degradation rate (Bottom Right). For quantification, 53 efferocytotic macrophages from 5 vehicle-treated scenes and 51 efferocytotic macrophages from 7 6AN-treated scenes were analyzed. For degradation rate, 21 (vehicle-treated) and 13 (6AN-treated) efferocytotic macrophages were analyzed. Data shown as mean ± SEM. (C) Schematic of experimental design (Left) and summary plot (Right) of AnnexinV+ 7-AAD+ thymocytes 6h post-dexamethasone (Dex) injection in vehicle (n=4) or 6AN-treated mice (n=4). Data shown as mean ± SEM. (D) Experiments performed and analyzed as in Figure 1E except using G6PDX-deficient (G6) macrophages. Shown are representative images (Left), quantification of CypHer5E+ events (Top Right), and analysis of degradation rate (Bottom Right). For quantification, 39 efferocytotic macrophages from 5 WT scenes and 47 efferocytotic macrophages from 7 G6pdx-deficient scenes were analyzed. For degradation rate, 27 (WT) and 21 (G6pdx-deficient) efferocytotic macrophages were analyzed. Data shown as mean ± SEM. (E) (Left) Schematic of experimental design. (Right) Summary plot of efferocytosis rate by GFP+ CD11b+ F4/80+ macrophages in WT mice (n=3) and G6pdx-deficient mice (n=3). Data shown as mean ± SEM. Significance was determined by Student’s t-test in B-E, and by one-way ANOVA in A,B,D, ***p < .001, ****p < .0001. ns = not significant.
Figure 7:
Figure 7:. Noncanonical pentose phosphate loop prevents redox crisis in efferocytotic macrophages
(A) Experiments performed as in Figure 1A, with inclusion of 6AN. Data are from three independent experiments, shown as mean ± SEM. (B) Experiments performed as in Figure 7A. Data are from three independent experiments, shown as mean ± SEM. (C) Experiments performed as in Figure 7A except using G6PDX-deficient (G6) macrophages. Data are from three independent experiments, shown as mean ± SEM. (D, E) Experiments performed as in Figure 7A using 6AN-treated macrophages (D) or G6PDX-deficient (G6) macrophages (E). Lysosomal acidification was measured in efferocytotic macrophages (CypHer5E+). Shown are representative flow cytometry plots (Left) and MFI (Right) from three independent experiments. Data are shown as mean ± SEM. (F, G) Experiments performed as in Figure 7A using 6AN-treated macrophages (F) or G6PDX-deficient (G6) macrophages (G). Cellular ROS was measured in efferocytotic macrophages (CypHer5E+). Shown are representative flow cytometry plots (Left) and MFI (Right) from three independent experiments. Data are shown as mean ± SEM. Significance was determined by Student’s t-test in C, and by one-way ANOVA in A,B,D-G, *p < .05, **p < .01, ***p < .001, ****p < .0001. ns = not significant.

Similar articles

Cited by

References

    1. Boada-Romero E, Martinez J, Heckmann BL, and Green DR (2020). The clearance of dead cells by efferocytosis. Nature Reviews Molecular Cell Biology 21, 398–414. 10.1038/s41580-020-0232-1. - DOI - PMC - PubMed
    1. Doran AC, Yurdagul A, and Tabas I (2020). Efferocytosis in health and disease. Nature Reviews Immunology 20, 254–267. 10.1038/s41577-019-0240-6. - DOI - PMC - PubMed
    1. Rothlin CV, Hille TD, and Ghosh S (2020). Determining the effector response to cell death. Nat Rev Immunol. 10.1038/s41577-020-00456-0. - DOI - PMC - PubMed
    1. Elliott Michael R., and Ravichandran Kodi S. (2016). The Dynamics of Apoptotic Cell Clearance. Developmental Cell 38, 147–160. 10.1016/j.devcel.2016.06.029. - DOI - PMC - PubMed
    1. Henson PM (2017). Cell Removal: Efferocytosis. Annual Review of Cell and Developmental Biology 33, 127–144. 10.1146/annurev-cellbio-111315-125315. - DOI - PubMed

Publication types