. 2023 Jan 17;4(1):100877.
doi: 10.1016/j.xcrm.2022.100877. Epub 2022 Dec 29.

Proteomics separates adult-type diffuse high-grade gliomas in metabolic subgroups independent of 1p/19q codeletion and across IDH mutational status

Affiliations

Proteomics separates adult-type diffuse high-grade gliomas in metabolic subgroups independent of 1p/19q codeletion and across IDH mutational status

Jakob Maximilian Bader et al. Cell Rep Med. .

Abstract

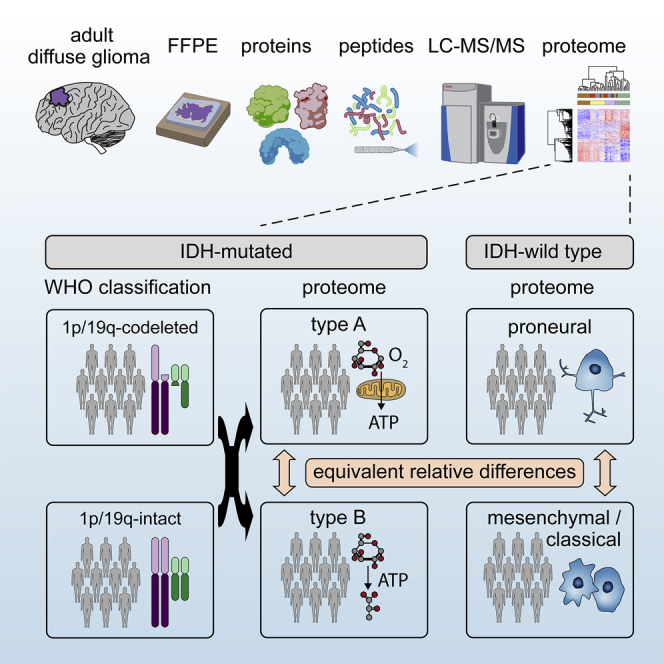
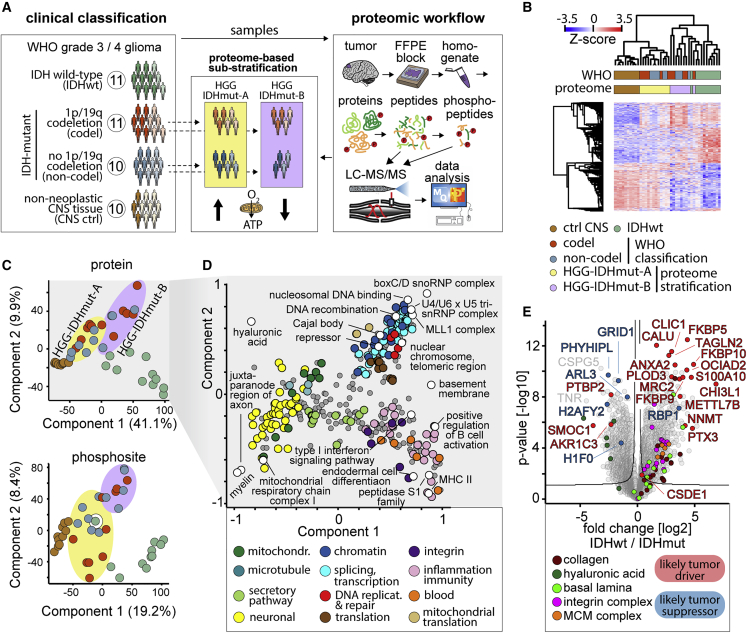
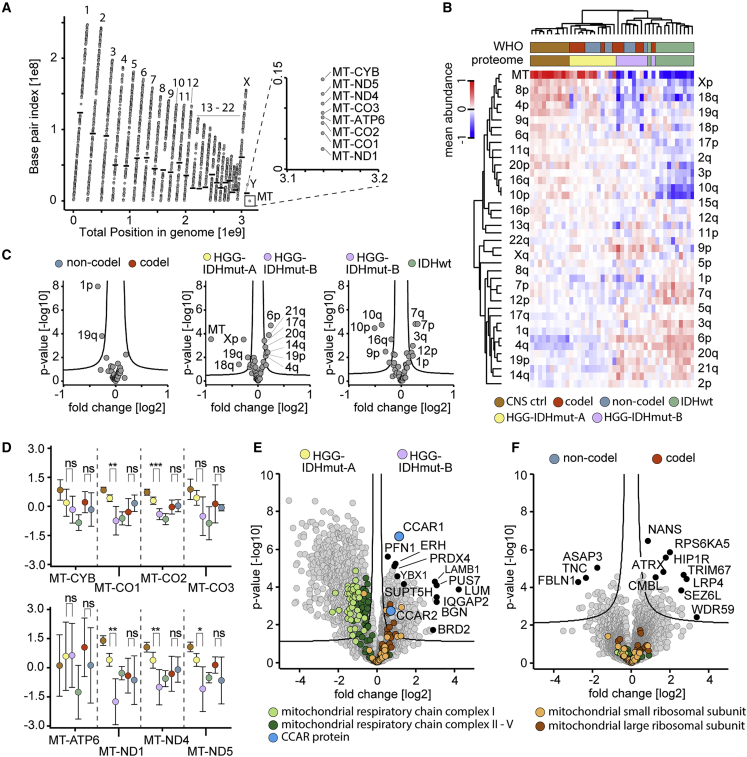
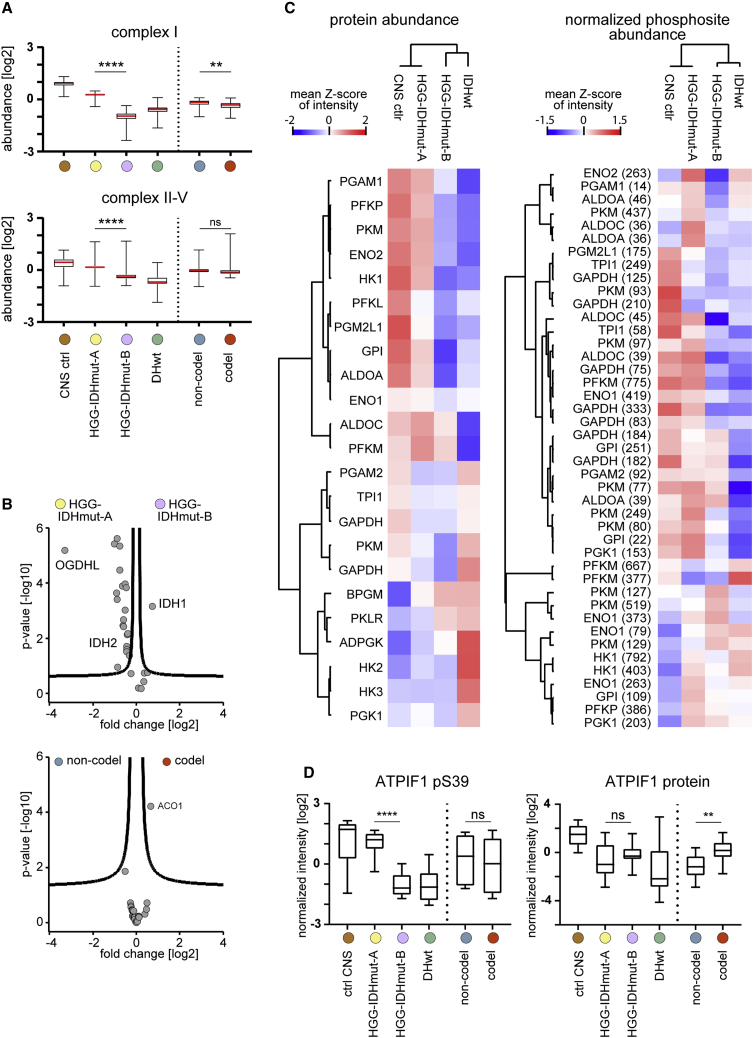
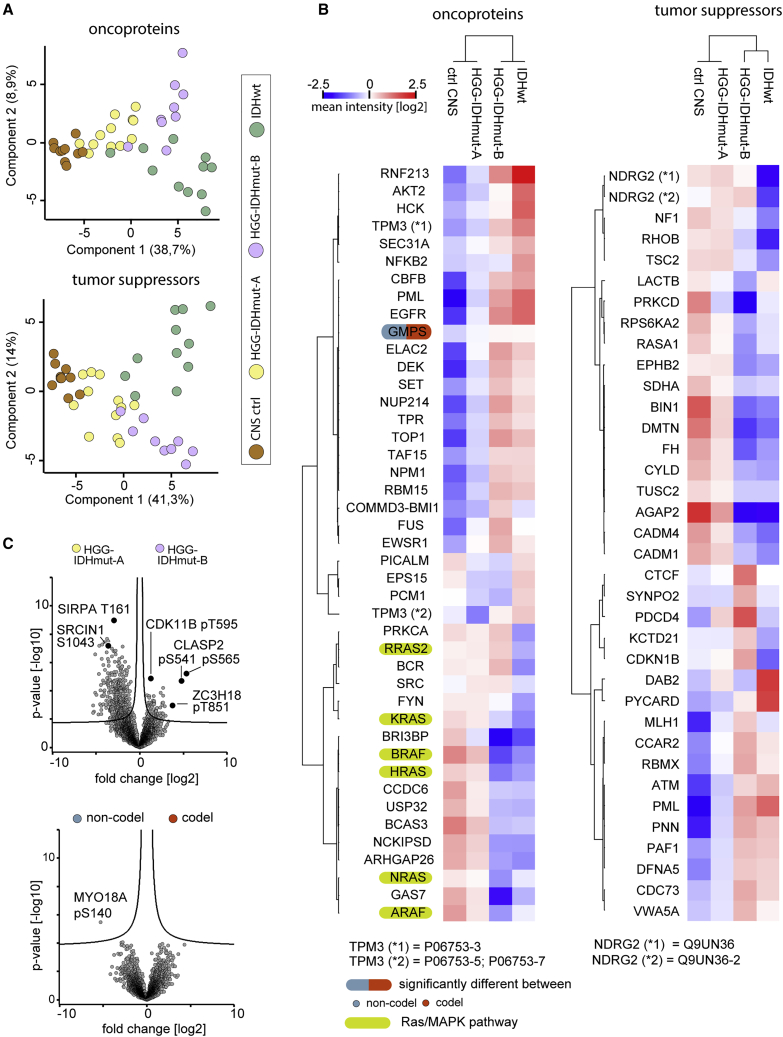
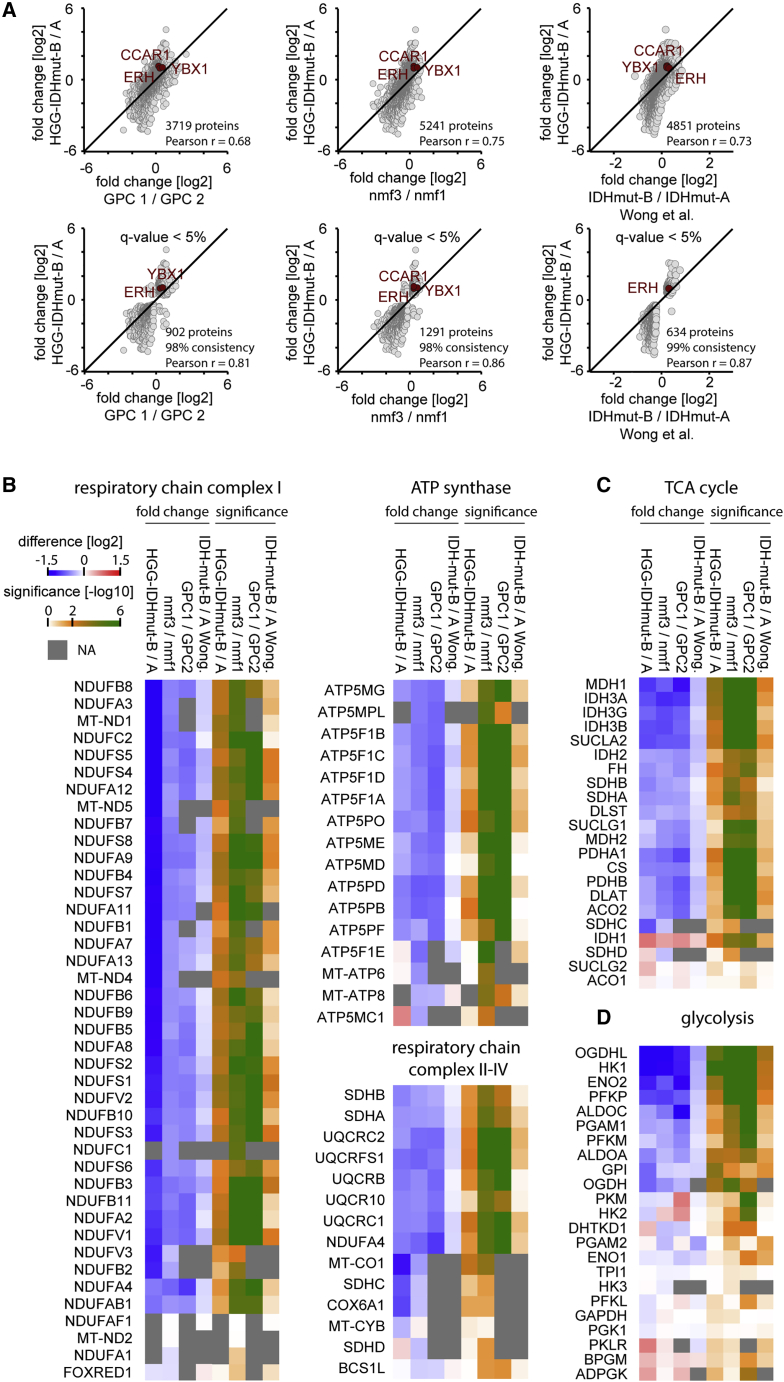
High-grade adult-type diffuse gliomas are malignant neuroepithelial tumors with poor survival rates in combined chemoradiotherapy. The current WHO classification is based on IDH1/2 mutational and 1p/19q codeletion status. Glioma proteome alterations remain undercharacterized despite their promise for a better molecular patient stratification and therapeutic target identification. Here, we use mass spectrometry to characterize 42 formalin-fixed, paraffin-embedded (FFPE) samples from IDH-wild-type (IDHwt) gliomas, IDH-mutant (IDHmut) gliomas with and without 1p/19q codeletion, and non-neoplastic controls. Based on more than 5,500 quantified proteins and 5,000 phosphosites, gliomas separate by IDH1/2 mutational status but not by 1p/19q status. Instead, IDHmut gliomas split into two proteomic subtypes with widespread perturbations, including aerobic/anaerobic energy metabolism. Validations with three independent glioma proteome datasets confirm these subgroups and link the IDHmut subtypes to the established proneural and classic/mesenchymal subtypes in IDHwt glioma. This demonstrates common phenotypic subtypes across the IDH status with potential therapeutic implications for patients with IDHmut gliomas.

Keywords: 1p/19q codeletion; IDH; glioblastoma; glioma; isocitrate dehydrogenase; proteomics.


Conflict of interest statement

Declaration of interests The authors declare no competing interests.

Figures

None
Graphical abstract
Figure 1
Figure 1
Study and global proteome overview (A) Cohort overview and schematic proteomic workflow. Sample numbers in circles. Dark colors represent males and light colors females. The icons at the bottom of the proteome-based classification of IDHmut gliomas represents high (arrow up) and low (arrow down) expression levels of mitochondrial respiratory chain proteins. (B) Unbiased hierarchical clustering of all 42 samples (columns) and proteins (rows), Z-scored protein intensity shown in a heatmap; 3,749 significant proteins included, significance (q < 5% at s0 = 2) according to one-way ANOVA analysis using the WHO-defined entities. Sample clustering based on Euclidian distance and protein clustering based on Pearson correlation. (C) Principal-component analysis of proteomes of all 42 samples for protein abundance (upper panel) and phosphosite abundance (lower panel). Components 1 and 2 shown, respectively. Sample color code as in (A and B). Colored ellipses highlight the IDHmut HGG-IDHmut-A and HGG-IDHmut-B clusters as defined in (B). (D) Two-dimensional analysis of protein annotation term enrichment in components 1 and 2 of the principal-component analysis of the proteome dataset linking the components to biological features. (E) Comparison of IDHwt and IDHmut glioma proteomes. Samples, n = 11 IDHwt and 21 IDHmut.
Figure 2
Figure 2
Chromosomal alterations point at mitochondrial perturbations in the alternatively stratified groups of IDHmut gliomas (A) Proteome coverage across the human genome in the entire dataset (42 samples). Points indicate quantified proteins, black horizontal bars as boundaries between chromosomal p and q arms; p arms below and q arms above the bar. Uncovered areas included the p arms of chromosomes 13, 14, 15, 21, and 22, and the centromere-proximal quarter of the 9p arm. (B) Relative abundance of chromosome arm-specific proteomes across samples shown as a heatmap. Abundance as mean intensity of all proteins assigned to a given chromosome arm. Protein intensities normalized by subtraction of median across samples before mean averaging. Samples, n = 10 (ctrl CNS), n = 12 (HGG-IDHmut-A), n = 9 (HGG-IDHmut-B), n = 11 (IDHwt), n = 11 (codel), n = 10 (non-codel). (C) Abundance difference of chromosome arm-specific proteomes between IDHmut glioma entities. Comparison of codel (n = 11) versus non-codel entity (n = 10) (left), (center), IDHwt (n = 11) versus HGG-IDHmut-B (n = 9) (right). (D) Abundance of proteins encoded by mitochondrial DNA across the conventional and alternatively defined tumor and control entities of this study. Circles denote means and error bars 95% confidence intervals of the mean. Color code and sample numbers as in (B). (E and F) Global proteome and abundance differences in mitochondrial proteins between the alternative proteome-defined entities HGG-IDHmut-A (n = 12) and HGG-IDHmut-B (n = 9) (E) and the 1p/19q-codeleted (n = 11) and non-codeleted (n = 10) entities (F) of IDHmut glioma. Mitochondrial respiratory chain complex V refers to ATP synthase.
Figure 3
Figure 3
Metabolism-related proteome differences associated with the novel classification of IDHmut tumors (A) Abundance of mitochondrial respiratory chain complex proteins across the sample entities of this study, split by complex I (upper panel) and complex II-V (lower panel). Samples, n = 10 (ctrl CNS), n = 12 (HGG-IDHmut-A), n = 9 (HGG-IDHmut-B), n = 11 (IDHwt), n = 11 (codel), n = 10 (non-codel). (B) Regulation of tricarboxylic acid protein abundances between HGG-IDHmut-B and HGG-IDHmut-A entities (upper panel) but not between codeletion-defined entities (lower panel). Sample numbers as in (A). (C) Glycolysis-related protein profiles (left panel) and protein abundance-normalized phosphosite profiles (right panel) across the proteome-defined entities. Abundances as sample group means of cross-sample Z scores of protein intensities and relative protein-normalized phosphosite intensities. Sample numbers as in (A). (D) Abundance of the ATPIF1 pS39 phosphosite (left panel) and the protein abundance (right panel) across the entities of this study. Sample numbers as in (A).
Figure 4
Figure 4
The alternative sub-stratification of IDHmut gliomas correlates with altered tumor suppressor, onco-proteins, and phosphosite levels (A) Principal-component analysis of UniProt keyword-annotated proto-oncogenes (upper panel) and tumor suppressor genes (lower panel). Samples, n = 10 (ctrl CNS), n = 12 (HGG-IDHmut-A), n = 9 (HGG-IDHmut-B), n = 11 (IDHwt). (B) Abundance profiles of oncoprotein (left) and tumor suppressor (right) proteins across the proteomic entities of this study. Protein intensities are first normalized by subtraction of cross-sample median and then averaged by mean sample group abundance. Samples, n = 12 (HGG-IDHmut-A), n = 9 (HGG-IDHmut-B), n = 11 (codel), n = 10 (non-codel). (C) Phosphosite abundance differences between the proteomic entities of this study (upper panel) and the 1p/19q codeletion-defined entities (lower panel). Sample numbers as in (A).
Figure 5
Figure 5
Comparison of HGG-IDHmut-B/HGG-IDHmut-A to the proteomic data of three other glioma studies HGG-IDHmut-A (n = 12) and HGG-IDHmut-B (n = 9) correlate with the high and low oxidative phosphorylation glioma subgroups reported as GPC2 (n = 13) and GPC1 (n = 26), nmf1/proneural-like (n = 29) and nmf3/classical-like (n = 25), and IDHmut-A (n = 10) and IDHmut-B (n = 28), respectively. (A) Pairwise comparison of fold changes across all proteins overlapping in both datasets (upper panel) and across all proteins significantly regulated (q < 5%) in both datasets. (B) Regulation of mitochondrial respiratory chain proteins across datasets. (C) Regulation of tricarboxylic acid cycle proteins across datasets. (D) Regulation of glycolysis proteins across datasets.

Comment in

Similar articles

Cited by

References

    1. Ostrom Q.T., Bauchet L., Davis F.G., Deltour I., Fisher J.L., Langer C.E., Pekmezci M., Schwartzbaum J.A., Turner M.C., Walsh K.M., et al. The epidemiology of glioma in adults: a state of the science review. Neuro Oncol. 2014;16:896–913. doi: 10.1093/neuonc/nou087. - DOI - PMC - PubMed
    1. WHO Classification of Tumours Editorial Board . 5th ed. International Agency for Research on Cancer; 2021. World Health Organization Classification of Tumours of the Central Nervous System.
    1. Dolecek T.A., Propp J.M., Stroup N.E., Kruchko C. CBTRUS statistical report: primary brain and central nervous system tumors diagnosed in the United States in 2005-2009. Neuro Oncol. 2012;14:v1–v49. doi: 10.1093/neuonc/nos218. - DOI - PMC - PubMed
    1. Stupp R., Hegi M.E., Mason W.P., van den Bent M.J., Taphoorn M.J.B., Janzer R.C., Ludwin S.K., Allgeier A., Fisher B., Belanger K., et al. Effects of radiotherapy with concomitant and adjuvant temozolomide versus radiotherapy alone on survival in glioblastoma in a randomised phase III study: 5-year analysis of the EORTC-NCIC trial. Lancet Oncol. 2009;10:459–466. doi: 10.1016/S1470-2045(09)70025-7. - DOI - PubMed
    1. Ohgaki H., Kleihues P. Genetic pathways to primary and secondary glioblastoma. Am. J. Pathol. 2007;170:1445–1453. doi: 10.2353/ajpath.2007.070011. - DOI - PMC - PubMed

Publication types