. 2023 Jan 17;4(1):100893.
doi: 10.1016/j.xcrm.2022.100893. Epub 2022 Dec 29.

The Fc-effector function of COVID-19 convalescent plasma contributes to SARS-CoV-2 treatment efficacy in mice

Affiliations

The Fc-effector function of COVID-19 convalescent plasma contributes to SARS-CoV-2 treatment efficacy in mice

Irfan Ullah et al. Cell Rep Med. .

Abstract

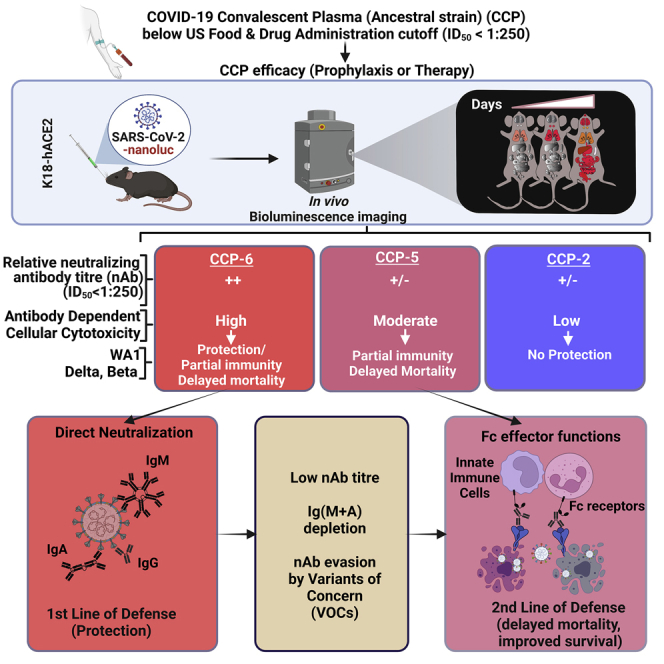
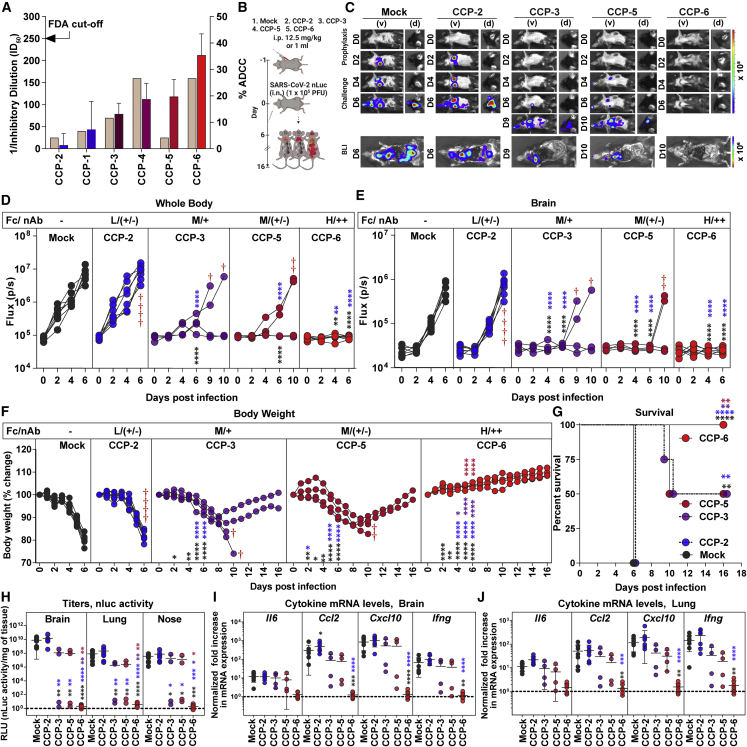
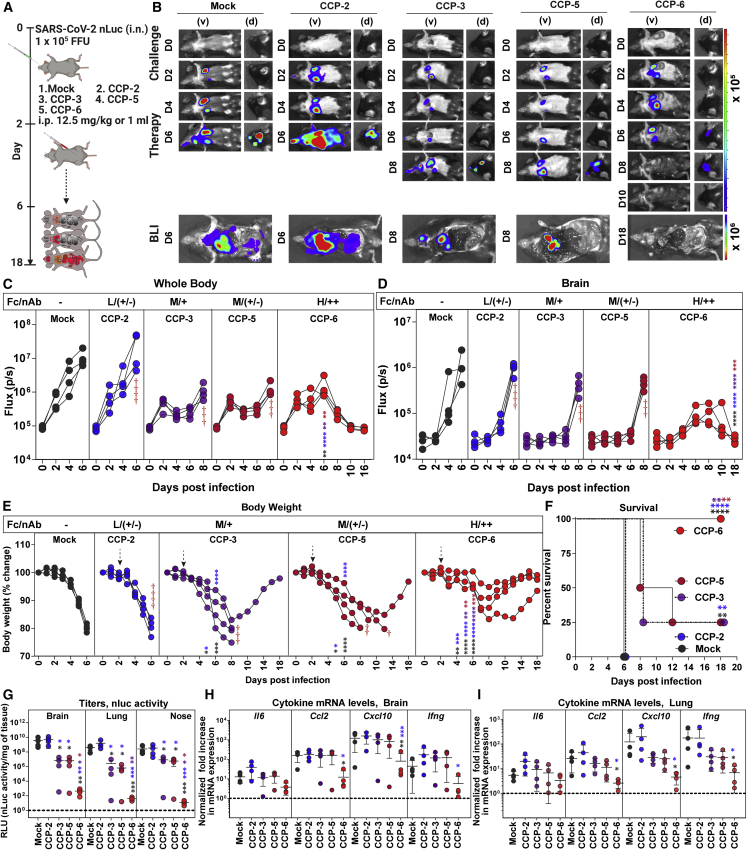
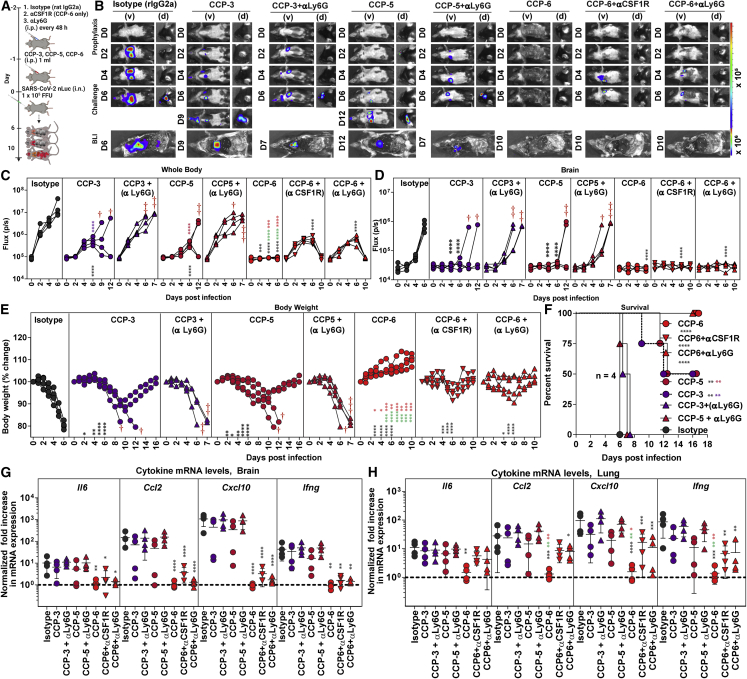
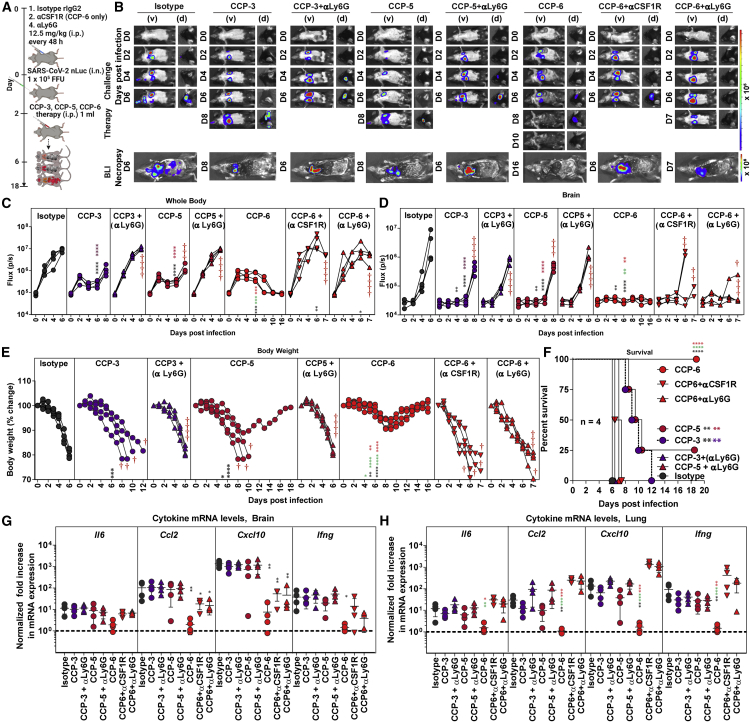
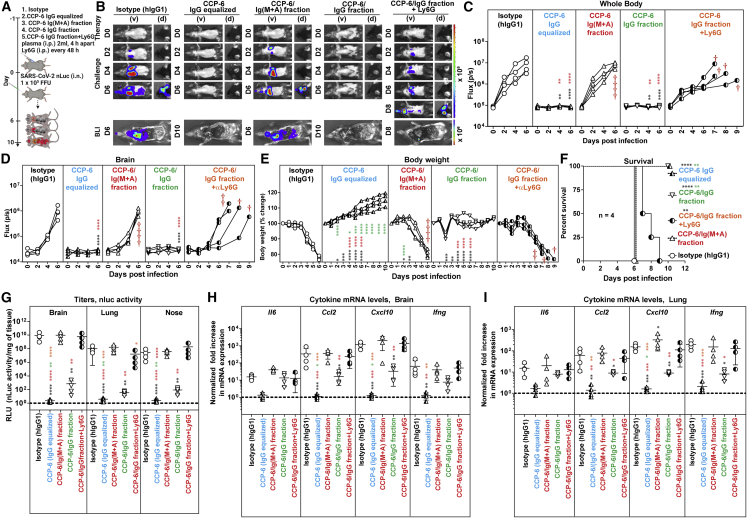
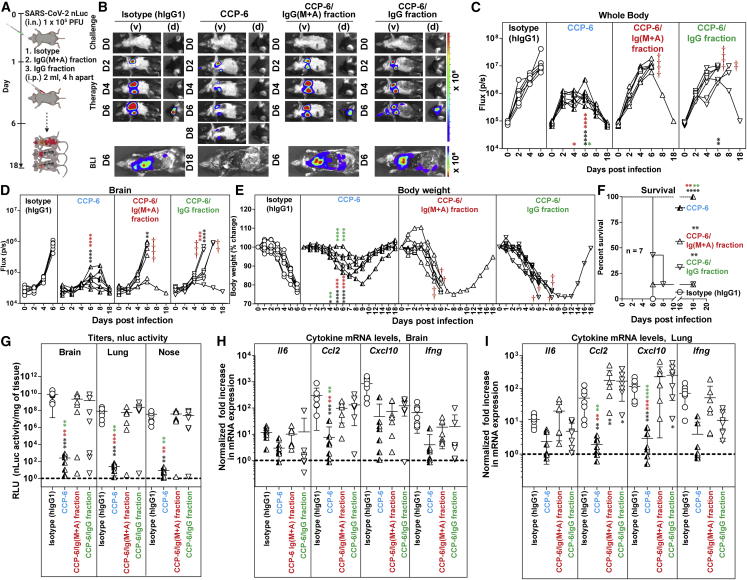
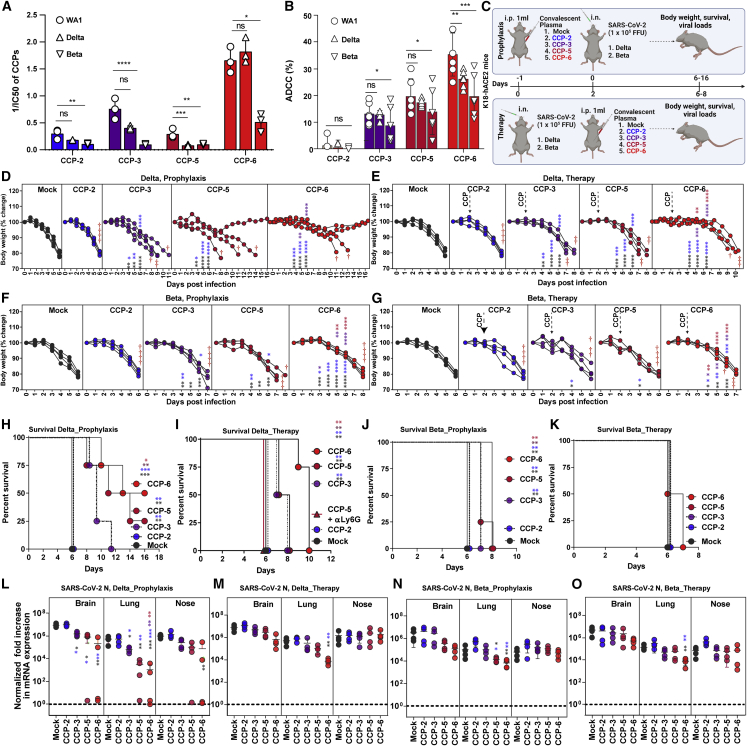
COVID-19 convalescent plasmas (CCPs) are chosen for plasma therapy based on neutralizing titers and anti-Spike immunoglobulin levels. However, CCP characteristics that promote SARS-CoV-2 control are complex and incompletely defined. Using an in vivo imaging approach, we demonstrate that CCPs with low neutralizing (ID50 ≤ 1:250), but moderate to high Fc-effector activity, in contrast to those with poor Fc function, delay mortality and/or improve survival of SARS-CoV-2-challenged K18-hACE2 mice. The impact of innate immune cells on CCP efficacy depended on their residual neutralizing activity. Fractionation of a selected CCP revealed that IgG and Ig(M + A) were required during therapy, but the IgG fraction alone sufficed during prophylaxis. Finally, despite reduced neutralization, ancestral SARS-CoV-2-elicited CCPs significantly delayed Delta and Beta-induced mortality suggesting that Fc-effector functions contribute to immunity against VOCs. Thus, Fc activity of CCPs provide a second line of defense when neutralization is compromised and can serve as an important criterion for CCP selection.

Keywords: ADCC; COVID-19; Fc-effector; IgA; IgG; IgM; SARS-CoV-2; convalescent plasma; macrophages; neutrophils.


Conflict of interest statement

Declaration of interests The authors declare no competing interests.

Figures

None
Graphical abstract
Figure 1
Figure 1
In vivo efficacies of selected CCPs in K18-hACE2 mice against lethal SARS-CoV-2 challenge during prophylaxis (A) WA1-neutralizing activity (left y axis) of indicated CCPs plotted as inverse of plasma inhibitory dilution (ID50) that reduces FFUs by 50% using Vero E6 cells as targets. The right y axis shows %ADCC (low to high color-coded in blue to red scale) in the presence of CCP using a 1:1 ratio of parental CEM.NKr cells and CEM.NKr.Spike cells as target cells while PBMCs from uninfected donors were used as effector cells. (B) Experimental design for screening in vivo efficacy of indicated CCPs delivered intraperitoneally (i.p.) under prophylaxis (−1 dpi) in K18-hACE2 mice intranasally (i.n.) challenged with 1 × 105 FFU WA1 SARS-CoV-2-nLuc. hIgG1-treated mice were used as control (Mock). (C) Representative BLI images of SARS-CoV-2-nLuc-infected mice in ventral (v) and dorsal (d) positions for an experiment as in (B). Scale bars denote radiance (photons/s/cm2/steradian). (D and E) Temporal quantification of nLuc signal as flux (photons/s) computed non-invasively in indicated tissues. (F) Temporal changes in mouse body weight with initial body weight set to 100%. Cross symbol, death. (G) Kaplan-Meier survival curves of mice (n = 4–7 per group) statistically compared by log-rank (Mantel-Cox) test. (H) Viral loads (nLuc activity/mg) in indicated tissue measured on Vero E6 cells as targets. Undetectable virus amounts were set to 1. (I and J) Fold change in indicated cytokine mRNA expression in brain and lung tissues. The data were normalized to Gapdh mRNA expression in the same sample and that in uninfected mice after necropsy. CCP classification for associated %ADCC (Fc) are shown as low (L), Moderate (M), and High (H). Relative nAb titer of CCPs (ID50 < 1:250) are shown as ++, +, and +/−. Each curve in (D–F) represents an individual mouse. Data in (D–J) are from two independent experiments and n = 2–4 mice per group. Grouped data in (D–F) and (H–J) were analyzed by 2-way ANOVA followed by Tukey’s multiple comparison tests. Statistical significance for group comparisons to mock controls are shown in black, with convalescent plasma CCP-2 are shown in blue, with CCP-3 are shown in purple, CCP-5 are shown light red. ∗p < 0.05; ∗∗p < 0.01; ∗∗∗p < 0.001; ∗∗∗∗p < 0.0001; Mean values ± SD are depicted. See also Figure S1
Figure 2
Figure 2
In vivo efficacies of selected CCPs in K18-hACE2 mice against lethal SARS-CoV-2 challenge during therapy (A) Experimental design for screening in vivo efficacy of indicated CCPs delivered under therapy (+2 dpi, i.p.) in K18-hACE2 mice challenged with 1 × 105 FFU WA1 SARS-CoV-2-nLuc (i.n.). hIgG1-treated mice were used as control (Mock). (B) Representative BLI images of SARS-CoV-2-nLuc-infected mice in ventral (v) and dorsal (d) positions for experiment as in (A). Scale bars denote radiance (photons/s/cm2/steradian). (C and D) Temporal quantification of nLuc signal as flux (photons/s) computed non-invasively in indicated tissues. (E) Temporal changes in mouse body weight with initial body weight set to 100% for experiment. Cross symbol, death. (F) Kaplan-Meier survival curves of mice (n = 4 per group) statistically compared by log-rank (Mantel-Cox) test. (G) Viral loads (nLuc activity/mg) in indicated tissue measured after necropsy on Vero E6 cells as targets. Undetectable virus amounts were set to 1. (H and I) Fold change in indicated cytokine mRNA expression in brain and lung tissues. The data were normalized to Gapdh mRNA expression in the same sample and that in non-infected mice after necropsy. CCP classification for associated %ADCC (Fc) are shown as low (L), Moderate (M), and High (H). Relative nAb titer of CCPs (ID50 < 1:250) are shown as ++, +, and +/−. Each curve in (C–E) represents an individual mouse. Data in (C–I) are from two independent experiments and n = 2 mice per group. Grouped data in (C–E) and (G–I) were analyzed by 2-way ANOVA followed by Tukey’s multiple comparison tests. Statistical significance for group comparisons to mock controls are shown in black, with convalescent plasma CCP-2 shown in blue, with CCP-3 shown in purple, and CCP-5 are shown in light red. ∗p < 0.05; ∗∗p < 0.01; ∗∗∗p < 0.001; ∗∗∗∗p < 0.0001; mean values ± SD are depicted. See also Figure S1
Figure 3
Figure 3
Innate immune cell depletion compromises CCP-mediated immunity against SARS-CoV-2 during prophylaxis in K18-hACE2 mice (A) Experimental design to test the contribution of macrophages (CD45+Ly6GLy6CCD11b+CD68+) and neutrophils CD45+CD11b+Ly6G+) in K18-hACE2 mice challenged with WA1 SARS-CoV-2-nLuc (1 × 105 FFU, i.n.) and treated prophylactically (i.p.; −1 dpi, 1 mL/20–25 g body weight) with indicated CCPs. αCSF1R or αLy6G mAbs (i.p., 20 mg/kg body weight) were used to deplete macrophages and neutrophils respectively every 48 h starting 2 days before infection. Human and rat isotype mAb-treated cohorts served as controls (Isotype). Animals were followed by BLI every 2 days as indicated. (B) Representative BLI images of SARS-CoV-2-nLuc-infected mice in ventral (v) and dorsal (d) positions. Scale bars denote radiance (photons/s/cm2/steradian). (C and D) Temporal quantification of nLuc signal as flux (photons/s) computed non-invasively. (E) Temporal changes in mouse body weight with initial body weight set to 100%. Cross symbol, death. (F) Kaplan-Meier survival curves of mice (n = 4 per group) statistically compared by log-rank (Mantel-Cox) test. (G and H) Fold change in cytokine mRNA expression in brain and lung tissues at the time of death after necropsy. The data were normalized to Gapdh mRNA expression in the same sample and that in uninfected mice after necropsy. Each curve in (C–E) and each data point in (G–H) represents an individual mouse. Data in (C–H) are from two independent experiments and n = 2 mouse per group. Grouped data in (C–E) and (G–H) were analyzed by 2-way ANOVA followed by Tukey’s multiple comparison tests. Statistical significance for group comparisons to isotype control are shown in black, with CCP-3 to CCP-3+αLy6G shown in purple, with CCP5 to CCP-5+αLy6G shown in light red, CCP-6+αCSF1R shown in green, and with CCP-6 αLy6G shown in red. ∗p < 0.05; ∗∗p < 0.01; ∗∗∗p < 0.001; ∗∗∗∗p < 0.0001; mean values ± SD are depicted. See also Figures S2 and S3
Figure 4
Figure 4
Innate immune cells are required to eliminate established SARS-CoV-2 infection during CCP therapy in K18-hACE2 mice (A) Experimental design to test the contribution of macrophages (CD45+CD11b+CD68+) and neutrophils (CD45+CD11b+Ly6G+) in K18-hACE2 mice therapeutically treated at 2 dpi with indicated CCPs (i.p., 1 mL/20–25 g body weight) after challenge with WA1 SARS-CoV-2-nLuc (i.n., 1 × 105 FFU). αCSF1R or αLy6G mAbs (i.p., 20 mg/kg body weight) were used to deplete macrophages and neutrophils, respectively, every 48 h starting at 0 dpi. Human and/or rat isotype mAb-treated cohorts served as controls (Isotype). The mice were followed by non-invasive BLI every 2 days from the start of infection. (B) Representative BLI images of SARS-CoV-2-nLuc-infected mice in ventral (v) and dorsal (d) positions. Scale bars denote radiance (photons/s/cm2/steradian). (C and D) Temporal quantification of nLuc signal as flux (photons/s) computed non-invasively. (E) Temporal changes in mouse body weight with starting weight set to 100%. Cross symbol, death. (F) Kaplan-Meier survival curves of mice (n = 4 per group) statistically compared by log-rank (Mantel-Cox) test for experiment as in (A). (G and H) Fold change in cytokine mRNA expression in brain and lung tissues after necropsy at the time of death. The data were normalized to Gapdh mRNA expression in the same sample and that in non-infected mice after necropsy. Each curve in (C–E) and each data point in (G–H) represents an individual mouse. Data in (C–H) are from two independent experiments and n = 2–3 mice per group. Grouped data in (C–E) and (G–H) were analyzed by 2-way ANOVA followed by Tukey’s multiple comparison tests. Statistical significance for group comparisons to isotype control are shown in black, with CCP-3 to CCP-3+αLy6G shown in purple, with CCP5 to CCP-5+αLy6G shown in light red, CCP-6+αCSF1R shown in green, and with CCP-6 αLy6G shown in red. ∗p < 0.05; ∗∗p < 0.01; ∗∗∗p < 0.001; ∗∗∗∗p < 0.0001; mean values ± SD are depicted. See also Figure S3
Figure 5
Figure 5
Polyclonal IgGs in CCP-6 predominantly contribute to protection during prophylaxis in SARS-CoV-2-infected K18-hACE2 mice (A) Experimental design to test in vivo efficacies of CCP-6, CCP-6/Ig(M + A), and CCP-6/IgG fraction (1 mL × 2 i.p. injections, 4 h apart) in SARS-CoV-2-nLuc infected K18-hACE2 mice (i.n., 1 × 105 FFU) under prophylaxis (−1 dpi). For CCP-6 treatment, plasma was diluted to equalize IgG content of IgG fractionated plasma. αLy6G mAb (i.p., 20 mg/kg body weight) was used to deplete neutrophils respectively every 48 h starting 2 days before infection. Mice treated with hIgG1 served as controls (Isotype). The mice were followed by non-invasive BLI every 2 days from the start of infection. (B) Representative BLI images of SARS-CoV-2-nLuc-infected mice in ventral (v) and dorsal (d) positions. Scale bars denote radiance (photons/s/cm2/steradian). (C and D) Temporal quantification of nLuc signal as flux (photons/s) computed non-invasively. (E) Temporal changes in mouse body weight with starting weight set to 100%. Cross symbol, death. (F) Kaplan-Meier survival curves of mice (n = 4 per group) statistically compared by log-rank (Mantel-Cox) test for experiment as in (A). (G) Viral loads (nLuc activity/mg) from indicated tissues using Vero E6 cells as targets. Undetectable virus amounts were set to 1. (H and I) Fold change in cytokine mRNA expression in brain and lung tissues. The data were normalized to Gapdh mRNA expression in the same sample and that in non-infected mice after necropsy. Viral loads (G) and inflammatory cytokine profile (H, I) were determined at the time of death at 6 dpi or 10 dpi for surviving mice after necropsy. Each curve in (C–E) and each data point in (G–I) represents an individual mouse. Data in (C–I) are from are from two independent experiments and n = 2 mice per group. Grouped data in (C–E), (G–I) were analyzed by 2-way ANOVA followed by Tukey’s multiple comparison tests. Statistical significance for group comparisons with isotype control are shown in black, with IgG equalized CCP-6 shown in cyan, with CCP-6/Ig(M + A) fraction shown in red, with CCP-6/IgG fraction shown in green, and with CCP-6/IgG fractionated under neutrophil depletion shown in orange. ∗p < 0.05; ∗∗p < 0.01; ∗∗∗p < 0.001; ∗∗∗∗p < 0.0001; mean values ± SD are depicted. See also Figures S4 and S5.
Figure 6
Figure 6
Antibody classes collaborate to achieve maximal in vivo protection during CCP-6 therapy in SARS-CoV-2-infected K18-hACE2 mice (A) Experimental design to test in vivo efficacies of CCP-6, CCP-6/Ig(M + A), CCP-6/IgG fraction (1 mL × 2 i.p. injections, 4 h apart) in SARS-CoV-2-nLuc infected mice K18-hACE2 mice (i.n., 1 × 105 FFU) under therapy (+2 dpi). For CCP-6 treatment, plasma was diluted to equalize IgG content of Ig(M + A)-depleted plasma. Mice treated with hIgG1 served as controls (Isotype). The mice were followed by non-invasive BLI every 2 days from the start of infection. (B) Representative BLI images of SARS-CoV-2-nLuc-infected mice in ventral (v) and dorsal (d) positions. Scale bars denote radiance (photons/s/cm2/steradian). (C and D) Temporal quantification of nLuc signal as flux (photons/s) computed non-invasively. (E) Temporal changes in mouse body weight with starting weight set to 100%. Cross symbol, death. (F) Kaplan-Meier survival curves of mice (n = 7 per group) statistically compared by log-rank (Mantel-Cox) test for experiment as in (A). (G) Viral loads (FFUs/mg) from indicated tissue using Vero E6 cells as targets. Undetectable virus amounts were set to 1. (H and I) Fold change in cytokine mRNA expression in brain and lung tissues. The data were normalized to Gapdh mRNA expression in the same sample and that in non-infected mice after necropsy. Viral loads (G) and inflammatory cytokine profile (H, I) were determined at the time of death for mice that succumbed to infection (F) and at 18 dpi for surviving mice. Each curve in (C–E) and each data point in (G–I) represents an individual mouse. Data in (C–I) are from two to three independent experiments n = 2–3 mouse per group. Grouped data in (C–E), (G–I) were analyzed by 2-way ANOVA followed by Tukey’s multiple comparison tests. Statistical significance for group comparisons to isotype control are shown in black, with IgG-equated CCP-6 shown in cyan, with CCP-6/Ig(M + A) fraction shown in red, and with CCP-6/IgG fraction shown in green. ∗p < 0.05; ∗∗p < 0.01; ∗∗∗p < 0.001; ∗∗∗∗p < 0.0001; mean values ± SD are depicted. See also Figure S6.
Figure 7
Figure 7
Fc-mediated cross-protective efficacy profiles of WA1-elicited CCPs against Delta and Beta VOCs in K18-hACE2 mice (A) A graph depicting WA1, Delta, and Beta-neutralizing activity of indicated CCPs expressed as 1/inhibitory concentration of plasma (IC50). IC50 was defined as the plasma amount (μL) that reduces FFUs by 50% using Vero E6 cells as targets. (B) A graph depicting %ADCC activities in the presence of CCP using a 1:1 ratio of parental CEM.NKr cells and CEM.NKr.Spike (WA1, Delta or Beta) cells as target cells, while PBMCs from uninfected donors were used as effector cells. (C) Experimental design for screening in vivo efficacy of indicated CCPs delivered 1 mL per 20–25 g body weight of mouse intraperitoneally (i.p.) under prophylaxis (−1dpi) and therapeutically (+2 dpi) in K18-hACE2 mice intranasally (i.n.) challenged with 1 × 105 FFU of B.1.617.2 (Delta VOC) or B.1.351 (Beta VOC). PBS-treated mice were used as control (Mock). (D–G) Temporal changes in mouse body weight with initial body weight set to 100% during CCP prophylaxis (−1 dpi) and therapy (+2 dpi) for experiment as in (C) in mice challenged with Delta and Beta VOC. Cross symbol, death. (H–K) Kaplan-Meier survival curves of mice (n = 4 per group) statistically compared by log-rank (Mantel-Cox) test. (L–O) Fold change in SARS-CoV-2 nucleocapsid (N gene) expression in indicated tissue at the time of death or 16 dpi for surviving mice during CCP prophylaxis and therapy for experiment shown in (C). The data were normalized to Gapdh mRNA expression in the same sample and that in non-infected mice after necropsy. Grouped data in (A and B) were analyzed by one-way ANOVA with Dunnett’s multiple comparisons test to determine if Delta and Beta VOC-neutralizing titers or %ADCC in CCPs differed significantly from WA1. Each curve in (D–G) and each data point in (M−P) represent an individual mouse. Data in these from two independent experiments and n = 2–3 mice per group. Grouped data in (D–G), (M−P) were analyzed by 2-way ANOVA followed by Tukey’s multiple comparison tests. Statistical significance for group comparisons to isotype control are shown in black, with CCP-2-treated cohorts shown as blue, with CCP-2-treated cohorts shown as purple, with CCP-5-treated cohorts shown as light red, and CCP-6-treated cohorts shown in red. ∗p < 0.05; ∗∗p < 0.01; ∗∗∗p < 0.001; ∗∗∗∗p < 0.0001; mean values ± SD are depicted.

Similar articles

Cited by

References

    1. Casadevall A., Scharff M.D. Return to the past: the case for antibody-based therapies in infectious diseases. Clin. Infect. Dis. 1995;21:150–161. doi: 10.1093/clinids/21.1.150. - DOI - PMC - PubMed
    1. Mair-Jenkins J., Saavedra-Campos M., Baillie J.K., Cleary P., Khaw F.M., Lim W.S., Makki S., Rooney K.D., Nguyen-Van-Tam J.S., Beck C.R., Convalescent Plasma Study Group The effectiveness of convalescent plasma and hyperimmune immunoglobulin for the treatment of severe acute respiratory infections of viral etiology: a systematic review and exploratory meta-analysis. J. Infect. Dis. 2015;211:80–90. doi: 10.1093/infdis/jiu396. - DOI - PMC - PubMed
    1. Luke T.C., Kilbane E.M., Jackson J.L., Hoffman S.L. Meta-analysis: convalescent blood products for Spanish influenza pneumonia: a future H5N1 treatment? Ann. Intern. Med. 2006;145:599–609. doi: 10.7326/0003-4819-145-8-200610170-00139. - DOI - PubMed
    1. Cao H., Shi Y. Convalescent plasma: possible therapy for novel coronavirus disease 2019. Transfusion. 2020;60:1078–1083. doi: 10.1111/trf.15797. - DOI - PMC - PubMed
    1. Beraud M., Goodhue Meyer E., Lozano M., Bah A., Vassallo R., Brown B.L. Lessons learned from the use of convalescent plasma for the treatment of COVID-19 and specific considerations for immunocompromised patients. Transfus. Apher. Sci. 2022;61:103355. doi: 10.1016/j.transci.2022.103355. - DOI - PMC - PubMed

Publication types

Substances