. 2023 Jan 17;4(1):100898.
doi: 10.1016/j.xcrm.2022.100898. Epub 2022 Dec 22.

Impact of SARS-CoV-2 exposure history on the T cell and IgG response

Affiliations

Impact of SARS-CoV-2 exposure history on the T cell and IgG response

Roanne Keeton et al. Cell Rep Med. .

Abstract

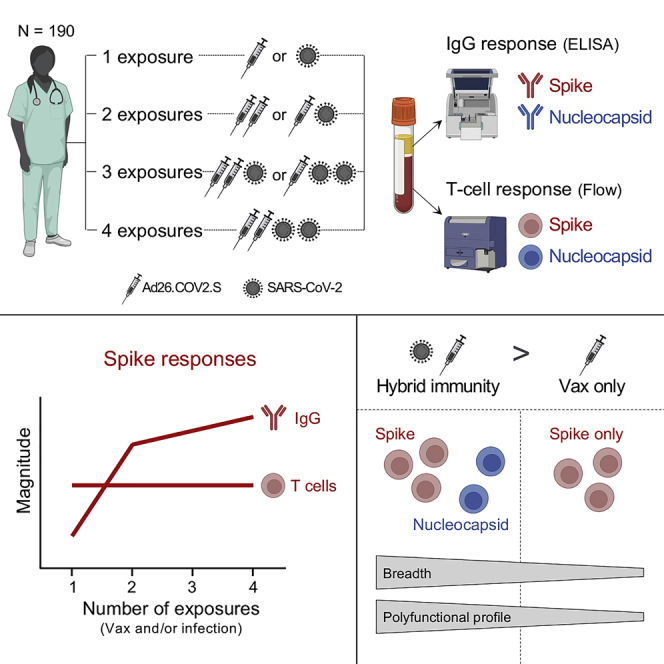
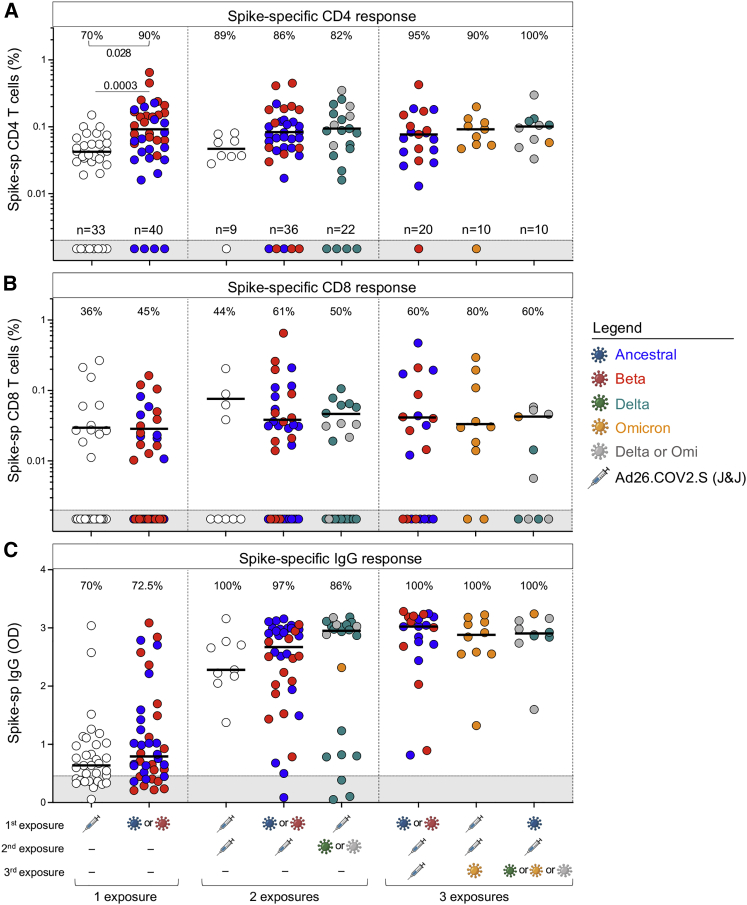
Multiple severe acute respiratory syndrome coronavirus 2 (SARS-CoV-2) exposures, from infection or vaccination, can potently boost spike antibody responses. Less is known about the impact of repeated exposures on T cell responses. Here, we compare the prevalence and frequency of peripheral SARS-CoV-2-specific T cell and immunoglobulin G (IgG) responses in 190 individuals with complex SARS-CoV-2 exposure histories. As expected, an increasing number of SARS-CoV-2 spike exposures significantly enhances the magnitude of IgG responses, while repeated exposures improve the number of T cell responders but have less impact on SARS-CoV-2 spike-specific T cell frequencies in the circulation. Moreover, we find that the number and nature of exposures (rather than the order of infection and vaccination) shape the spike immune response, with spike-specific CD4 T cells displaying a greater polyfunctional potential following hybrid immunity compared with vaccination only. Characterizing adaptive immunity from an evolving viral and immunological landscape may inform vaccine strategies to elicit optimal immunity as the pandemic progress.

Keywords: Ad26.COV2.S vaccine; COVID-19; IgG response; SARS-CoV-2; T cell response; hybrid immunity.


Conflict of interest statement

Declaration of interests A. Sette is a consultant for Gritstone Bio, Flow Pharma, Moderna, AstraZeneca, Qiagen, Avalia, Fortress, Gilead, Sanofi, Merck, RiverVest, MedaCorp, Turnstone, NA Vaccine Institute, Gerson Lehrman Group, and Guggenheim. La Jolla Institute for Immunology has filed for patent protection for various aspects of T cell epitope and vaccine design work.

Figures

None
Graphical abstract
Figure 1
Figure 1
Comparison of SARS-CoV-2-specific T cell and IgG responses upon repeated exposures to SARS-CoV-2 antigens (A) Clinical characteristics of participants grouped according to their number of exposures. The syringe symbol corresponds to an Ad26.COV2.S vaccination. The virus symbol depicts SARS-CoV-2 infection. (B) Frequencies of ancestral SARS-CoV-2 spike-specific CD4+ (blue) and CD8+ (red) T cell responses (cells producing IFN-γ, TNF-α, or IL-2) in individuals with an increasing number of exposures. (C) Profile of the ancestral spike-specific T cell response based on the number of SARS-CoV-2 antigen exposures. (D) SARS-CoV-2 spike-specific IgG measured by ELISA in individuals with an increasing number of exposures. (E) Frequencies of the SARS-CoV-2 nucleocapsid-specific CD4+ (blue) and CD8+ (red) T cell responses (e.g., cells producing IFN-γ, TNF-α, or IL-2) in individuals with an increasing number of COVID-19 episodes. Horizontal lines indicate median values of responders. (F) SARS-CoV-2 nucleocapsid-specific IgG measured by ELISA in individuals with an increasing number of COVID-19 episodes. The number of participants included in each analysis is indicated on the graphs. Pie charts depict the proportion of participants exhibiting a detectable T cell response (blue for CD4+ T cells and red for CD8+ T cells). Statistical analysis was conducted using the Kruskal-Wallis test with Dunn’s multiple comparison test for the different exposure or episode groups. The proportion of responders is depicted by the pies on top of each graph. Chi-squared test was used to compare percentage of responders. Horizontal lines indicate median values of responders. See also Figures S1 and S2.
Figure 2
Figure 2
Profile of the combined spike- and nucleocapsid-specific T cell response upon different infection and/or vaccination exposures (A) Comparison of the combined frequency of spike- and nucleocapsid-specific CD4 T cells between groups. (B) Comparison of the combined frequency of spike- and nucleocapsid-specific CD8 T cells between groups. The proportion of responders is indicated at top of each graph. A chi-squared test was used to compare percentage of responders and a Wilcoxon unpaired t test to compare frequencies. Horizontal lines indicate median values of responders. Each color represents a different exposure profile. (C) Proportion of spike (S) and/or nucleocapsid (N) CD4 and CD8 responders after a SARS-CoV-2 infection. The number of participants in each sub-group is indicated inside each pie chart. See also Figure S3.
Figure 3
Figure 3
Comparison of SARS-CoV-2 spike-specific T cell responses in individuals with a different order of exposures (A) Comparison of the frequency of ancestral spike-specific CD4+ T cell responses. (B) Comparison of the frequency of ancestral spike-specific CD8+ T cell responses. (C) Comparison of ancestral spike-specific IgG responses. The sequence of exposure (vaccination or infection) for each group is indicated below the graph. Each SARS-CoV-2-infecting variant is depicted with a different color (see legend). For individuals infected twice, the color of the circle represents the breakthrough infection variant. For those infected with an unknown variant, this was either Delta or Omicron. The number of participants included in each group is indicated on the graphs. The proportion of participants exhibiting a detectable T cell response is indicated on top of each graph. Horizontal lines indicate median values of responders. Statistical comparisons were performed using a Kruskal-Wallis test with Dunn’s multiple comparison test or the chi-squared test to compare the percentage of responders. See also Table S1.
Figure 4
Figure 4
Polyfunctional profiles of spike-specific CD4+ T cells after one or two antigen exposures (A) Comparison of the polyfunctional profile of spike-specific CD4+ T cells after a single vaccination (gray circles) or one episode of infection (orange circles). (B) Comparison of the polyfunctional profile of spike-specific CD4+ T cells after two exposures, namely two vaccinations (dark gray circles), infection followed by a single vaccination (blue circles), or single vaccination followed by infection (purple circles). The median proportion and IQR are shown. Each response pattern (i.e., any possible combination of IFN-γ, IL-2, or TNF-α expression) is color coded, and data are summarized in the pie charts. Statistical comparisons were performed using a permutation test for the pie charts and a Wilcoxon unpaired t test for each response pattern. The number of participants included in each graph is indicated on top of the pie charts.
Figure 5
Figure 5
Impact of breakthrough infection on the magnitude and cross-reactivity of SARS-CoV-2 spike T cell responses (A) Frequencies of ancestral spike CD4+ and CD8+ T cell responses pre- and post-breakthrough infection (BTI) infection. (B) Magnitude of ancestral SARS-CoV-2 spike-specific IgG measured by ELISA pre- and post-BTI infection. (C) Cross-reactivity of spike CD4+ and CD8+ T cell responses after a Delta (left panel) or Omicron (right panel) BTI. (D) Fold change in the frequency of CD4+ and CD8+ T cells between ancestral and Delta spike responses (teal circles) and ancestral and Omicron responses (orange circles). Bars represent median fold change of responders. Delta BTIs are depicted by teal circles, Omicron BTI by an orange circle, and unknown variants (Delta or Omicron) by gray circles. The number of participants included in each graph is indicated, and the median value is indicated at the top of the graph. No significant differences were observed between CD4 or CD8 fold change using a Wilcoxon unpaired t test. For (A)–(C), a two-tailed Wilcoxon signed-rank test was used to assess statistical differences between paired samples. See also Table S2 and Figure S4.

References

    1. Moss P. The T cell immune response against SARS-CoV-2. Nat. Immunol. 2022;23:186–193. doi: 10.1038/s41590-021-01122-w. - DOI - PubMed
    1. Kent S.J., Khoury D.S., Reynaldi A., Juno J.A., Wheatley A.K., Stadler E., John Wherry E., Triccas J., Sasson S.C., Cromer D., Davenport M.P. Disentangling the relative importance of T cell responses in COVID-19: leading actors or supporting cast? Nat. Rev. Immunol. 2022;22:387–397. doi: 10.1038/s41577-022-00716-1. - DOI - PMC - PubMed
    1. Viana R., Moyo S., Amoako D.G., Tegally H., Scheepers C., Althaus C.L., Anyaneji U.J., Bester P.A., Boni M.F., Chand M., et al. Rapid epidemic expansion of the SARS-CoV-2 Omicron variant in southern Africa. Nature. 2022;603:679–686. doi: 10.1038/s41586-022-04411-y. - DOI - PMC - PubMed
    1. Bekker L.G., Garrett N., Goga A., Fairall L., Reddy T., Yende-Zuma N., Kassanjee R., Collie S., Sanne I., Boulle A., et al. Effectiveness of the Ad26.COV2.S vaccine in health-care workers in South Africa (the Sisonke study): results from a single-arm, open-label, phase 3B, implementation study. Lancet. 2022;399:1141–1153. doi: 10.1016/S0140-6736(22)00007-1. - DOI - PMC - PubMed
    1. Walls A.C., Sprouse K.R., Bowen J.E., Joshi A., Franko N., Navarro M.J., Stewart C., Cameroni E., McCallum M., Goecker E.A., et al. SARS-CoV-2 breakthrough infections elicit potent, broad, and durable neutralizing antibody responses. Cell. 2022;185:872–880.e3. doi: 10.1016/j.cell.2022.01.011. - DOI - PMC - PubMed

Publication types

Substances