

Neural tracking of linguistic and acoustic speech representations decreases with advancing age
- PMID: 36584758
- PMCID: PMC9878439
- DOI: 10.1016/j.neuroimage.2022.119841
Neural tracking of linguistic and acoustic speech representations decreases with advancing age
Abstract
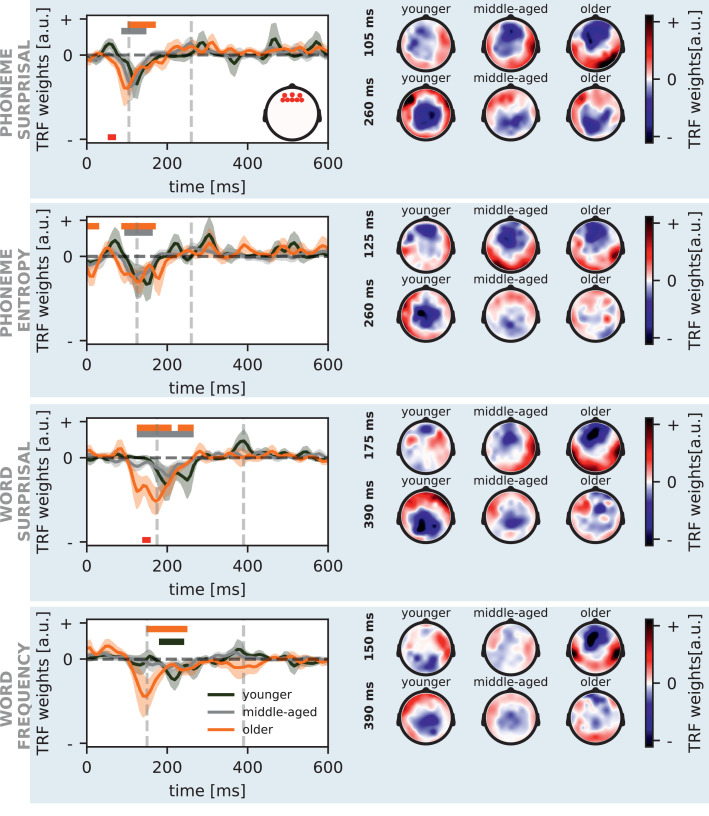
Background: Older adults process speech differently, but it is not yet clear how aging affects different levels of processing natural, continuous speech, both in terms of bottom-up acoustic analysis and top-down generation of linguistic-based predictions. We studied natural speech processing across the adult lifespan via electroencephalography (EEG) measurements of neural tracking.
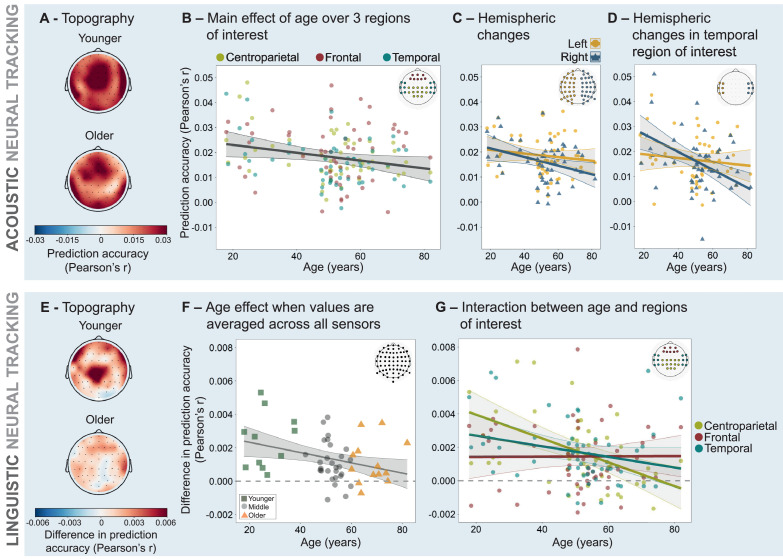
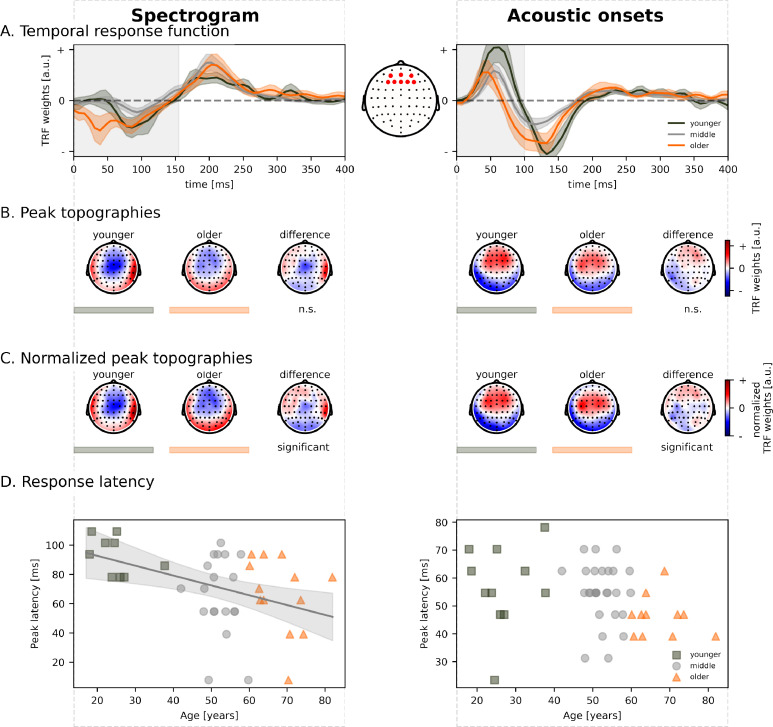
Goals: Our goals are to analyze the unique contribution of linguistic speech processing across the adult lifespan using natural speech, while controlling for the influence of acoustic processing. Moreover, we also studied acoustic processing across age. In particular, we focus on changes in spatial and temporal activation patterns in response to natural speech across the lifespan.
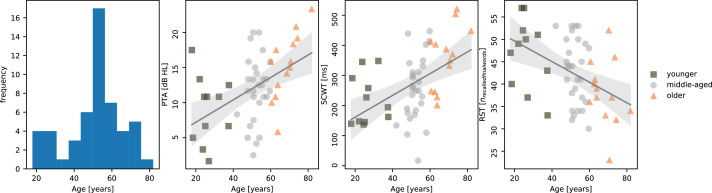
Methods: 52 normal-hearing adults between 17 and 82 years of age listened to a naturally spoken story while the EEG signal was recorded. We investigated the effect of age on acoustic and linguistic processing of speech. Because age correlated with hearing capacity and measures of cognition, we investigated whether the observed age effect is mediated by these factors. Furthermore, we investigated whether there is an effect of age on hemisphere lateralization and on spatiotemporal patterns of the neural responses.
Results: Our EEG results showed that linguistic speech processing declines with advancing age. Moreover, as age increased, the neural response latency to certain aspects of linguistic speech processing increased. Also acoustic neural tracking (NT) decreased with increasing age, which is at odds with the literature. In contrast to linguistic processing, older subjects showed shorter latencies for early acoustic responses to speech. No evidence was found for hemispheric lateralization in neither younger nor older adults during linguistic speech processing. Most of the observed aging effects on acoustic and linguistic processing were not explained by age-related decline in hearing capacity or cognition. However, our results suggest that the effect of decreasing linguistic neural tracking with advancing age at word-level is also partially due to an age-related decline in cognition than a robust effect of age.
Conclusion: Spatial and temporal characteristics of the neural responses to continuous speech change across the adult lifespan for both acoustic and linguistic speech processing. These changes may be traces of structural and/or functional change that occurs with advancing age.
Keywords: Aging; Lifespan; Linguistic processing; Neural tracking; Speech processing; Speech understanding.
Copyright © 2022. Published by Elsevier Inc.
Conflict of interest statement
Declaration of Competing Interest No conflicts of interest, financial or otherwise, are declared by the authors.
Figures
Similar articles
-
Neural Markers of Speech Comprehension: Measuring EEG Tracking of Linguistic Speech Representations, Controlling the Speech Acoustics.J Neurosci. 2021 Dec 15;41(50):10316-10329. doi: 10.1523/JNEUROSCI.0812-21.2021. Epub 2021 Nov 3. J Neurosci. 2021. PMID: 34732519 Free PMC article.
-
Neural encoding of linguistic speech cues is unaffected by cognitive decline, but decreases with increasing hearing impairment.Sci Rep. 2024 Aug 17;14(1):19105. doi: 10.1038/s41598-024-69602-1. Sci Rep. 2024. PMID: 39154048 Free PMC article.
-
A tradeoff between acoustic and linguistic feature encoding in spoken language comprehension.Elife. 2023 Jul 7;12:e82386. doi: 10.7554/eLife.82386. Elife. 2023. PMID: 37417736 Free PMC article.
-
Affective and linguistic processing of speech prosody: DC potential studies.Prog Brain Res. 2006;156:269-84. doi: 10.1016/S0079-6123(06)56014-5. Prog Brain Res. 2006. PMID: 17015085 Review.
-
Neural tracking as a diagnostic tool to assess the auditory pathway.Hear Res. 2022 Dec;426:108607. doi: 10.1016/j.heares.2022.108607. Epub 2022 Sep 14. Hear Res. 2022. PMID: 36137861 Review.
Cited by
-
Validation of cost-efficient EEG experimental setup for neural tracking in an auditory attention task.Sci Rep. 2023 Dec 19;13(1):22682. doi: 10.1038/s41598-023-49990-6. Sci Rep. 2023. PMID: 38114579 Free PMC article.
-
Neural tracking of natural speech: an effective marker for post-stroke aphasia.Brain Commun. 2025 Mar 10;7(2):fcaf095. doi: 10.1093/braincomms/fcaf095. eCollection 2025. Brain Commun. 2025. PMID: 40066108 Free PMC article.
-
Speech Reception Threshold Estimation via EEG-Based Continuous Speech Envelope Reconstruction.Eur J Neurosci. 2025 Mar;61(6):e70083. doi: 10.1111/ejn.70083. Eur J Neurosci. 2025. PMID: 40145625 Free PMC article.
-
Effects of linguistic context and noise type on speech comprehension.Front Psychol. 2024 Feb 5;15:1345619. doi: 10.3389/fpsyg.2024.1345619. eCollection 2024. Front Psychol. 2024. PMID: 38375107 Free PMC article.
-
Neural encoding of linguistic features during natural sentence reading.iScience. 2025 May 30;28(7):112798. doi: 10.1016/j.isci.2025.112798. eCollection 2025 Jul 18. iScience. 2025. PMID: 40585353 Free PMC article.
References
-
- Alday P.M. M/EEG analysis of naturalistic stories: a review from speech to language processing. Lang. Cogn. Neurosci. 2019;34(4):457–473.
-
- Aydelott J., Dick F., Mills D.L. Effects of acoustic distortion and semantic context on event-related potentials to spoken words. Psychophysiology. 2006;43(5):454–464. - PubMed
-
- Barton, K., 2022. Multi-model inference. R package version 1.46.0.
-
- Bates D., Mächler M., Bolker B., Walker S. Fitting linear mixed-effects models using lme4. J. Stat. Softw. 2015;67(1):1–48.
-
- Benjamini Y., Hochberg Y. Controlling the false discovery rate: a practical and powerful approach to multiple testing. J. R. Stat. Soc. 1995;57(1):289–300.
Publication types
MeSH terms
LinkOut - more resources
Full Text Sources
Research Materials
