. 2023;15(4):931-947.
doi: 10.1016/j.jcmgh.2022.12.012. Epub 2022 Dec 28.

Glycolytic Regulation of Intestinal Stem Cell Self-Renewal and Differentiation

Affiliations

Glycolytic Regulation of Intestinal Stem Cell Self-Renewal and Differentiation

Chang Li et al. Cell Mol Gastroenterol Hepatol. 2023.

Abstract

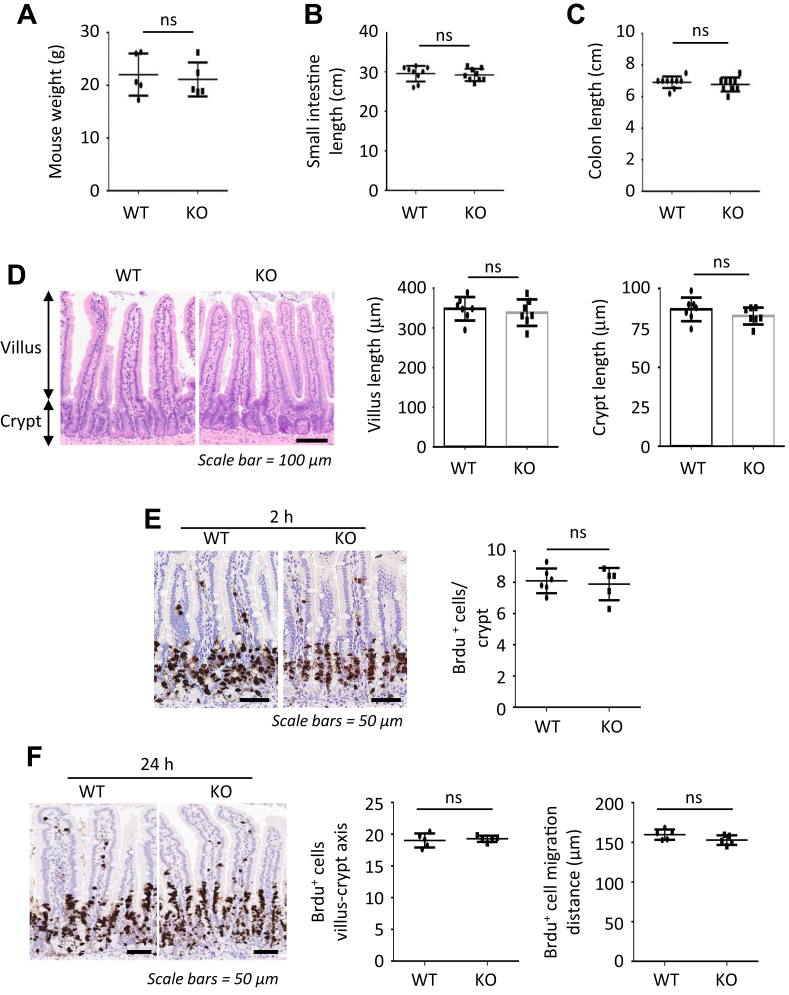
Background and aims: The intestinal mucosa undergoes a continual process of proliferation, differentiation, and apoptosis. An imbalance in this highly regimented process within the intestinal crypts is associated with several intestinal pathologies. Although metabolic changes are known to play a pivotal role in cell proliferation and differentiation, how glycolysis contributes to intestinal epithelial homeostasis remains to be defined.

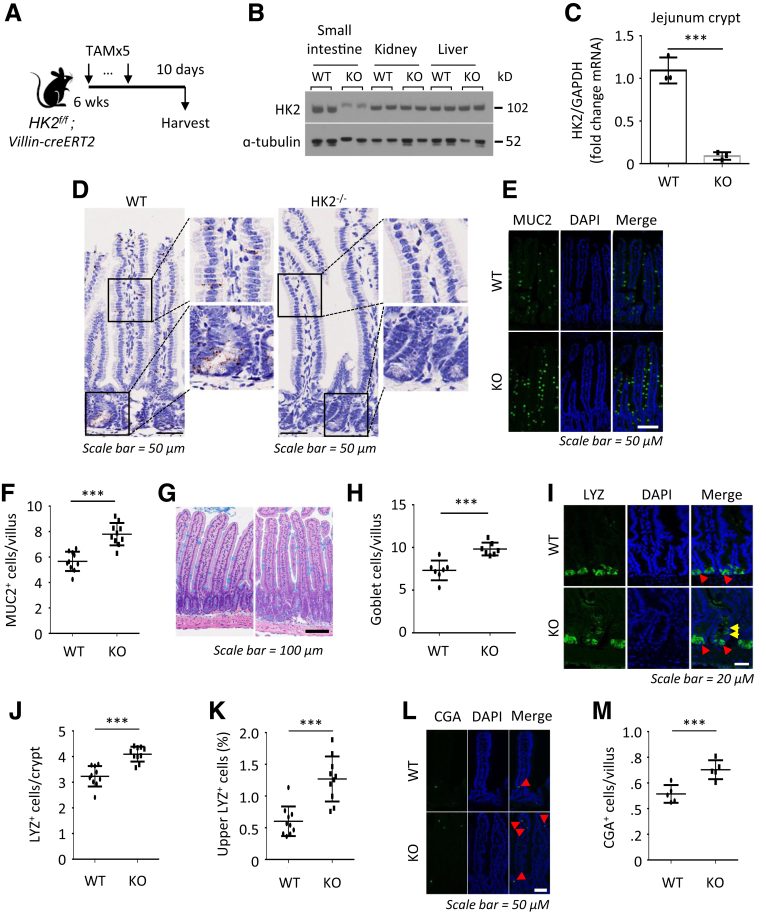
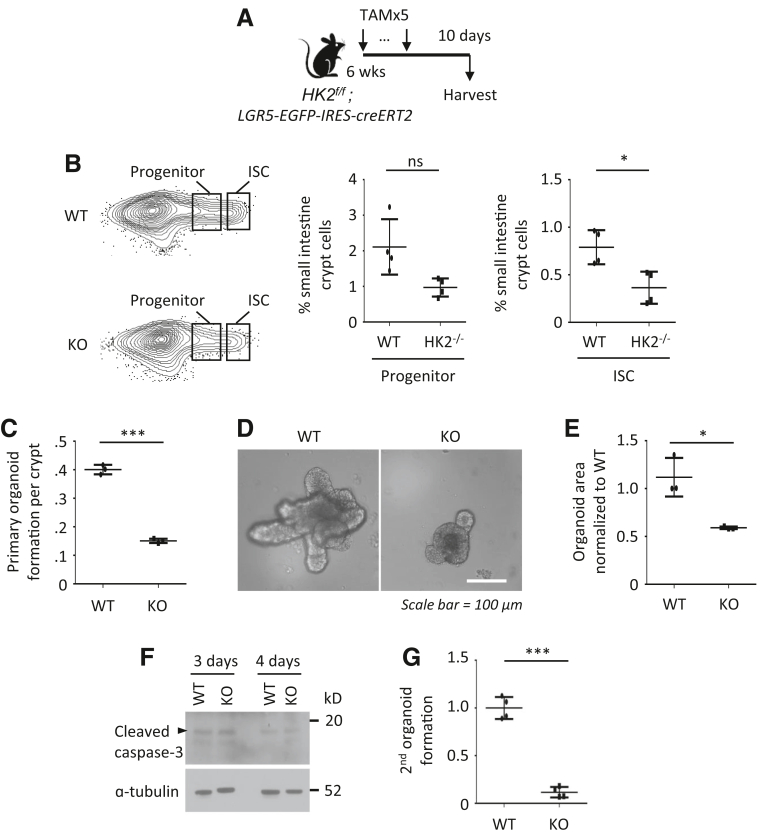
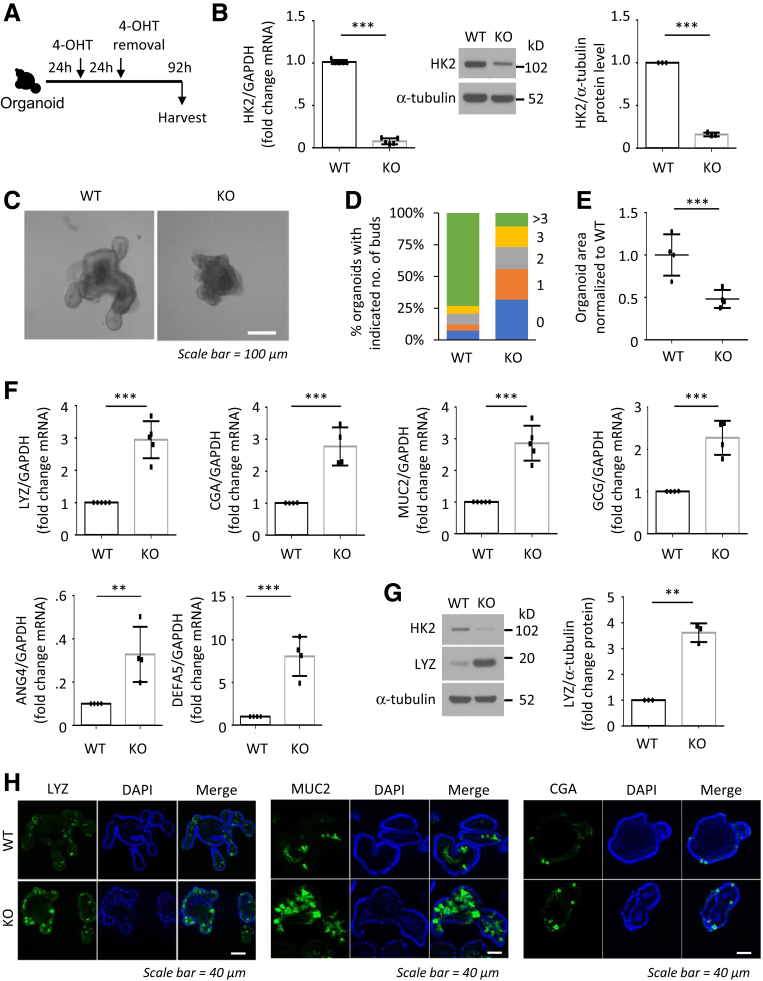
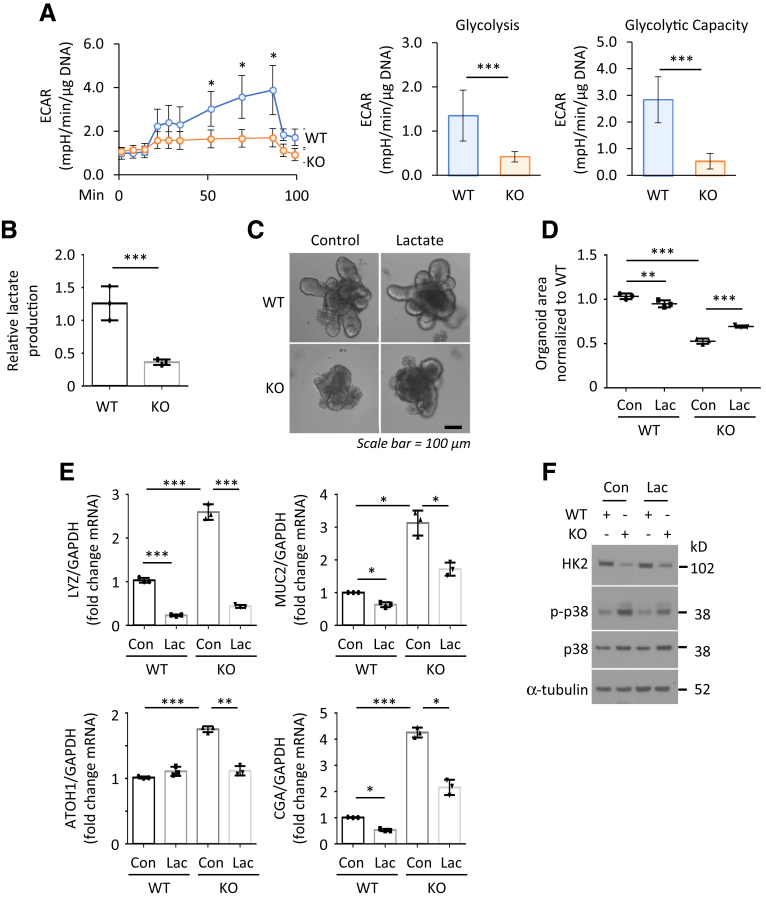
Methods: Small intestines were harvested from mice with specific hexokinase 2 (HK2) deletion in the intestinal epithelium or LGR5+ stem cells. Glycolysis was measured using the Seahorse XFe96 analyzer. Expression of phospho-p38 mitogen-activated protein kinase, the transcription factor atonal homolog 1, and intestinal cell differentiation markers lysozyme, mucin 2, and chromogranin A were determined by Western blot, quantitative real-time reverse transcription polymerase chain reaction, or immunofluorescence, and immunohistochemistry staining.

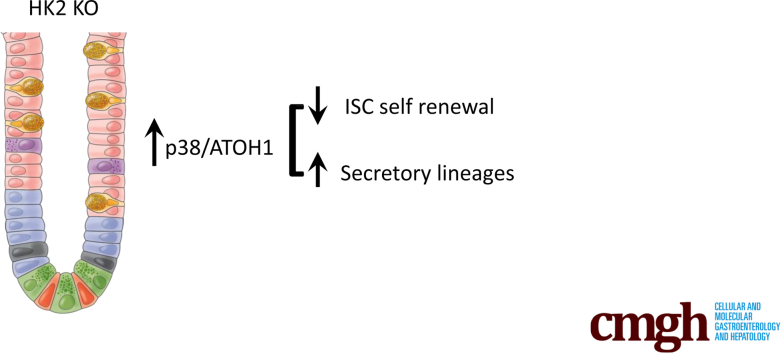
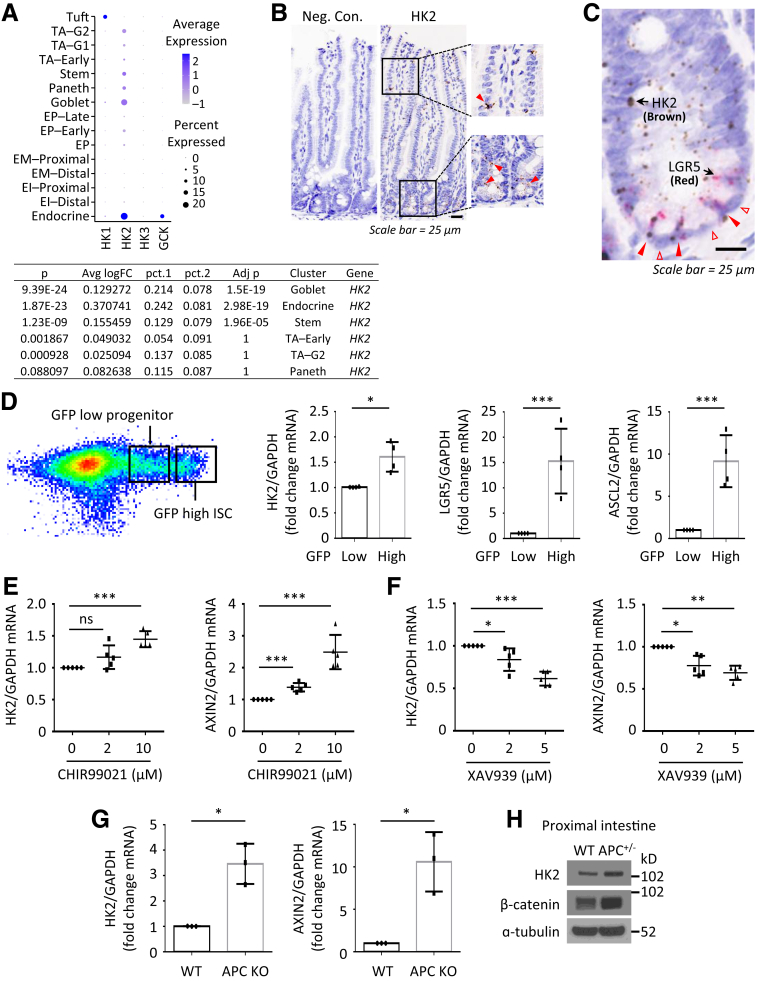
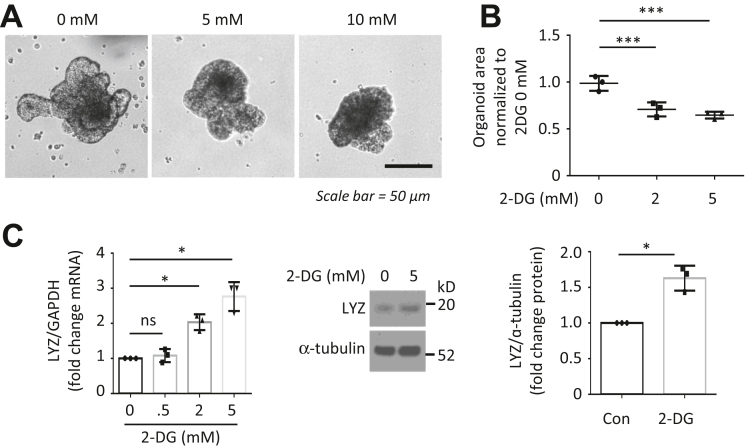
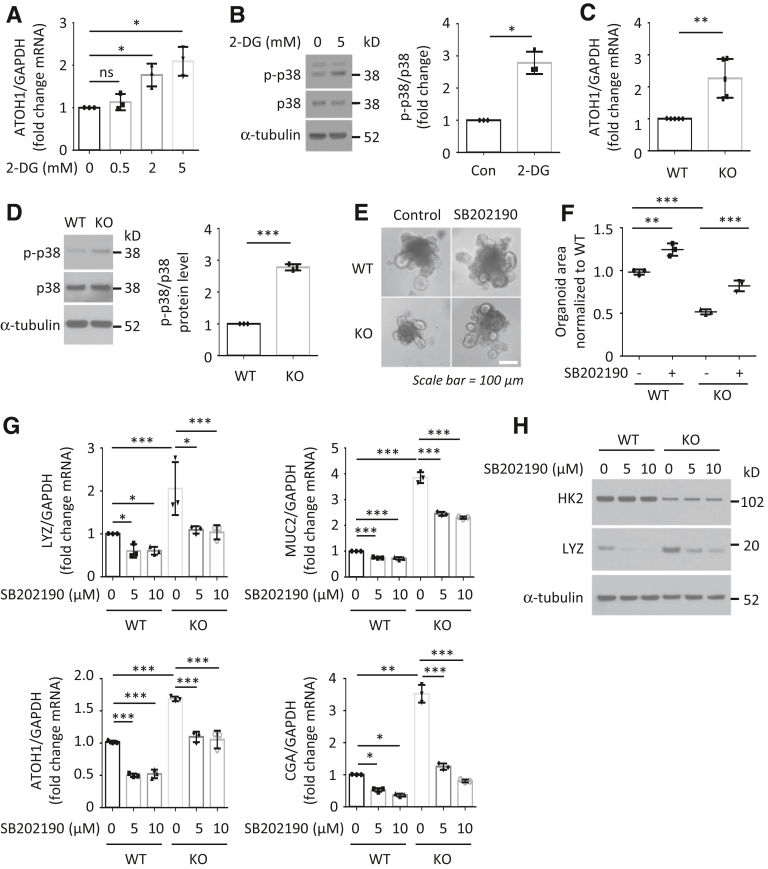
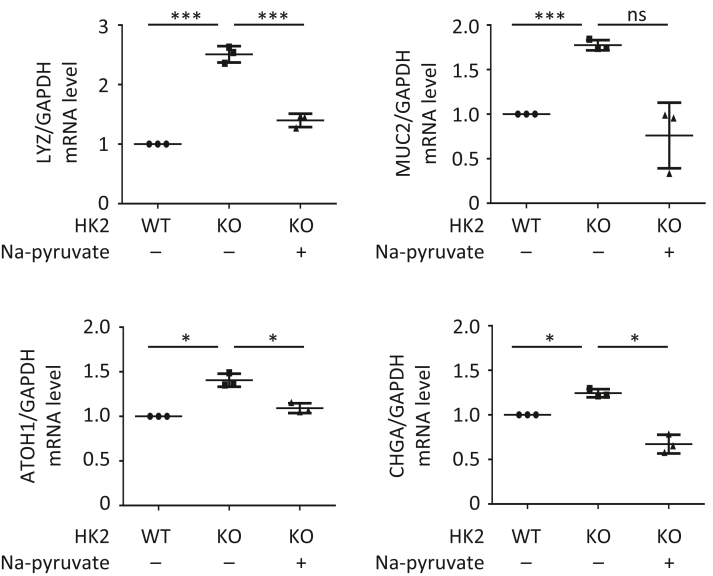
Results: HK2 is a target gene of Wnt signaling in intestinal epithelium. HK2 knockout or inhibition of glycolysis resulted in increased numbers of Paneth, goblet, and enteroendocrine cells and decreased intestinal stem cell self-renewal. Mechanistically, HK2 knockout resulted in activation of p38 mitogen-activated protein kinase and increased expression of ATOH1; inhibition of p38 mitogen-activated protein kinase signaling attenuated the phenotypes induced by HK2 knockout in intestinal organoids. HK2 knockout significantly decreased glycolysis and lactate production in intestinal organoids; supplementation of lactate or pyruvate reversed the phenotypes induced by HK2 knockout.

Conclusions: Our results show that HK2 regulates intestinal stem cell self-renewal and differentiation through p38 mitogen-activated protein kinase/atonal homolog 1 signaling pathway. Our findings demonstrate an essential role for glycolysis in maintenance of intestinal stem cell function.

Keywords: Glycolysis; HK2; Intestinal Stem Cells; Metabolism.


Figures

None
Graphical abstract
Figure 1
Figure 1
HK2 is a target gene of Wnt signaling in intestinal cells. (A) Expression of HKs was analyzed by scRNA sequencing. “pct.1” is the percentage of HK2 expressing cells in the selected cell type (eg, Goblet). The “pct.2” is the percentage of HK2 expressing cells in the rest of cells (eg, all non-Goblet cells). EI, enterocyte immature; EM, enterocyte mature; EP, enterocyte progenitor. TA, transit amplifying; G1, G1/S cell-cycle phase; G2, G2/M cell-cycle phase. ( B) RNAscope brown staining of HK2 in intestinal crypts from WT mice. (C) HK2 is mainly expressed in LGR5-positive cells but not in Paneth cells. RNA scope duplex staining of HK2 (brown) with LGR5 (red) in WT jejunum crypts. (D) HK2 is more highly expressed in GFPhigh cells. Small intestine crypts from the LGR5-EGFP-IRES-creERT2 mice were harvested and digested with Typsin LE for 30 minutes to obtain single cells. GFPhigh and GFPlow cells were isolated by fluorescence-activated cell sorting. Expression of ASCl2, LGR5, and HK2 was determined by qPCR. Data represent mean ± SD (n = 4 mice). (E and F) Small intestinal crypts from jejunum of WT mice were harvested and seeded in 24-well plates. Organoids were treated with either vehicle control (DMSO) or Wnt agonist CHIR99021 (D) or Wnt antagonist XAV939 (E) for 3 days. Total RNA was extracted and expression of HK2 and AXIN2 was analyzed by qPCR (n = 5 mice). (G) Small intestinal crypts from APCf/f and APCf/f; Villin-creERT2 mice were harvested and seeded into 24-well plates and cultured for 24 hours followed by treatment with 4-OHT (1 mM) for 24 hours to induce knockout of APC expression. Four days after removing 4-OHT, total RNA was extracted and expression of HK2 and AXIN2 was determined by qPCR (n = 3 mice). (H) Western blotting analysis of protein expression in WT and APCf/+; Villin-cre mice. Intestinal mucosa from 3-month-old mice was collected for analysis. ∗P < .05; ∗∗P < .01; ∗∗∗P < .005.
Figure 2
Figure 2
HK2 loss increases differentiation of secretory cells. (A) Schematic of HK2f/f; Villin-creERT2 mouse model, including the timeline of TAM injection and tissue collection. (B) Western blotting analysis of HK2 expression in small intestine mucosa, kidney, and liver tissues from WT and HK2 KO mice. (C) Expression of HK2 in WT and HK2 KO jejunum crypts was determined by qPCR (n = 3 mice). (D) The expression of HK2 in WT and HK2 KO mice was analyzed by ISH. (E) IF staining of jejunum from WT and HK2 KO mice with DAPI and MUC2. (F) Quantification of MUC2+ goblet cells in villus (n = 10 mice; at least 20 villi were counted from each mouse). (G) AB staining of jejunum of WT and HK2 KO mice. (H) Quantification of AB+ goblet cell in villi (at least 20 villi counted per mouse; n = 7 mice). (I) IF staining of jejunum from WT and HK2 KO mice with DAPI and LYZ. (J) Quantification of LYZ+ Paneth cells in crypt (n = 10 mice; at least 20 crypts were counted from each mouse). (K) Quantification of number of LYZ+ cells in the upper crypts based on LYZ IF staining (n = 10 mice; at least 20 crypts were counted from each mouse). (L) IF staining of jejunum from WT and HK2 KO mice with DAPI and CGA. (M) Quantification of CGA+ EE cell in crypts (n = 5 mice; at least 20 villi were counted from each mouse). ∗∗∗P < .005.
Figure 3
Figure 3
Effects of HK2 loss on the intestinal architecture. (A) Body weight from WT and HK2 KO mice (n = 5 mice). (B) The length of small intestine was determined in WT and HK2 KO mice (n = 9 mice). (C) The length of colon was determined in WT and HK2 KO mice (n = 9 mice). (D) Hematoxylin-eosin staining of jejunum slices from WT and HK2 KO mice; the length of the villi and crypts was analyzed (at least 20 villi or crypts measured per mouse; n = 7 mice). (E and F) BrdU staining of jejunum of WT and HK2 KO mice and quantification of BrdU+ cell in villi and villius-crypt axis (at least 20 crypts or villius-crypt axis counted per mouse; n = 56 mice), 2 (E) or 24 (F) hours after BrdU administration.
Figure 4
Figure 4
Loss of HK2 represses intestinal stemness. (A) Schematic of the mouse model, including the timeline of TAM injection and tissue collection. (B) Frequency of EpCAM+/PI-/Lgr5-GFPhigh ISCs and Lgr5-GFPlow progenitors in crypt cells from WT and HK2 KO mice by flow cytometry (n = 4 mice). (C–E) WT and HK2f/f; Villin-creERT2 mice were injected with 5 dosages of TAM, and small intestine crypts were collected. Organoid-forming assay is shown in C (n = 3 mice). The picture of organoids from WT and HK2 KO mice is shown in D. Quantification of the organoid area from WT and HK2 KO mice is shown in E (at least 30 organoids were measured per mouse; n = 3 mice per group). (F) The crypts from HK2f/f and HK2f/f; Villin-creERT2 mice were treated with 4-OHT for 24 hours to induce KO of HK2. Organoids were harvested 3 or 4 days after removal of 4-OHT, and cleaved caspase-3 was determined by Western blot. (G) HK2 KO decreases the secondary colony formation. The number of organoids per well (n = 4) were counted and expressed as a fold change compared with WT. ∗P < .05; ∗∗∗P < .005.
Figure 5
Figure 5
HK2 deficiency promotes secretory cell differentiation in organoids. (A) Schematic of the organoid model, including the timeline of 4-OHT treatment and organoid collection. (B) HK2 expression was determined by qPCR (n = 5 mice) and Western blot (n = 3 mice). (C) Representative image of WT and HK2 KO organoids. (D) Quantification of the budding number of WT and HK2 KO organoids (at least 30 organoids were measured per mouse). One representative result from 3 biologic independent experiments is shown. (E) Organoid size derived from indicated genotypes was quantified (at least 30 organoids were measured per mouse; n = 4 mice). (F) qPCR analysis for MUC2, LYZ, ANG4, and DEFA5, CGA and GCG in organoids from indicated genotypes (n = 4–5 mice). (G) LYZ protein expression in WT and HK2 KO organoids determined by Western blot. LYZ signals from 3 mice were quantitated densitometrically and expressed as fold change with respect to α-tubulin. (H) IF staining of LYZ (left), MUC2 (middle), and CGA (right) in WT and HK2 KO organoids. ∗∗P < .01; ∗∗∗P < .005.
Figure 6
Figure 6
Treatment with glycolysis inhibitor 2-DG repressed organoid growth. Small intestinal organoids from WT mice were treated with 2-DG for 3 days. (A) Morphology of organoids. (B) Quantification of the organoid size from control and 2-DG treatment (at least 30 organoids were measured per mouse; n = 3 mice). (C) The expression of LYZ mRNA was detected by qPCR and Western blot (n = 3 mice). ∗P < .05; ∗∗∗P < .005.
Figure 7
Figure 7
HK2 regulates ISC self-renewal and differentiation through the regulation of p38 MAPK/ATOH1 pathway. (A and B) Small intestine organoids from WT mice were treated with 2-DG for 3 days. Treatment with 2-DG increased ATOH1 mRNA expression (A) and p38 phosphorylation (B). Phosphorylated p38 MAPK expression from 3 separate experiments was quantitated densitometrically and expressed as fold change with respect to total p38 MAPK. (C and D) Crypts from HK2f/f and HK2f/f; Villin-creERT2 mice were treated with 4-OHT for 24 hours to induce KO of HK2. HK2 KO increased the expression of ATOH1 in organoids as noted in C (n = 5 mice). HK2 KO increased p38 phosphorylation in intestinal organoids as shown in D. Phosphorylated p38 MAPK signals from HK2 WT (n = 3 mice) and HK2 KO (n = 3 mice) were quantitated densitometrically and expressed as fold change with respect to total p38 MAPK. (E–H) Crypts from HK2f/f and HK2f/f; Villin-creERT2 mice were treated with 4-OHT for 24 hours to induce KO of HK2; the p38 inhibitor SB202190 was added together with 4-OHT for 24 hours and alone for an additional 4 days. Inhibition of p38 MAPK attenuated the decrease in organoid size on HK2 KO as noted in E. Quantification of the size of organoids derived from indicated genotypes is shown in F (at least 30 organoids per mouse were measured; n = 3 mice). Inhibition of the p38 pathway attenuated the increased expression of secretory markers in HK2 KO organoids as shown in G (n = 3 mice). Inhibition of the p38 pathway attenuated the increased LYZ protein expression in HK2 KO organoids as shown in H. ∗P < .05; ∗∗P < .01; ∗∗∗P < .005.
Figure 8
Figure 8
Lactate reverses the phenotypes induced by HK2 KO. (A) Seahorse analysis of intestinal WT and HK2 KO organoids (n = 4 wells). One representative result from 3 biologic independent experiments is shown. (B) The crypts from HK2f/f and HK2f/f; Villin-creERT2 mice were incubated, and organoids were treated with 4-OHT for 24 hours to induce KO of HK2. Three days after 4-OHT treatment, culture media was collected, and lactate in the media was measured and results normalized by total DNA amount (n = 3 mice). (C–F) The crypts from HK2f/f and HK2f/f; Villin-creERT2 mice were cultured and crypt organoids treated with 4-OHT for 24 hours to induce KO of HK2. Lactate (10 mM) was added to the medium together with 4-OHT for 24 hours and continuous treatment for an additional 4 days. Supplementation of lactate attenuated the decrease in organoid size induced by HK2 KO as shown in C. Quantification of the size of organoids derived from indicated genotypes is shown in D (at least 30 organoids were measured per mouse; n = 3 mice). Supplementation of lactate attenuated the increased expression of secretory markers in HK2 KO organoids as shown in E (n = 3 mice). Supplementation of lactate attenuated activation of p38 MAPK associated with HK2 KO as noted in the Western blot shown in F. ∗P < .05; ∗∗P < .01; ∗∗∗P < .001.
Figure 9
Figure 9
Pyruvate reverses the increase of secretory cell differentiation induced by HK2 KO. The crypts from HK2f/f and HK2f/f; Villin-creERT2 mice were cultured and crypt organoids treated with 4-OHT for 24 hours to induce KO of HK2. Sodium pyruvate (10 mM) was added to the medium together with 4-OHT for 24 hours and continuous treatment for an additional 4 days. qPCR analysis for MUC2, LYZ, CGA, and ATOH1 mRNA expression in organoids from indicated genotypes (n = 3 mice). ∗P< .05; ∗∗∗P < .005.

References

    1. Santos A.J.M., Lo Y.H., Mah A.T., et al. The intestinal stem cell niche: homeostasis and adaptations. Trends Cell Biol. 2018;28:1062–1078. - PMC - PubMed
    1. Yeung T.M., Chia L.A., Kosinski C.M., et al. Regulation of self-renewal and differentiation by the intestinal stem cell niche. Cell Mol Life Sci. 2011;68:2513–2523. - PMC - PubMed
    1. Gersemann M., Wehkamp J., Stange E.F. Innate immune dysfunction in inflammatory bowel disease. J Intern Med. 2012;271:421–428. - PubMed
    1. Hammoud S.S., Cairns B.R., Jones D.A. Epigenetic regulation of colon cancer and intestinal stem cells. Curr Opin Cell Biol. 2013;25:177–183. - PMC - PubMed
    1. Shyh-Chang N., Daley G.Q., Cantley L.C. Stem cell metabolism in tissue development and aging. Development. 2013;140:2535–2547. - PMC - PubMed

Publication types

Substances