. 2023 Jan:43:187-203.
doi: 10.1016/j.jare.2022.02.017. Epub 2022 Mar 1.

SOX4 is a novel phenotypic regulator of endothelial cells in atherosclerosis revealed by single-cell analysis

Affiliations

SOX4 is a novel phenotypic regulator of endothelial cells in atherosclerosis revealed by single-cell analysis

Chak Kwong Cheng et al. J Adv Res. 2023 Jan.

Abstract

Introduction: Atherosclerotic complications represent the leading cause of cardiovascular mortality globally. Dysfunction of endothelial cells (ECs) often initiates the pathological events in atherosclerosis.

Objectives: In this study, we sought to investigate the transcriptional profile of atherosclerotic aortae, identify novel regulator in dysfunctional ECs and hence provide mechanistic insights into atherosclerotic progression.

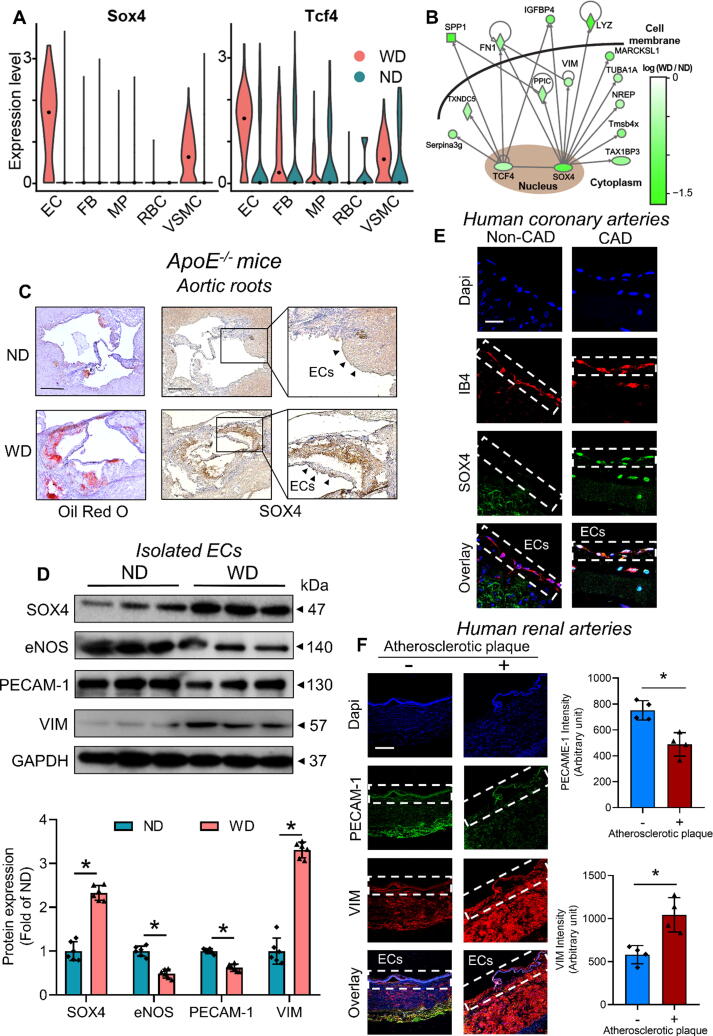
Methods: We applied single-cell RNA sequencing (scRNA-seq) on aortic cells from Western diet-fed apolipoprotein E-deficient (ApoE-/-) mice to explore the transcriptional landscape and heterogeneity of dysfunctional ECs. In vivo validation of SOX4 upregulation in ECs were performed in atherosclerotic tissues, including mouse aortic tissues, human coronary arteries, and human renal arteries. Single-cell analysis on human aortic aneurysmal tissue was also performed. Downstream vascular abnormalities induced by EC-specific SOX4 overexpression, and upstream modulators of SOX4 were revealed by biochemical assays, immunostaining, and wire myography. Effects of shear stress on endothelial SOX4 expression was investigated by in vitro hemodynamic study.

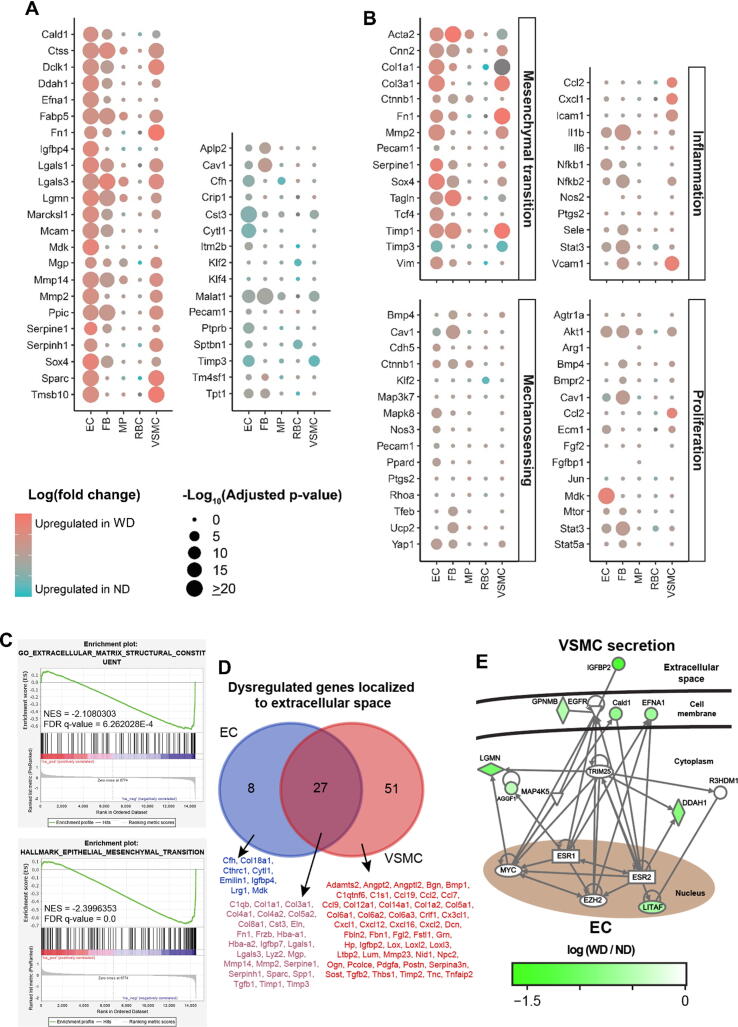
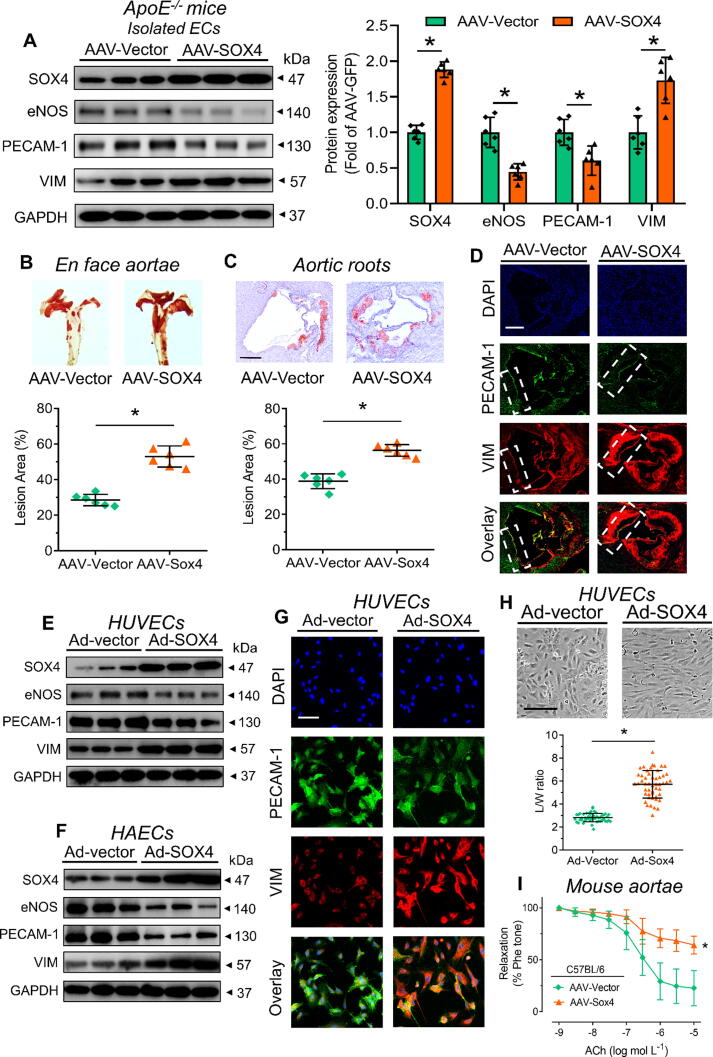
Results: Among the compendium of aortic cells, mesenchymal markers in ECs were significantly enriched. Two EC subsets were subsequently distinguished, as the 'endothelial-like' and 'mesenchymal-like' subsets. Conventional assays consistently identified SOX4 as a novel atherosclerotic marker in mouse and different human arteries, additional to a cancer marker. EC-specific SOX4 overexpression promoted atherogenesis and endothelial-to-mesenchymal transition (EndoMT). Importantly, hyperlipidemia-associated cytokines and oscillatory blood flow upregulated, whereas the anti-diabetic drug metformin pharmacologically suppressed SOX4 level in ECs.

Conclusion: Our study unravels SOX4 as a novel phenotypic regulator during endothelial dysfunction, which exacerbates atherogenesis. Our study also pinpoints hyperlipidemia-associated cytokines and oscillatory blood flow as endogenous SOX4 inducers, providing more therapeutic insights against atherosclerotic diseases.

Keywords: Atherosclerosis; EndoMT; Endothelial cells; Shear stress; Single-cell RNA sequencing.


Conflict of interest statement

Declaration of Competing Interest The authors declare that they have no known competing financial interests or personal relationships that could have appeared to influence the work reported in this paper.

Figures

None
Graphical abstract
Fig. 1
Fig. 1
Identification of five distinct cell populations in atherosclerotic aorta. (A) Schematic overview of experimental design. (B, C) Uniform manifold approximation and projection (UMAP) visualization of single cells from normal (n = 1063) and atherosclerotic (n = 991) aortae of 3 ApoE−/− mice representing (B) cellular origin and (C) segregation into 5 distinct clusters. (D) Dotplots demonstrating the gene signatures of the 5 aortic cell types. Dot colors, expression levels; size, cell proportion with expression. EC, endothelial cell; FB, fibroblast; MP, macrophage; ND, normal diet; RBC, red blood cell; VSMC, vascular smooth muscle cell; WD, western diet. (For interpretation of the references to colour in this figure legend, the reader is referred to the web version of this article.)
Fig. 2
Fig. 2
Transcriptional profiles of distinct cells in atherosclerotic aorta. (A) Dotplots overviewing selected up-regulated and down-regulated genes, and (B) highlighting expression of key genes in terms of mesenchymal transition, inflammation, mechanosening and proliferation. Dot colors, log (fold-change); size, adjusted p-value. (C) Gene set enrichment analysis (GSEA) on extracellular matrix structural constituent and mesenchymal transition of ECs between ND and WD groups. Upper plot: enrichment score distribution. Middle plot: black bars, genes of gene set; red and blue, downregulation and upregulation in WD group, respectively. Lower plot: ordered log (fold-change). Negative NES: enriched expression levels in WD group. (D) Venn-diagram on overlap of dysregulated genes localized to extracellular space of ECs and VSMCs, with the lists of common and unique genes. (E) Gene regulatory network analysis on the crosstalk between ECs and VSMCs during atherosclerosis. Scale bar: log (fold-change). EC, endothelial cell; FB, fibroblast; MP, macrophage; ND, normal diet; RBC, red blood cell; VSMC, vascular smooth muscle cell; WD, western diet. (For interpretation of the references to colour in this figure legend, the reader is referred to the web version of this article.)
Fig. 3
Fig. 3
EC subpopulations in atherosclerotic aorta. (A, B) Uniform manifold approximation and projection (UMAP) plots on (A) cellular origin and (B) partition into two subpopulations (EC1 and EC2) of single ECs from normal and atherosclerotic aortae. (C) Dot plots showing the gene signatures of the two EC subpopulations. Dot colors, expression levels; size, cell proportion with expression. (D, E) Violin plots on the expression of selected (D) endothelial markers and (E) mesenchymal markers of 2 EC subpopulations. Dot: median. (F) Immunofluorescence staining on PRSS23 level in cross sections of ApoE−/− mouse aortae (n = 4 per group; Scale bar: 200 μm). EC, endothelial cell; ND, normal diet; WD, western diet.
Fig. 4
Fig. 4
Endothelial SOX4 upregulation in human and mouse atherosclerotic aortae. (A) Violin plots on the expression of the transcription factors Sox4 and Tcf4 among different aortic cells. Dot: median. (B) Gene regulatory network analysis on the interactome between SOX4 and other proteins. Scale bar: log (fold-change). (C) Oil red O staining on atherosclerotic lesions and immunohistochemical staining on SOX4 expression in aortic roots of ApoE-/- mice (n = 6 per group; Scale bar: 500 μm). (D) Western blotting on expression levels of SOX4, endothelial markers (i.e. eNOS and PECAM-1) and mesenchymal marker (i.e. VIM) of isolated ECs from ApoE−/− mice (n = 6 per group). (E) Immunofluorescence staining on SOX4 level in endothelial cells of human diseased coronary arteries and control internal thoracic arteries (n = 7 per group; Scale bar: 20 μm). (F) Immunofluorescence staining on the levels of endothelial (PECAM-1) and mesenchymal (VIM) markers in human renal arteries (n = 4 per group; Scale bar: 200 μm). Data are presented as mean ± SD. *P < 0.05 vs ND or Non-atherosclerotic artery. CAD, coronary artery disease; EC, endothelial cell; FB, fibroblast; MP, macrophage; ND, normal diet; RBC, red blood cell; VSMC, vascular smooth muscle cell; WD, western diet. (For interpretation of the references to colour in this figure legend, the reader is referred to the web version of this article.)
Fig. 5
Fig. 5
SOX4 overexpression in endothelial cells. (A) Western blotting on isolated ECs from ApoE−/− mice, previously subjected to tail vein injection of endothelial-specific AAV-SOX4 (n = 6 per group). (B, C) Oil red O staining on atherosclerotic lesions of (B) en face aortae and (C) aortic roots of AAV-SOX4-injected ApoE−/− mice (n = 6 per group; Scale bar: 500 μm). (D) Immunofluorescence staining on endothelial and mesenchymal markers of mouse aortic roots (n = 6 per group; Scale bar: 500 μm). (E, F) Western blotting on Ad-SOX4-treated (E) HUVECs and (F) HAECs (n = 6 per group). (G) Immunofluorescence staining on endothelial and mesenchymal markers of Ad-SOX4-infected HUVECs (n = 6 per group; Scale bar: 50 μm). (H) Morphology of Ad-SOX4-treated HUVECs (L/W ratio: Feret value/Min Feret value; Scale bar: 100 μm). (I) Functional assay on endothelium-dependent relaxation of Ad-SOX4-infected C57BL/6 mouse aortae by wire myograph (n = 6 per group). Data are presented as mean ± SD. *P < 0.05 vs AAV-Vector or Ad-Vector (unpaired t-test and nonparametric Mann-Whitney test). ACh, acetylcholine; HAEC, human aortic endothelial cell; HUVEC, human umbilical vein endothelial cell; Phe, phenylephrine. (For interpretation of the references to colour in this figure legend, the reader is referred to the web version of this article.)
Fig. 6
Fig. 6
Biochemical inducers of SOX4 upregulation. (A) Immunohistochemical staining on SOX4 expression of IL-1β-treated human renal arteries (n = 3 per group; Scale bar: 200 μm). (B) Western blotting on IL-1β-treated human renal arteries (n = 3 per group). (C) Western blotting on IL-1β-treated ApoE−/− mouse aortae (n = 6 per group). (D) The effects of metformin in HUVECs co-treated by IL-1β and TGF-β1 (n = 6 per group). (E) The effects of siRNA-mediated SOX4 knockdown in HUVECs co-treated by IL-1β and TGF-β1 (n = 6 per group). Data are presented as mean ± SD. *P < 0.05 vs empty Ctl or empty Scr; #P < 0.05 vs IL-1β + TGF-β1 Ctl or IL-1β + TGF-β1 Scr (Brown-Forsythe and Welch ANOVA and Games-Howell’s multiple comparisons test). HUVECs, human umbilical vein endothelial cell; IL-1β, interleukin-1β; Met, metformin; TGF-β1, transforming growth factor β1.
Fig. 7
Fig. 7
Biomechanical inducers of SOX4 upregulation. (A) Schematic diagram on different flow patterns along the aorta. (B) Immunofluorescence staining on en face SOX4 expression of mouse thoracic aortae (TA) and aortic arches (AA) (n = 6 per group; Scale bar: 50 μm). (C) Western blotting on SOX4 level in mouse TA and AA (n = 6 per group). (D) Schematic diagrams on design of ibidi flow system and cross sections of cell chamber. (E) Western blotting on SOX4 level in HUVECs exposed to LSS or OSS for 24 h (n = 6 per group). Data are presented as mean ± SD. *P < 0.05 vs TA or LSS (unpaired t-test and nonparametric Mann-Whitney test). AA, aortic arch; HUVECs, human umbilical vein endothelial cell; LSS, laminar shear stress; OSS, oscillatory shear stress; TA, thoracic aorta.

References

    1. Libby P. Inflammation in atherosclerosis. Nature. 2002;420(6917):868–874. doi: 10.1038/nature01323. - DOI - PubMed
    1. Lusis A.J. Atherosclerosis. Nature. 2000;407(6801):233–241. doi: 10.1038/35025203. - DOI - PMC - PubMed
    1. Johnsen S.H., Forsdahl S.H., Singh K., Jacobsen B.K. Atherosclerosis in Abdominal Aortic Aneurysms: A Causal Event or a Process Running in Parallel? The Tromsø Study. Arterioscler Thromb Vasc Biol. 2010;30(6):1263–1268. doi: 10.1161/ATVBAHA.110.203588. - DOI - PubMed
    1. Baeyens N., Bandyopadhyay C., Coon B.G., Yun S., Schwartz M.A. Endothelial fluid shear stress sensing in vascular health and disease. J Clin Invest. 2016;126(3):821–828. doi: 10.1172/JCI83083. - DOI - PMC - PubMed
    1. Gimbrone M.A., García-Cardeña G. Endothelial Cell Dysfunction and the Pathobiology of Atherosclerosis. Circ Res. 2016;118(4):620–636. doi: 10.1161/CIRCRESAHA.115.306301. - DOI - PMC - PubMed

Publication types