. 2022 Dec 30;6(3):e202201614.
doi: 10.26508/lsa.202201614. Print 2023 Mar.

Regulation of telomere silencing by the core histones-autophagy-Sir2 axis

Affiliations

Regulation of telomere silencing by the core histones-autophagy-Sir2 axis

Qianyun Mei et al. Life Sci Alliance. .

Abstract

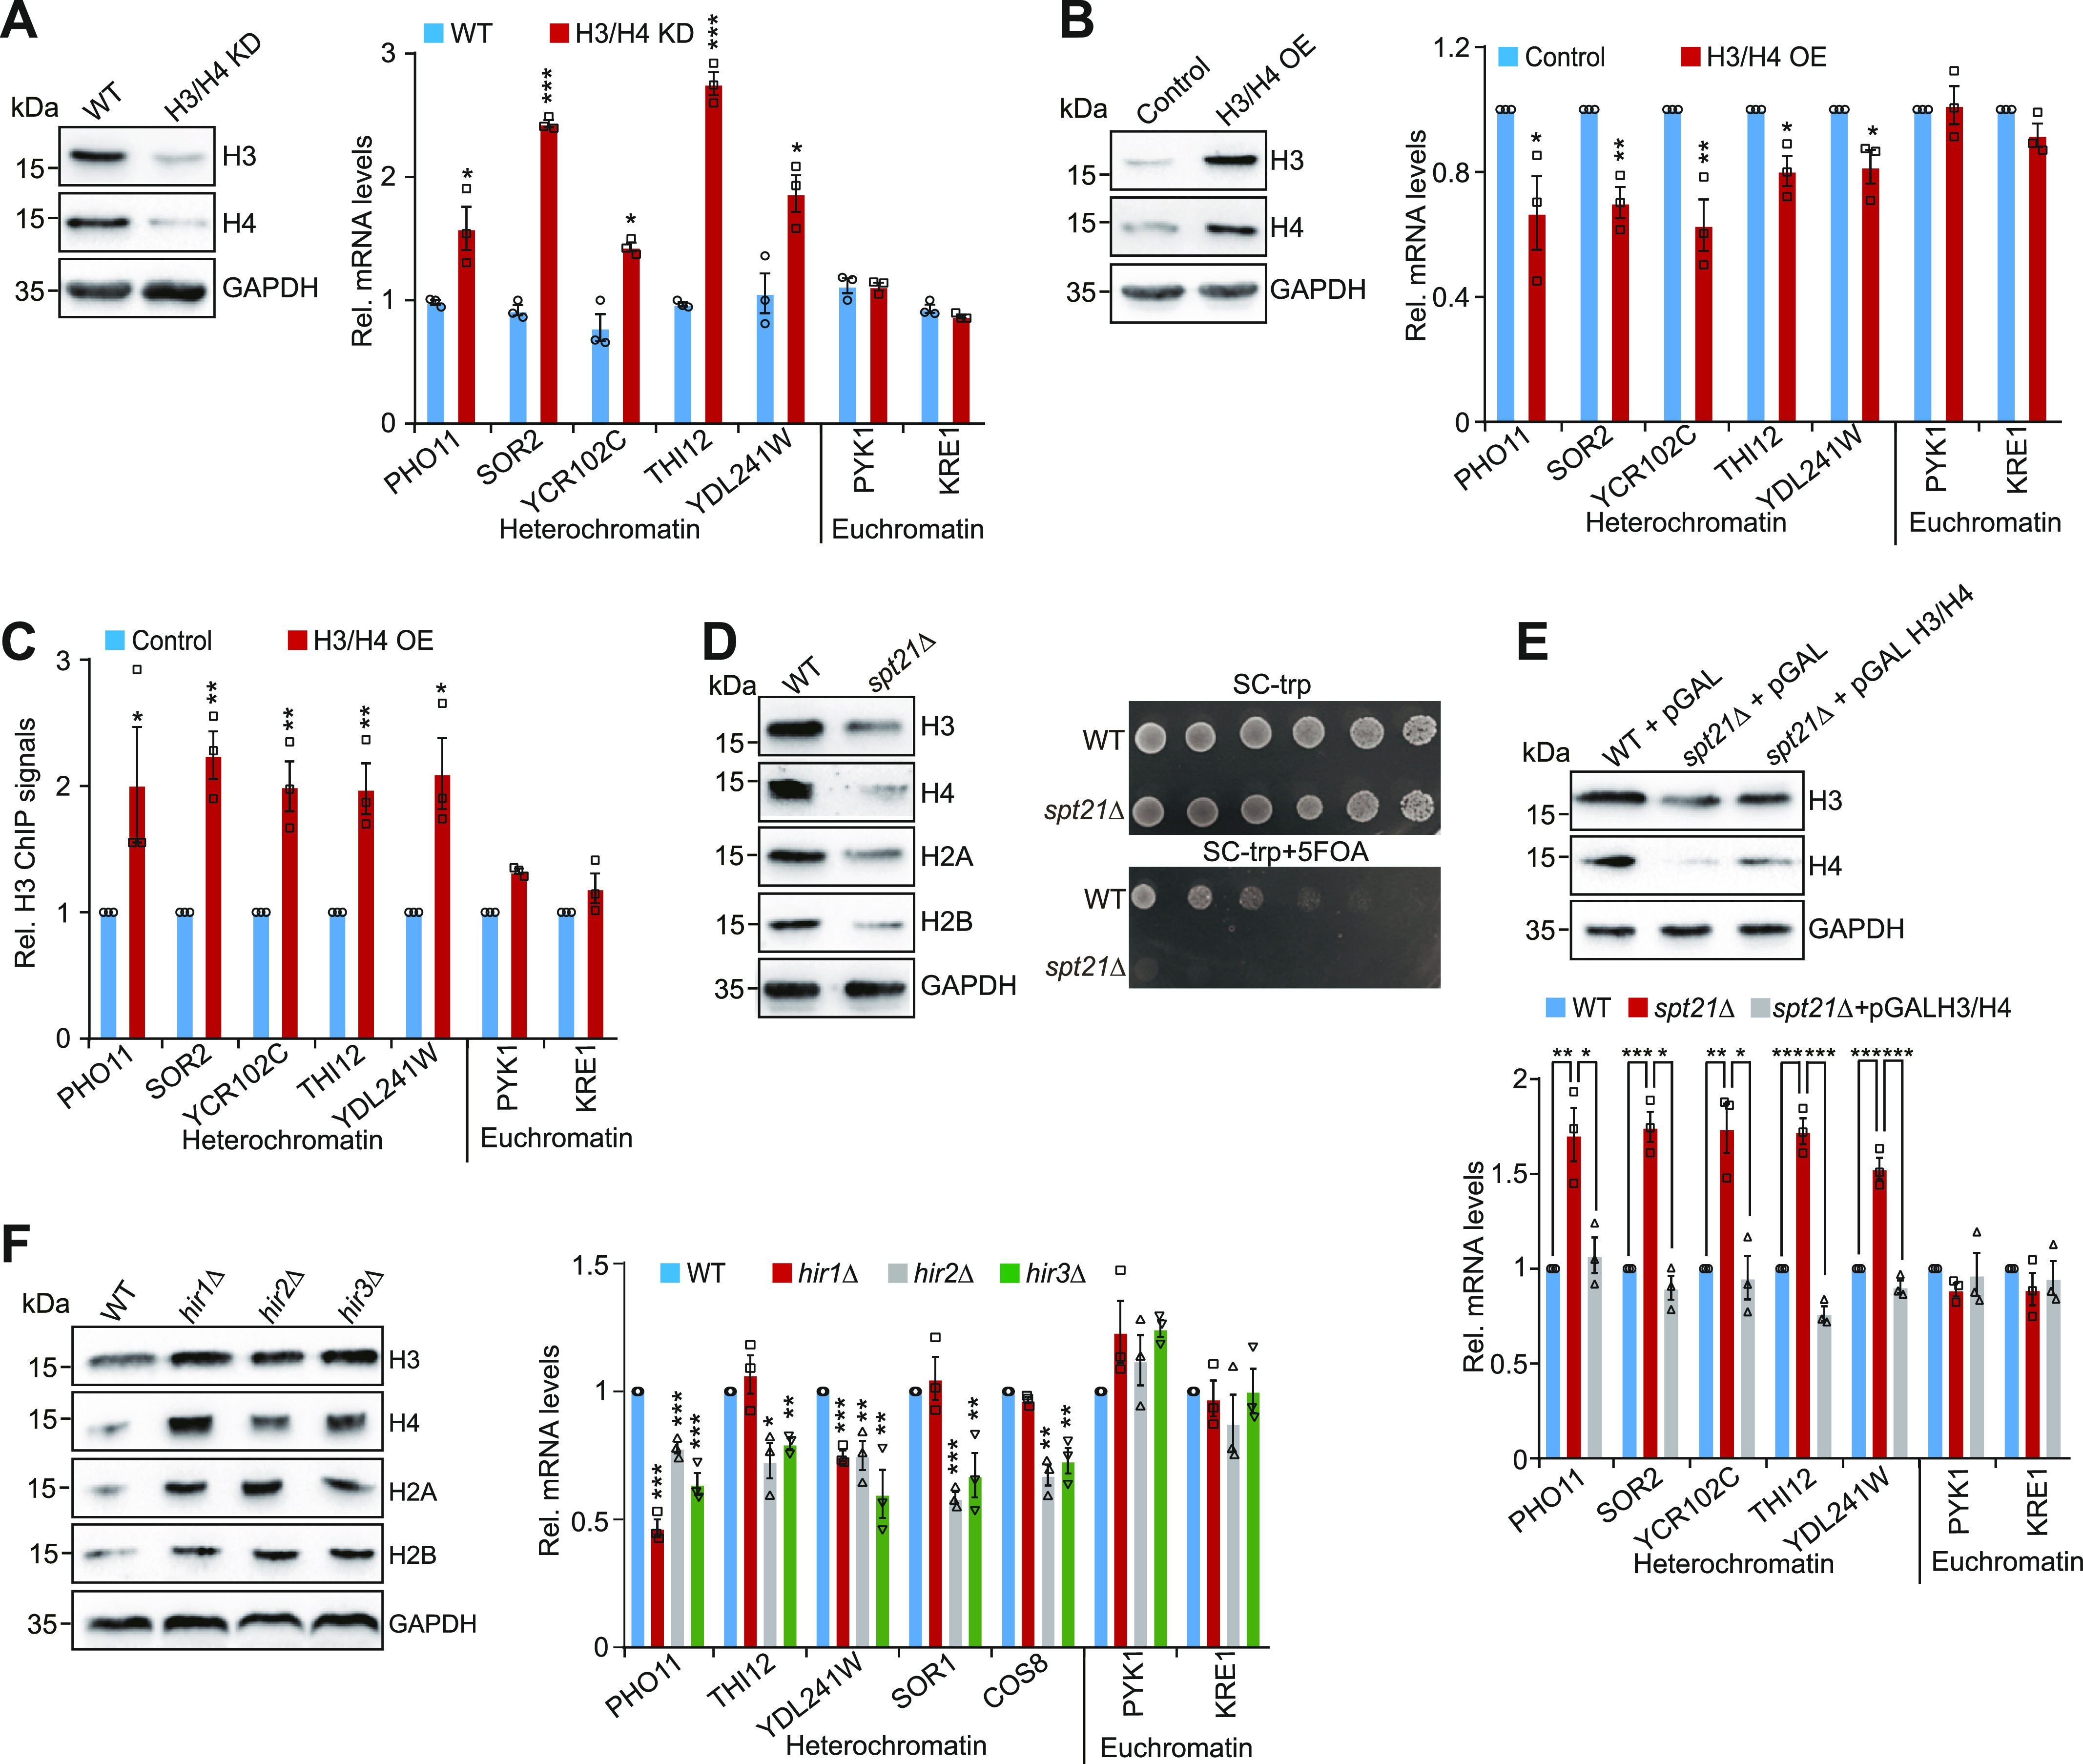
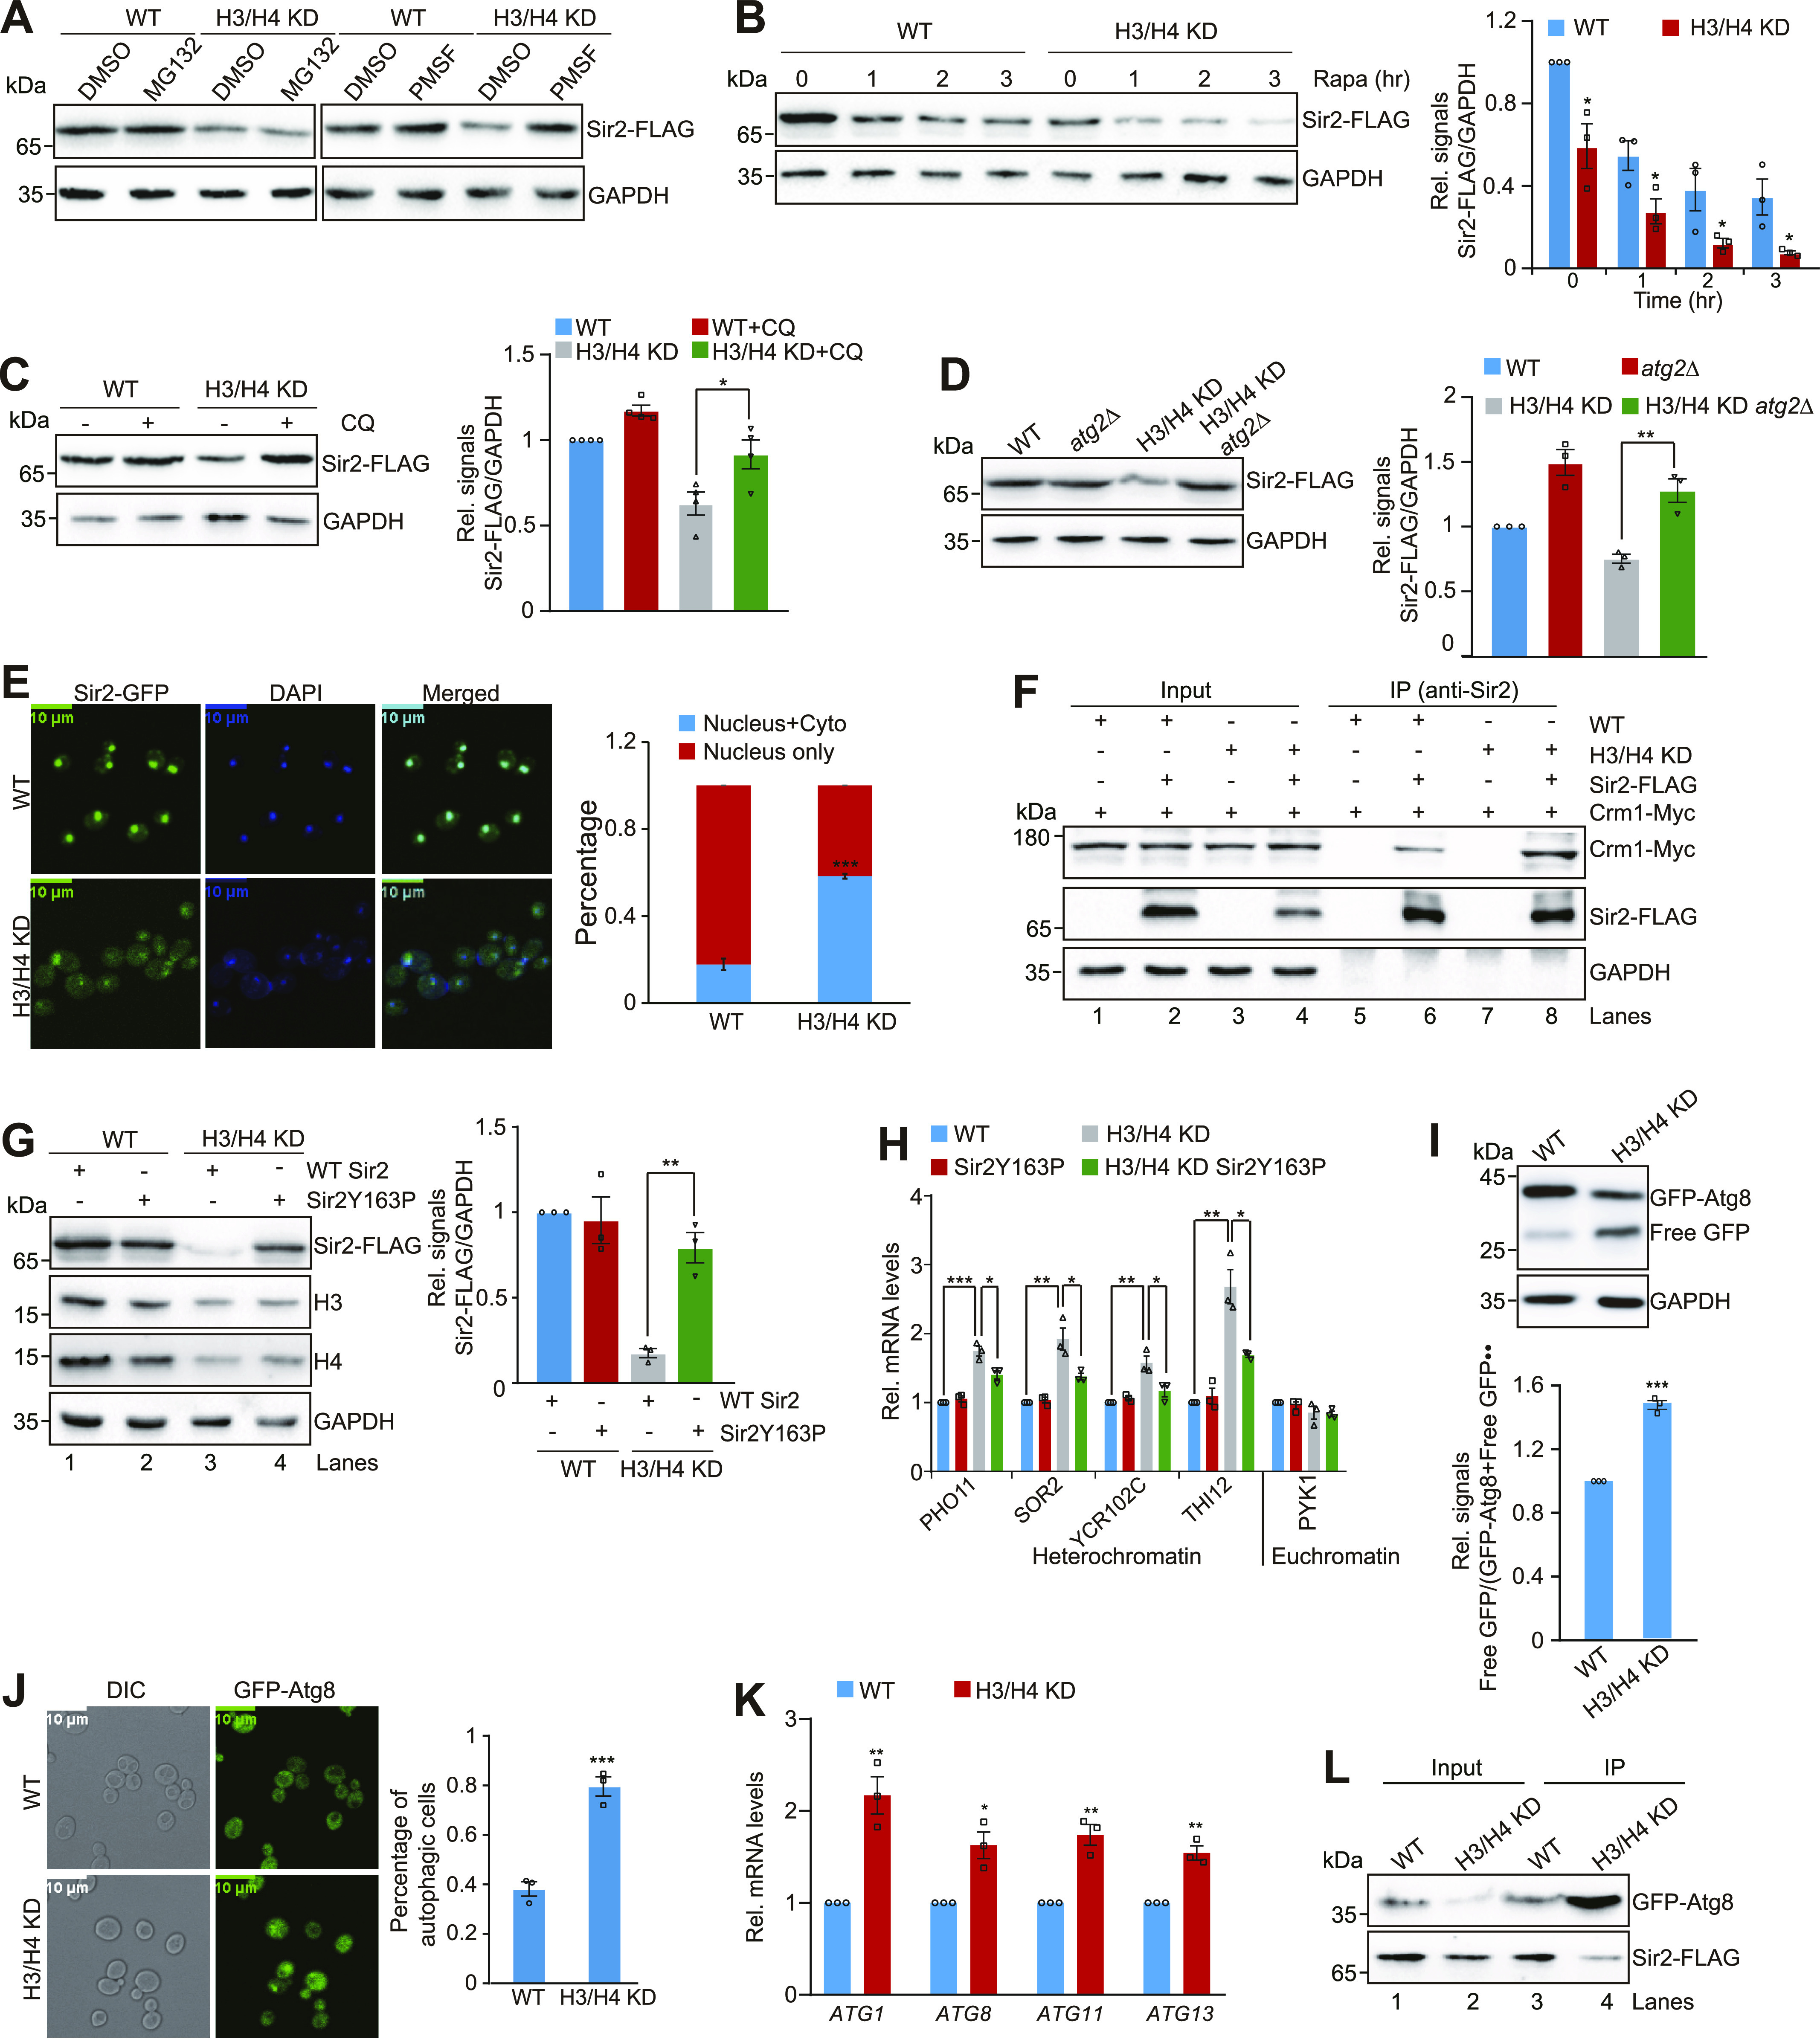
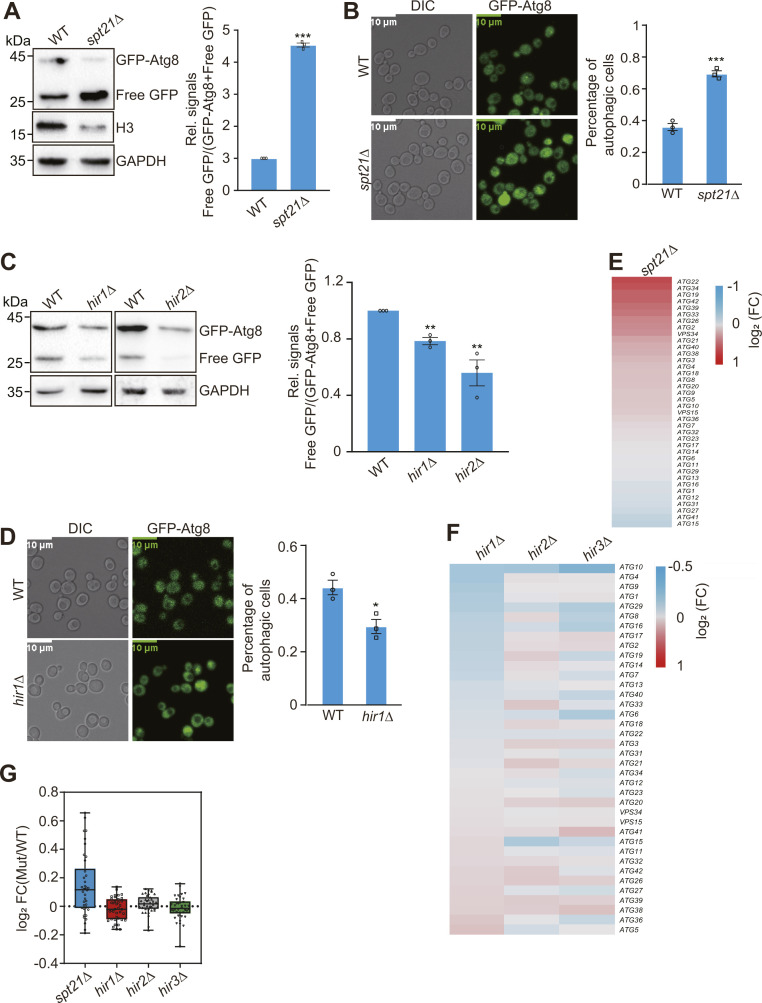
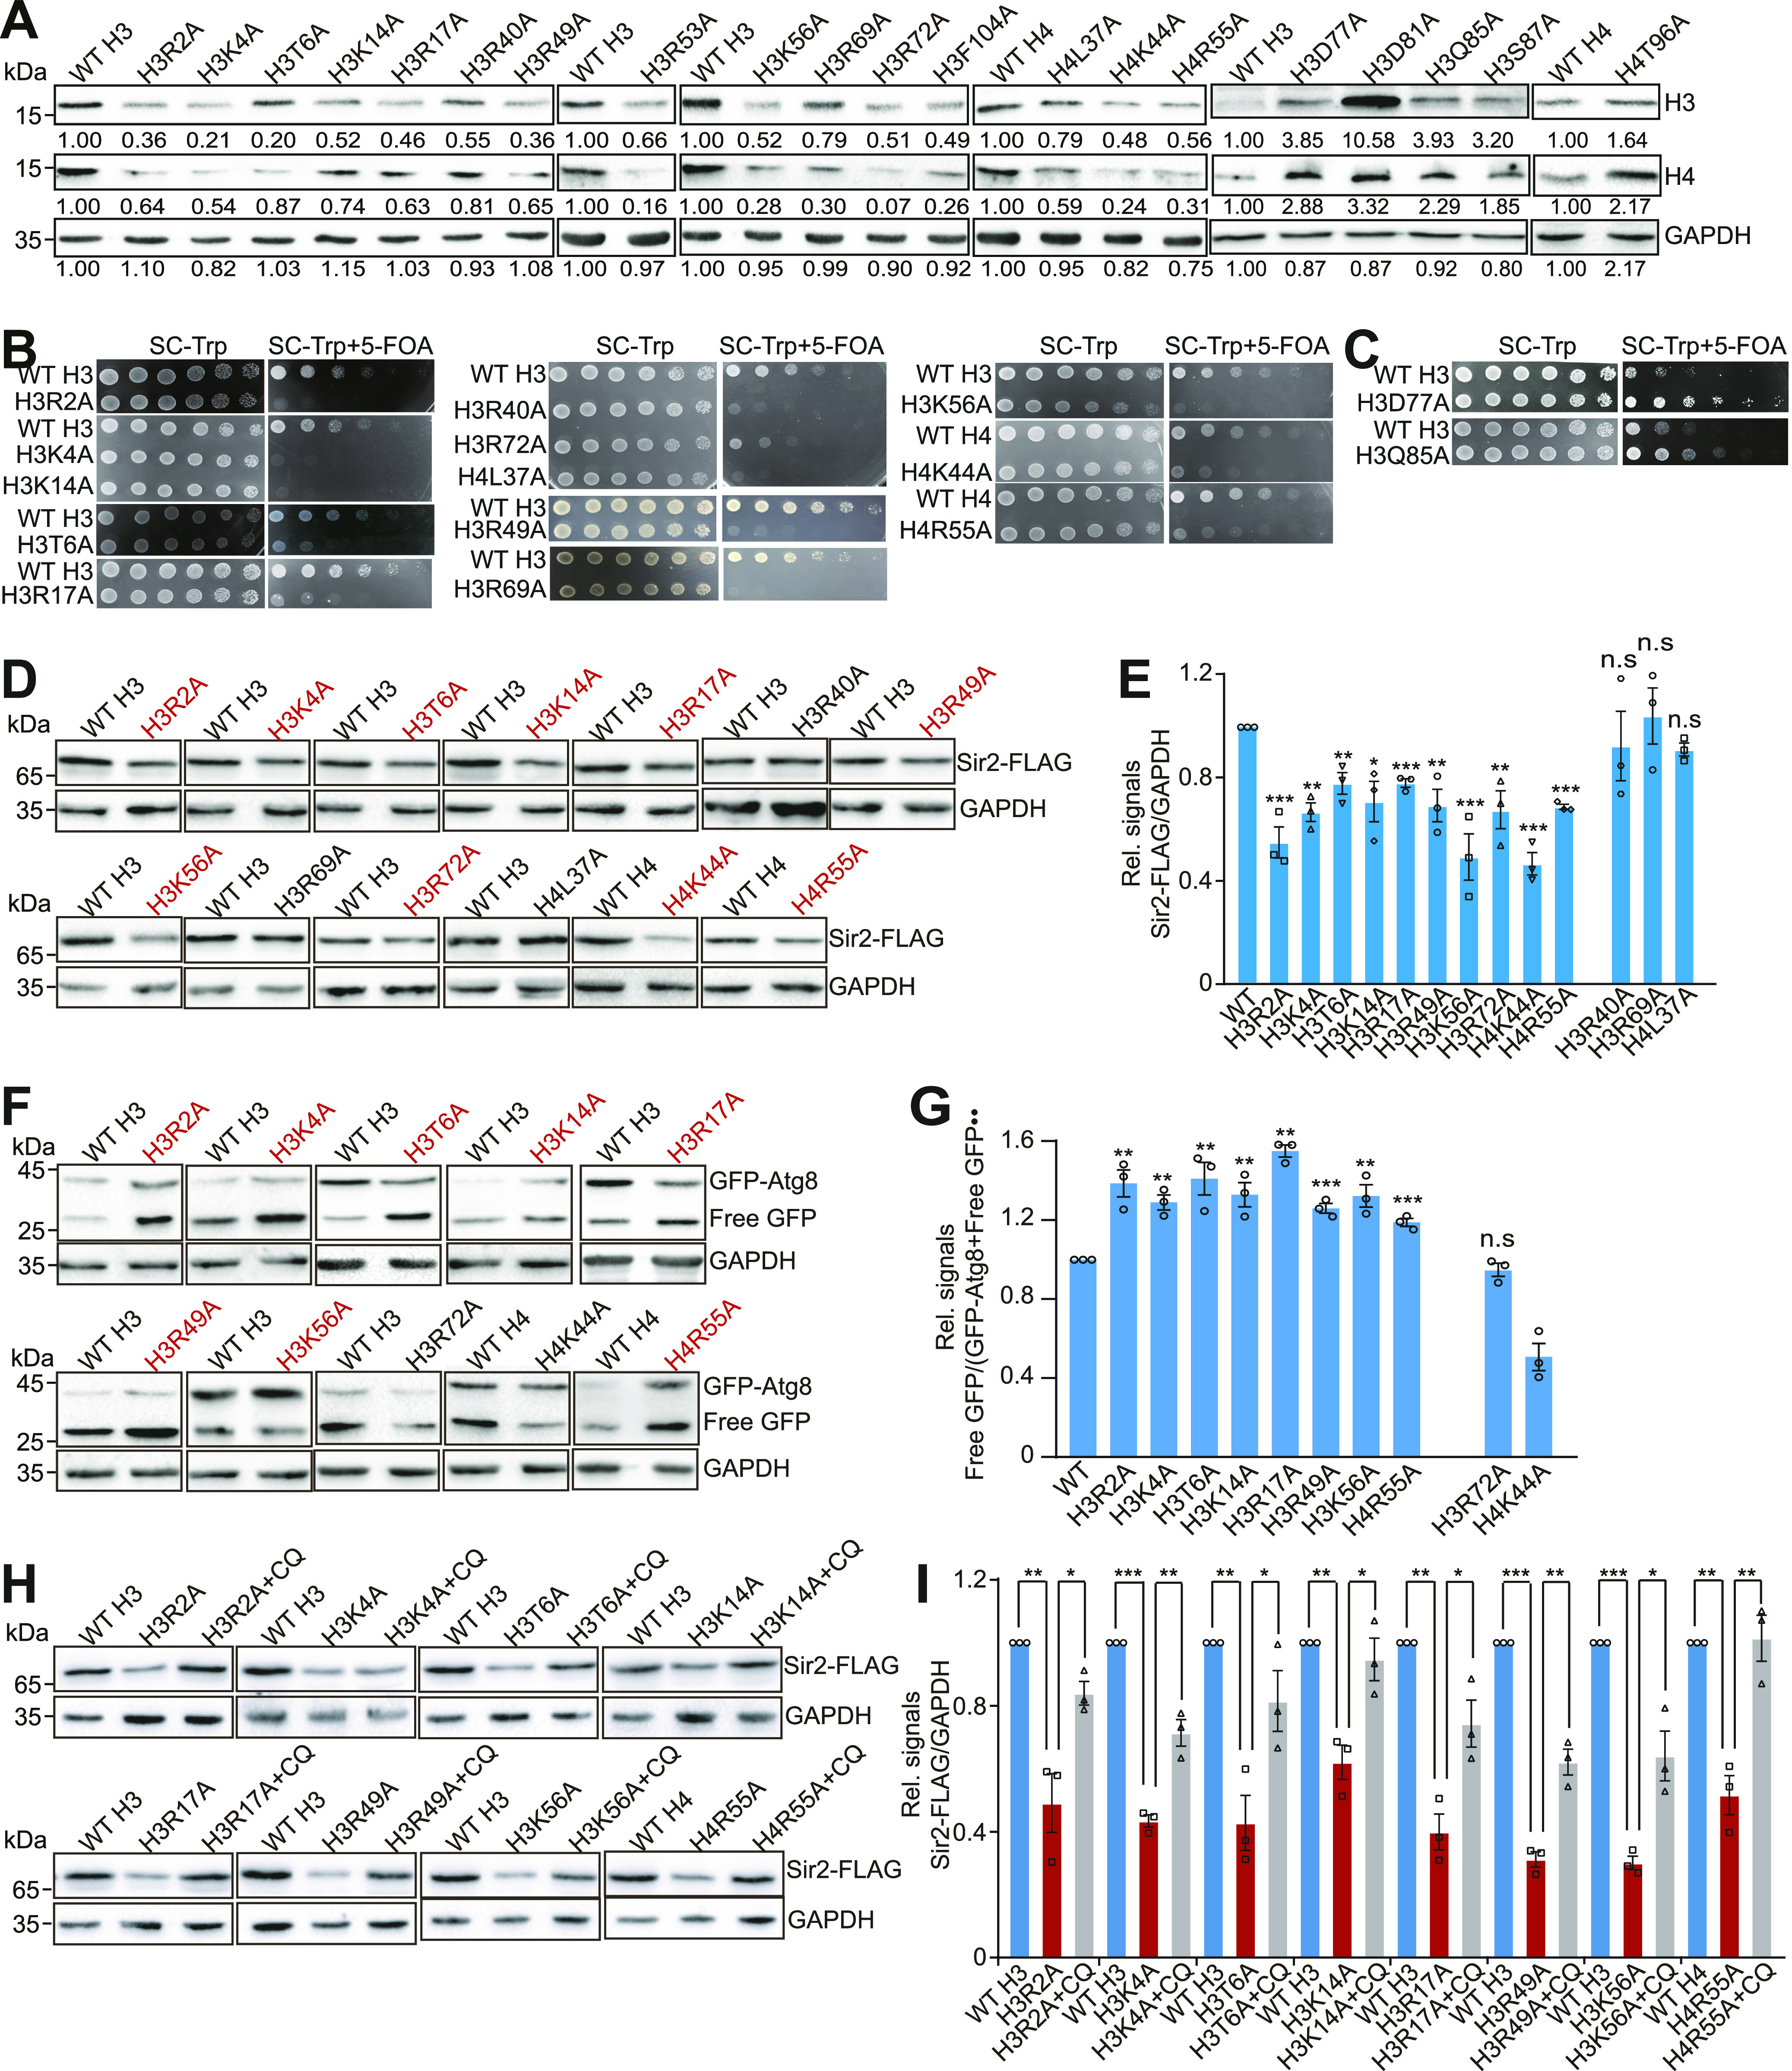
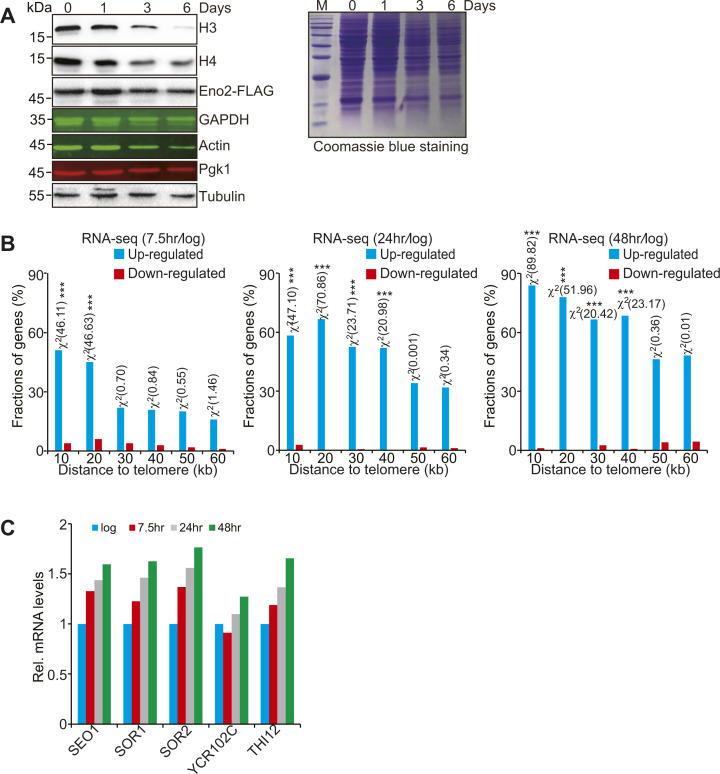
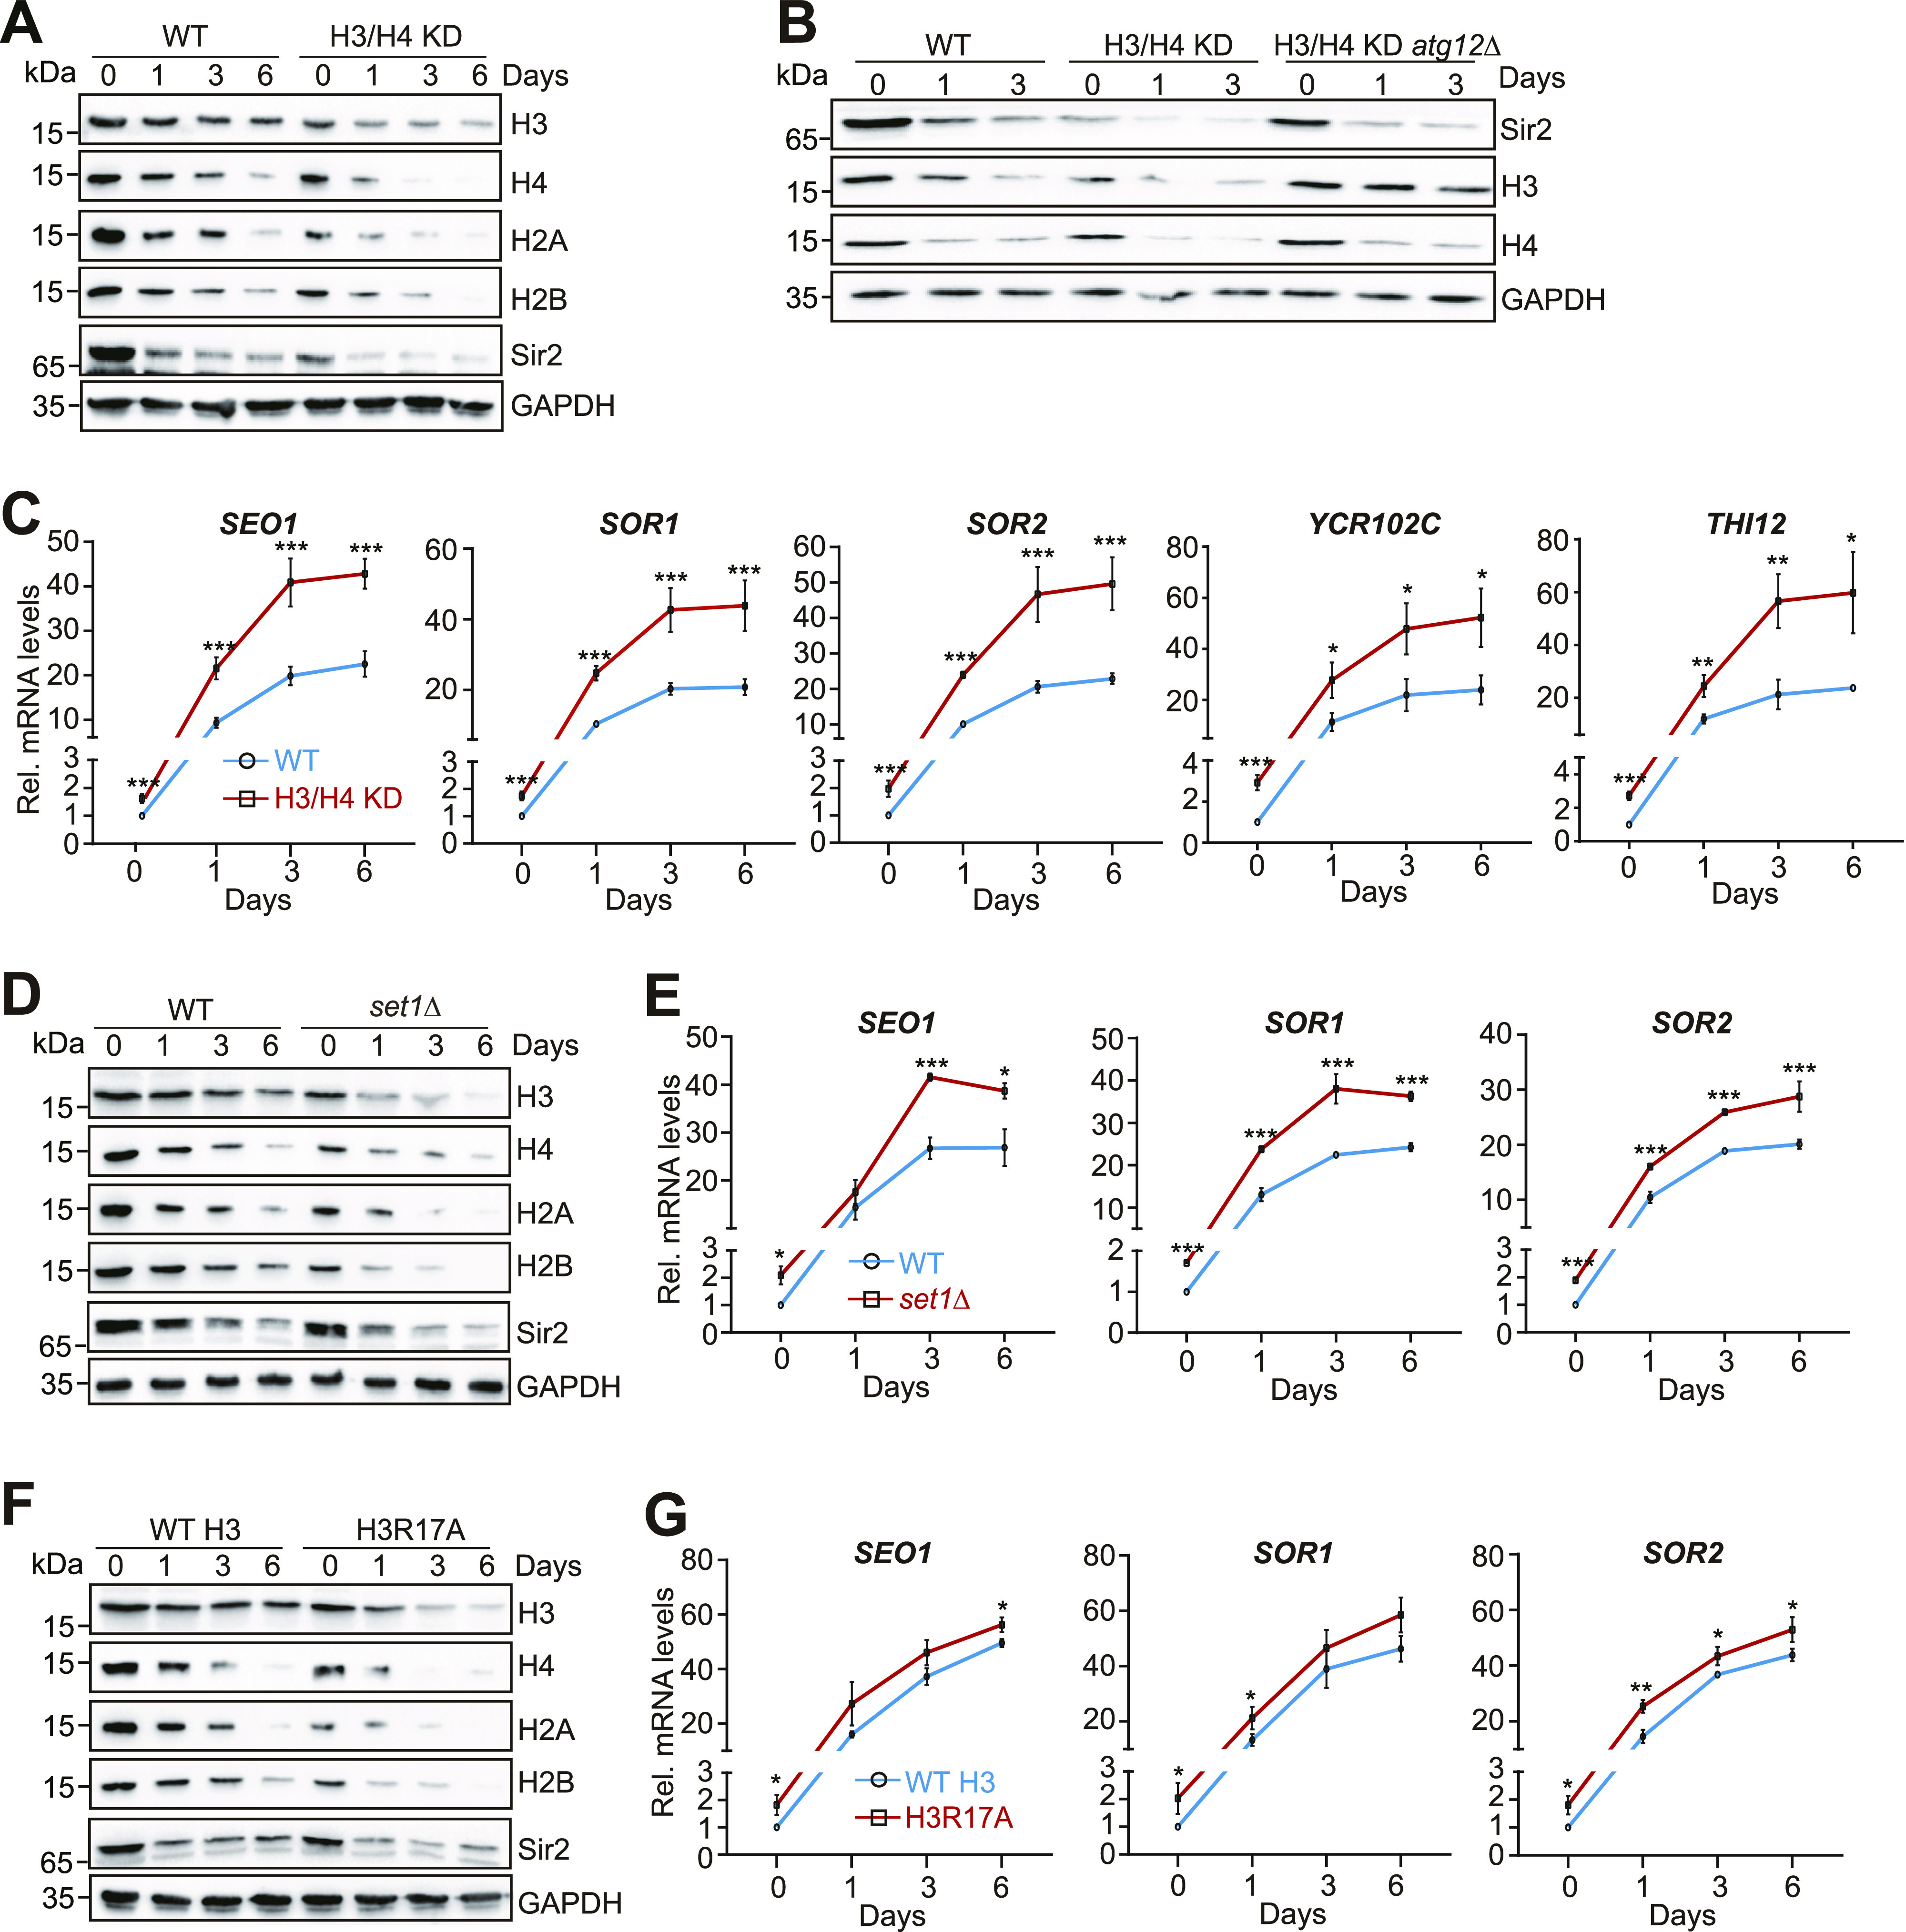
Telomeres contain compacted heterochromatin, and genes adjacent to telomeres are subjected to transcription silencing. Maintaining telomere structure integrity and transcription silencing is important to prevent the occurrence of premature aging and aging-related diseases. How telomere silencing is regulated during aging is not well understood. Here, we find that the four core histones are reduced during yeast chronological aging, leading to compromised telomere silencing. Mechanistically, histone loss promotes the nuclear export of Sir2 and its degradation by autophagy. Meanwhile, reducing core histones enhances the autophagy pathway, which further accelerates autophagy-mediated Sir2 degradation. By screening the histone mutant library, we identify eight histone mutants and one histone modification (histone methyltransferase Set1-catalyzed H3K4 trimethylation) that regulate telomere silencing by modulating the core histones-autophagy-Sir2 axis. Overall, our findings reveal core histones and autophagy as causes of aging-coupled loss of telomere silencing and shed light on dynamic regulation of telomere structure during aging.


Conflict of interest statement

The authors declare that they have no conflict of interest.

Figures

Figure 1.
Figure 1.. Regulation of telomere silencing by core histone levels.
(A) Left panel: Western blot analysis of core histones (H3, H4) in WT and H3/H4 KD cells. Right panel: qRT–PCR analysis of the transcription of PHO11, SOR2, YCR102C, THI12, YDL241W, PYK1, and KRE1 in exponentially growing WT and H3/H4 KD cells. The mRNA levels of these genes were normalized to ACTIN. (B) Left panel: Western blot analysis of core histones (H3, H4) in WT (BY4741) cells transfected with empty vector (control) or pGAL H3/H4 (H3/H4 OE). Right panel: qRT–PCR analysis of the transcription of PHO11, SOR2, YCR102C, THI12, YDL241W, PYK1, and KRE1 in exponentially growing control and H3/H4 OE cells. Cells were treated with 2% galactose to induce the ectopic expression of histones before being harvested for RNA extraction. (C) ChIP-qPCR analysis of histone H3 occupancy at telomere-proximal genes in control and H3/H4 OE cells. (D) WT and spt21Δ cells bearing URA3 adjacent to Tel VII-L were grown to saturation, normalized for OD600, serially diluted, and spotted on SC-Trp and SC-Trp + 5-FOA plates. Impaired growth on 5-FOA plates indicates reduced silencing of URA3. (E) Top panel: Western blot analysis of core histones (H3, H4) in WT and spt21Δ cells transformed with empty vector (pGAL) or pGAL H3/H4. Bottom panel: qRT–PCR analysis of the transcription of PHO11, SOR2, YCR102C, THI12, YDL241W, PYK1, and KRE1 in WT and spt21Δ cells transformed with empty vector (pGAL) or pGAL H3/H4. (F) Left panel: Western blot analysis of core histones in WT, hir1∆, hir2∆, and hir3∆ cells. Right panel: qRT–PCR analysis of the transcription of PHO11, SOR2, YCR102C, THI12, YDL241W, PYK1, and KRE1 in exponentially growing WT, hir1∆, hir2∆, and hir3∆ cells. Data represent the mean ± SE of three independent experiments. For (A, B, C, E, F), data represent the mean ± SE of three independent experiments. *P < 0.05; **P < 0.01; ***P < 0.001. Source data are available for this figure.
Figure S1.
Figure S1.. Regulation of the transcription of core histones by Spt21 and HIR complex.
(A) Reduced core histone gene transcription in spt21Δ mutant as analyzed by RNA-seq. The signals of log2(spt21∆/WT) for eight core histone genes are shown. The dataset is retrieved from GSE110003. (B) Histogram showing the proportion of the genes down-regulated (red) and up-regulated (blue) in spt21Δ cells when plotted as a function of their distance to the nearest telomeres. Genes were categorized at 10 kb intervals for up to 60 kb from telomeres. *χ2 > 3.841, P < 0.05; **χ2 > 6.635, P < 0.01; ***χ2 > 10.828, P < 0.001. (C) Increased expression of all eight core histone genes in hir1Δ, hir2Δ, and hir3Δ mutants as determined by RNA-seq. The signals of log2(hir1∆/WT), log2(hir2∆/WT), and log2(hir3∆/WT) are shown. The dataset is retrieved from GSE42526.
Figure 2.
Figure 2.. Core histone levels regulate Sir2 homeostasis and Sir2 binding at telomeres.
(A) ChIP-qPCR analysis of Sir2 occupancy at telomere-proximal genes in WT and H3/H4 KD cells. (B) ChIP-qPCR analysis of Sir2 occupancy at telomere-proximal genes in control and H3/H4 overexpressing cells (H3/H4 OE). (C) Western blot analysis of core histones (H3, H4) and Sir2 in WT and H3/H4 KD cells. (D) Western blot analysis of Sir2 in WT and spt21Δ mutant. (E) Western blot analysis of core histones (H3, H4) and Sir2 in control and H3/H4 overexpression cells (H3/H4 OE). (F) Western blot analysis of Sir2 in WT, hir1∆, hir2∆, and hir3∆ cells. (G) qRT–PCR analysis of the transcription of SIR2, PHO11, SOR2, YCR102C, THI12, and PYK1 in WT and H3/H4 KD mutant transformed with empty vector (pTEF) or plasmid that overexpresses Sir2 (pTEFpro-SIR2). For (A, B, C, D, E, F, G), data represent the mean ± SE of three independent experiments. *P < 0.05; **P < 0.01; ***P < 0.001. Source data are available for this figure.
Figure S2.
Figure S2.. Core histone levels tightly regulate Sir2 homeostasis.
(A) Left panel: Western blot analysis of Sir2 and Sir3 in WT and H3/H4 KD mutant. Right panel: Western blot analysis of Sir2 in WT and sir2∆ mutant to test the specificity of anti-Sir2 antibody. (B) qRT–PCR analysis of the transcription of SIR2 in exponentially growing WT, H3/H4 KD, spt21∆, hir1∆, set1∆, and spp1∆ mutants. (C, D) Quantification of Western blot analysis in Fig 3A. (E) qRT–PCR analysis of the transcription of CRM1 in exponentially growing WT TetO7 and TetO7-CRM1 mutant when treated with 6.25 µg/ml doxycycline for 2 h. (F) Knockdown of CRM1 expression partly rescued rapamycin-reduced Sir2. WT TetO7 and TetO7-CRM1 cells grown in YPD medium were treated with 6.25 µg/ml doxycycline and 1 µg/ml rapamycin for 0–1.5 h. Rapa, rapamycin.
Figure 3.
Figure 3.. Core histone levels tightly regulate autophagy-mediated Sir2 degradation.
(A) Western blot analysis of Sir2 in exponentially growing WT and H3/H4 KD cells treated with 5 mM MG132 or PMSF. (B) Western blot analysis of Sir2 in exponentially growing WT and H3/H4 KD cells treated with 1 μg/ml rapamycin for 0, 1, 2, and 3 h. (C) Western blot analysis of Sir2 in exponentially growing WT and H3/H4 KD cells in the presence or absence of 10 mM CQ. (D) Western blot analysis of Sir2 in exponentially growing WT, atg2Δ, H3/H4 KD, and H3/H4 KD atg2Δ mutants. (E) Representative fluorescence images showing the distribution of Sir2–GFP (green) in WT and H3/H4 KD cells expressing Sir2–GFP from the native SIR2 locus. DAPI (blue) represented the nucleus. There was more Sir2 diffuse throughout the cell in H3/H4 KD mutant compared with WT. Bar, 10 µm. Right panel: quantification of Sir2–GFP localization in the left panel. The bar graphs represent the percentages of cells exhibiting Sir2–GFP localized in the nucleus (Nucleus only) or exported to the cytoplasm (Nucleus + Cyto). Data show mean ± SE from at least three experiments, with ∼350 cells counted for each strain per experiment. (F) Co-immunoprecipitation assays showing knockdown of histones (H3/H4 KD) enhanced the interaction between the endogenously expressed Sir2 and Crm1. (G) Western blot analysis of Sir2 in exponentially growing WT and H3/H4 KD cells that express WT Sir2 or Sir2Y163P. (H) qRT–PCR analysis of the transcription of PHO11, SOR2, YCR102C, THI12, and PYK1 in WT and H3/H4 KD mutant that express Sir2Y163P. (I) Western blot analysis of GFP-Atg8 and free GFP in WT and H3/H4 KD mutant expressing the endogenous ATG8 promoter-driven GFP-Atg8 with anti-GFP antibody. (J) Representative fluorescence microscopy images showed the distribution of GFP-Atg8 (green) in WT and H3/H4 KD mutant. The autophagic cells were defined as cells with clear vacuolar GFP fluorescence. (K) qRT–PCR analysis of the transcription of ATG1, ATG8, ATG11, and ATG13 in exponentially growing WT and H3/H4 KD cells. (L) Co-immunoprecipitation assays showing reduced core histones H3 and H4 enhanced the interaction between Sir2 and Atg8. For (B, C, D, G, H, I, J, K), data represent the mean ± SE of three independent experiments. *P < 0.05; **P < 0.01; ***P < 0.001. Source data are available for this figure.
Figure S3.
Figure S3.. Core histone regulators tightly regulate autophagy.
(A, B) Analysis of autophagy activity in WT and spt21Δ mutant. (C, D) Analysis of autophagy activity in WT, hir1Δ, and hir2Δ mutants. (B, D) Quantification of autophagic cells in (B, D) was derived from about 100 counts (blinded) for each replicate. (E, F) RNA-seq analysis of ATG gene expression in spt21∆, hir1∆, hir2∆, and hir3∆ mutants. The ATG genes were indicated on the right side. The dataset is retrieved from GSE110003 and GSE42526. (G) Box plot showing the overall transcription changes of ATG genes in spt21∆, hir1∆, hir2∆, and hir3∆ mutants. The dataset is retrieved from GSE110003 and GSE42526.
Figure 4.
Figure 4.. Screen for histone mutants that regulate telomere silencing via the core histones–autophagy–Sir2 axis.
(A) Western blot analysis of core histones in the indicated exponentially growing yeast cells. GAPDH was used as a loading control. (B, C) WT indicated histone mutant cells bearing URA3 adjacent to Tel VII-L were grown to saturation, normalized for OD600, serially diluted, and spotted on SC-Trp and SC-Trp + 5-FOA plates. The impaired growth on 5-FOA plates indicates reduced silencing of URA3. The better growth on 5-FOA plates indicates enhanced silencing of URA3. (D, E) Western blots and quantitation analysis of Sir2 in WT and indicated histone mutants. GAPDH was used as a loading control. (F, G) Western blot analysis of GFP-Atg8 and free GFP in WT and indicated histone mutants. (H, I) Western blot analysis of Sir2 protein in histone mutants in the presence or absence of 10 mM CQ. All experiments were performed with exponentially growing cells. For (D, E, F, G, H, I), data represent the mean ± SE of three independent experiments. *P < 0.05; **P < 0.01; ***P < 0.001. Source data are available for this figure.
Figure S4.
Figure S4.. Screen for histone residues that regulate telomere silencing via the core histones–autophagy–Sir2 axis.
(A) The telomere silencing reporter strains (WT, H3R53A, H3F104A) were grown to saturation, normalized for OD600, serially diluted, and spotted on SC-Trp and SC-Trp + 5-FOA plates. (B, C, D, E, F, G, H) Histogram showing the proportion of genes down-regulated (red) and up-regulated (blue) in H3R2A (B), H3R17A (C), H3R49A (D), H3R72A (E), H3R40A (F), H4K44A (G), and H4R55A (H) mutants when plotted as a function of their distance to the nearest telomeres. Genes were categorized at 10 kb intervals for up to 60 kb from telomeres. A χ2 value for each 10 kb interval was calculated by comparing the fraction of derepressed genes in the interval with the genome-wide average to reflect the telomere-proximal bias of gene down-regulation. *χ2 > 3.841, P < 0.05; **χ2 > 6.635, P < 0.01; ***χ2 > 10.828, P < 0.001. (I) ChIP-qPCR analysis of Sir2 occupancy in telomere-proximal genes (PHO11, SOR2, YCR102C, THI12, SOR1) in exponentially growing cells (WT H3, H3R40A, H3R69A, H4L37A). The bottom panel: ChIP-qPCR analysis of Sir2 occupancy at telomere-proximal genes rDNA, HML, and HMR in WT and sir2Δ mutant using anti-Sir2 antibody. (J) Representation of the nucleosome, highlighting the residues that regulate histone levels and telomere silencing (in red color), which were located in three primary clusters. PDB file 1KX5 was used.
Figure S5.
Figure S5.. Effect of histone mutants that have increased core histone levels on telomere silencing.
(A) The telomere silencing reporter strains (WT H3, H3D81A, H3S87A, WT H4, H4T96A) were grown to saturation, normalized for OD600, serially diluted, and spotted on SC-Trp and SC-Trp + 5-FOA plates. (B, C) qRT–PCR analysis of the transcription of telomere proximity genes (SOR2, YCR102C, THI12, SOR1, SEO1) in exponentially growing WT, H3D77A, and H3Q85A mutants. PYK1 and KRE1 were used as negative controls. The RNA levels of all genes were normalized to ACTIN. *P < 0.05; **P < 0.01; ***P < 0.001. (D) Histogram showing the proportion of genes down-regulated (red) and up-regulated (blue) in H3D77A mutant when plotted as a function of their distance to the nearest telomeres. Genes were categorized at 10 kb intervals for up to 60 kb from telomeres. A χ2 value for each 10 kb interval was calculated by comparing the fraction of derepressed genes in the interval with the genome-wide average to reflect the telomere-proximal bias of gene down-regulation. *χ2 > 3.841, P < 0.05; **χ2 > 6.635, P < 0.01; ***χ2 > 10.828, P < 0.001. (E, F) ChIP-qPCR analysis of the occupancy of H3 at telomere-proximal genes (SOR2, YCR102C, THI12, SOR1, SEO1) in exponentially growing WT H3, H3D77A, and H3Q85A cells. PYK1 and KRE1 located in euchromatin were used as negative controls. (G) ChIP-qPCR analysis of the Sir2 occupancy in telomere-proximal genes (PHO11, SOR2, YCR102C, THI12, SOR1) in exponentially growing cells (WT H3, H3D77A, and H3Q85A). (H) qRT–PCR analysis of the transcription of telomere proximity genes (SOR2, YCR102C, THI12) in exponentially growing WT, H3D77A, sir2Δ, and H3D77A sir2Δ mutants. PYK1 and KRE1 were used as negative controls. The RNA levels of all genes were normalized to ACTIN. *P < 0.05; **P < 0.01; ***P < 0.001. (I) qRT–PCR analysis of the transcription of telomere proximity genes (SOR2, YCR102C, THI12) in WT, H3Q85A, sir2Δ, and H3Q85A sir2Δ mutants. PYK1 and KRE1 were used as negative controls. (J) Summary of histone mutants on histone protein levels, autophagy, Sir2 protein level, Sir2 binding, and telomere silencing. Eight histone mutants (H3R2A, H3K4A, H3T6A, H3K14A, H3R17A, H3R49A, H3K56A, H4R55A) have reduced core histone proteins, increased autophagy, decreased Sir2 protein levels, and compromised telomere silencing. H3R72A and H4K44A reduce Sir2 and telomere silencing, whereas they have no effect on autophagy. Although H3R40A, H3R69A, and H4L37A have no effect on Sir2 protein levels, they have reduced core histones, decreased Sir2 binding at telomeres, and compromised telomere silencing. H3D77A and H3Q85A have increased histone proteins, elevated Sir2 binding at telomeres, and enhanced telomere silencing.
Figure S6.
Figure S6.. Set1-catalyzed H3K4me3 maintains normal telomere silencing by inhibiting the core histones–autophagy–Sir2 axis.
(A, B) ChIP-qPCR analysis of H3K4me3 at histone genes in WT H3, H3K4A, WT, and set1Δ mutants. (C) Western blot analysis of core histone proteins in WT, set1Δ, and spp1Δ mutants. (D) ChIP-qPCR analysis of H3K4me3 at histone genes in WT and spp1Δ mutant. (E) Western blot analysis of core histone proteins in WT and spp1Δ mutant. (F) The telomere silencing reporter strains (WT H3, H3K4M, H3K4A, and H3K4R) were spotted on SC-Trp and SC-Trp + 5-FOA at 30°C. Shown is the typical example of three independent experiments. (G) The telomere silencing reporter strains (WT, set1Δ, and spp1Δ) were spotted on SC-Trp and SC-Trp + 5-FOA at 30°C. (H) Histogram showing the proportion of genes down-regulated (red) and up-regulated (blue) in set1Δ mutant when plotted as a function of their distance to the nearest telomeres. Genes were categorized at 10 kb intervals for up to 60 kb from telomeres. A χ2 value for each 10 kb interval was calculated by comparing the fraction of genes derepressed in set1Δ in the interval with the genome-wide average to reflect the telomere-proximal bias. *χ2 > 3.841, P < 0.05; **χ2 > 6.635, P < 0.01; ***χ2 > 10.828, P < 0.001. The set1Δ RNA-seq data were retrieved from GSE73407.
Figure 5.
Figure 5.. Set1-catalyzed H3K4me3 maintains normal telomere silencing by repressing the core histones–autophagy–Sir2 axis.
(A, B, C) ChIP-qPCR analysis of H3 occupancy in telomere-proximal genes (PHO11, SOR2, THI12, YCR102C, YDL241W) in exponentially growing cells (WT H3, H3K4A, WT, set1Δ, spp1Δ). PYK1 and KRE1 were used as negative controls. (D, E) The transcription of telomere-proximal genes (PHO11, SOR2, YCR102C, THI12, and YDL241W) was significantly increased in H3K4A (D) and set1Δ (E) mutants as determined by qRT–PCR. RNA was extracted from exponentially growing cells. The mRNA levels of all genes were normalized to ACTIN. The transcription of PYK1 and KRE1 was used as negative controls. (F) Western blot analysis of Sir2 and core histone proteins (H3, H4) in WT (empty vector or pGAL H3/H4), set1Δ (empty vector or pGAL H3/H4) cells. (G) qRT–PCR analysis of the transcription of telomere-proximal genes in WT (empty vector or pGAL H3/H4), set1Δ (empty vector or pGAL H3/H4) cells. (H) Western blot analysis of Sir2 and core histone proteins (H3, H4) in WT (empty vector or pGAL H3/H4), spp1Δ (empty vector or pGAL H3/H4) cells. (I) qRT–PCR analysis of the transcription of telomere-proximal genes in WT (empty vector or pGAL H3/H4), spp1Δ (empty vector or pGAL H3/H4) cells. (J) Western blot analysis of Sir2 in WT H3, H3K4A, set1Δ, and spp1Δ mutants treated with or without 10 mM CQ. (K, L) Western blot analysis of GFP-Atg8 and free GFP in WT H3, H3K4A, WT, set1Δ, and spp1Δ cells. Data represent the mean ± SE of three independent experiments. For (A, B, C, D, E, G, I, K, L), data represent the mean ± SE of three independent experiments. *P < 0.05; **P < 0.01; ***P < 0.001. Source data are available for this figure.
Figure S7.
Figure S7.. Telomere silencing is reduced during replicative aging.
(A) Western blot analysis of histones when cells were aged for 0–6 d in YPD medium. Right panel: Coomassie blue staining of the same samples. (B) Histogram showing the fraction of genes down-regulated (red) and up-regulated (blue) in aged cells when plotted as a function of their distance to the nearest telomeres. The Mother Enrichment Program yeast cells were grown to log phase and then treated with β-estradiol for 7.5, 24, and 48 h. Genes were categorized at 10 kb intervals for up to 60 kb from telomeres. A χ2 value for each 10 kb interval was calculated by comparing the fraction of up-regulated genes in the interval with the genome-wide average to reflect the telomere-proximal bias of derepressed genes. *χ2 > 3.841, P < 0.05; **χ2 > 6.635, P < 0.01; ***χ2 > 10.828, P < 0.001. (C) The transcription of telomere-proximal genes (SEO1, SOR1, SOR2, YCR102C, THI12) was increased during replicative aging as determined by RNA-seq analysis. The RNA-seq dataset analyzed is retrieved from GSE107744.
Figure 6.
Figure 6.. Core histones are reduced during chronological aging.
(A) Western blot analysis of core histones in pre-isolation cells (heterogenous stationary phase cells), NQ cells, and Q cells when grown for 0–6 d in YPD medium. NQ and Q cells were separated by the Percoll density-gradient centrifugation. (B, C, D) Representative fluorescence microscopy images show the loss of histones in NQ cells, Q cells, and pre-isolation cells when grown for 0–6 d in YPD medium. Red color indicates the endogenously expressed histone H2A tagged with tdTomato. Blue color indicates DAPI staining. Scale, 10 µm. (E) Effects of chronological aging on chromatin-bound histones by Western blots. Total (WCE) cytoplasm and chromatin-bound proteins were extracted from cells when grown for 0 and 3 d. S.E., short exposure; L.E., long exposure. (F) qRT–PCR analysis of the transcription of PHO11, SEO1, SOR1, SOR2, YCR102C, PYK1, and KRE1 in WT (BY4741) cells when grown for 0, 1, 3, and 6 d in YPD medium. The mRNA levels of these genes were normalized to ACTIN. Data represent the mean ± SE of three independent experiments. *P < 0.05; **P < 0.01; ***P < 0.001. Source data are available for this figure.
Figure S8.
Figure S8.. Effect of histone mutants on chronological aging.
(A, B, C) Analysis of chronological life span of WT H3, H3R17A (A), H3Q85A (B), and H4T96A (C) mutants. (D) Western blot analysis of core histones and Sir2 in WT and set1Δ atg12Δ cells when chronologically aged for 0–6 d in YPD medium. (E, F) Southern blot analysis of Y′ and telomere length in indicated mutants.
Figure 7.
Figure 7.. Regulation of telomere silencing by the core histones–autophagy–Sir2 axis during chronological aging.
(A) Western blot analysis of core histones and Sir2 in WT and H3/H4 KD cells when grown for 0–6 d in YPD medium. (B) Western blot analysis of core histones (H3, H4) and Sir2 in WT, H3/H4 KD, and H3/H4 KD atg12Δ cells when grown for 0–3 d in YPD medium. (C) qRT–PCR analysis of the transcription of SEO1, SOR1, SOR2, YCR102C, and THI12 in WT and H3/H4 KD cells when grown for 0–6 d in YPD medium. The RNA levels of these genes were normalized to ACTIN. (D, E) Analysis of core histones, Sir2, and telomere silencing in WT and set1Δ cells when grown for 0–6 d in YPD medium. (F, G) Analysis of core histones, Sir2, and telomere silencing in WT and H3R17A cells when grown for 0–6 d in YPD medium. For (C, E, G), data represent the mean ± SE of three independent experiments. *P < 0.05; **P < 0.01; ***P < 0.001. Source data are available for this figure.

References

    1. Ai W, Bertram PG, Tsang CK, Chan TF, Zheng XF (2002) Regulation of subtelomeric silencing during stress response. Mol Cell 10: 1295–1305. 10.1016/s1097-2765(02)00695-0 - DOI - PubMed
    1. Allen C, Buttner S, Aragon AD, Thomas JA, Meirelles O, Jaetao JE, Benn D, Ruby SW, Veenhuis M, Madeo F, et al. (2006) Isolation of quiescent and nonquiescent cells from yeast stationary-phase cultures. J Cell Biol 174: 89–100. 10.1083/jcb.200604072 - DOI - PMC - PubMed
    1. Bruhn C, Ajazi A, Ferrari E, Lanz MC, Batrin R, Choudhary R, Walvekar A, Laxman S, Longhese MP, Fabre E, et al. (2020) The Rad53CHK1/CHK2-Spt21NPAT and Tel1ATM axes couple glucose tolerance to histone dosage and subtelomeric silencing. Nat Commun 11: 4154. 10.1038/s41467-020-17961-4 - DOI - PMC - PubMed
    1. Chakravarti D, LaBella KA, DePinho RA (2021) Telomeres: History, health, and hallmarks of aging. Cell 184: 306–322. 10.1016/j.cell.2020.12.028 - DOI - PMC - PubMed
    1. Chandra T, Ewels PA, Schoenfelder S, Furlan-Magaril M, Wingett SW, Kirschner K, Thuret JY, Andrews S, Fraser P, Reik W (2015) Global reorganization of the nuclear landscape in senescent cells. Cell Rep 10: 471–483. 10.1016/j.celrep.2014.12.055 - DOI - PMC - PubMed

Publication types

MeSH terms

Substances

Associated data

LinkOut - more resources