. 2022 Dec 30;13(1):7913.
doi: 10.1038/s41467-022-35634-2.

Parabrachial-to-parasubthalamic nucleus pathway mediates fear-induced suppression of feeding in male mice

Affiliations

Parabrachial-to-parasubthalamic nucleus pathway mediates fear-induced suppression of feeding in male mice

Takashi Nagashima et al. Nat Commun. .

Abstract

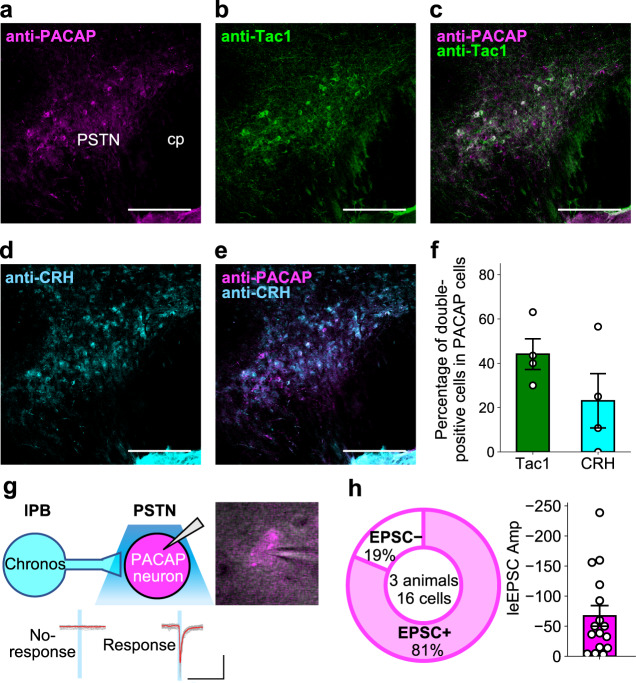
Feeding behavior is adaptively regulated by external and internal environment, such that feeding is suppressed when animals experience pain, sickness, or fear. While the lateral parabrachial nucleus (lPB) plays key roles in nociception and stress, neuronal pathways involved in feeding suppression induced by fear are not fully explored. Here, we investigate the parasubthalamic nucleus (PSTN), located in the lateral hypothalamus and critically involved in feeding behaviors, as a target of lPB projection neurons. Optogenetic activation of lPB-PSTN terminals in male mice promote avoidance behaviors, aversive learning, and suppressed feeding. Inactivation of the PSTN and lPB-PSTN pathway reduces fear-induced feeding suppression. Activation of PSTN neurons expressing pituitary adenylate cyclase-activating polypeptide (PACAP), a neuropeptide enriched in the PSTN, is sufficient for inducing avoidance behaviors and feeding suppression. Blockade of PACAP receptors impaires aversive learning induced by lPB-PSTN photomanipulation. These findings indicate that lPB-PSTN pathway plays a pivotal role in fear-induced feeding suppression.


Conflict of interest statement

The authors declare no competing interests.

Figures

Fig. 1
Fig. 1. Mapping of the projection of lateral PB neurons and characterizations of the lPB-PSTN pathway.
a Schematic of microinjection into the lateral PB (lPB) of the C57BL/6J mice. b Images of fluorescence at the injection site, lPB. Arrowheads point to the cell bodies of Chronos:GFP-expressing cells. scp, superior cerebellar peduncle. c, d Images of fluorescence at the projection sites of lPB neurons, PSTN (c) and CeA (d). cp, cerebral peduncle. Scale bars represent 200 μm. Experiments were repeated independently in at least two mice with similar results. e, f Schematic illustration and representative image of microinjection of CTB555, a retrograde tracer, into the PSTN of C57BL/6J mice. Scale bar represents 500 μm. g, h Representative image showing the retrogradely labeled PB neurons (g), and image merged with DAPI (h). Scale bars represent 50 μm (inset) or 500  μm. Experiments were repeated independently in at least three mice with similar results. i Bilateral injection of AAV-Syn-Chronos:GFP into lPB of C57BL/6J mice. j Traces of EPSCs (gray, 15 consecutive responses; red, average) evoked by photo-stimulation (every 20 s, 5-ms duration). Data are represented as mean + SEM. Scale bar, 50 pA and 10 ms. Right panel represents summary of the EPSC amplitudes (n = 8 cells). k Firing patterns of PSTN neurons (n = 21 cells). Scale bar, 20 mV and 200 ms. See also Supplementary Fig. 1.
Fig. 2
Fig. 2. Photoactivation of the lPB-PSTN promotes avoidance behavior and aversive learning.
a Schematic of microinjection and placement of the LED cannula unit of the C57BL/6J mouse. b Images of the projection site, in the PSTN (top) and the injection site in the lPB (bottom). The dashed line in the top image indicates the position of the optic fiber. Scale bars, 200 μm. scp, superior cerebellar peduncle. More than five independent experiments were conducted and similar results were obtained. c Schematic illustrations of the Y-shaped apparatus. d Experimental schedule of the place avoidance test. e, f Density plots and a scatter plot showing the position of a representative YFP (e) and Chronos (f) mouse every 0.5 s in the 10-min conditioning session (top). Time spent in each arm during each 2-min interval (bottom) (YFP, n = 15; Chronos, n = 16). g, h Summary of ratios of time spent in and entries into Arm 2/Arm 3 for 5–10 min of the conditioning session (YFP, n = 15; Chronos, n = 16). i, j Heatmaps represent averaged moving speed of each mouse during the 10-min conditioning session. k Average speed for a second after mice left the LED area during the 10-min conditioning session (YFP, n = 15; Chronos, n = 16). l Time spent in the LED area during the 10-min conditioning session (YFP, n = 15; Chronos, n = 16). m Correlations of time spent in LED area and moving speed after leaving LED area. Gray and green plots indicate YFP and Chronos mice, respectively. Regression lines were drawn with 95% confidence intervals. Pearson’s correlation coefficients were shown (YFP, r = 0.12, p = 0.67; Chronos, r = –0.62, p = 0.02). n, o The position of a mouse in the 10-min retrieval session (top) and the time spent in each arm during each 2-min interval (bottom) (YFP, n = 15; Chronos, n = 16). ps Summary of ratios of time spent in and entries into Arm 2/Arm 3 during the retrieval session (YFP, n = 15; Chronos, n = 16). Data are represented as mean ± SEM (eh, k, l, and ns). n.s., p > 0.05; *p < 0.05; **p < 0.01; and ***p < 0.001 (two-way repeated measures ANOVA followed by Bonferroni post hoc test (e, f, n, and o) and unpaired two-sided t-test (g, h, k, l, and ps)). See also Supplementary Fig. 2 and Supplementary Movie 2.
Fig. 3
Fig. 3. The lPB-PSTN stimulation suppresses feeding.
a Schematic illustration of the feeding test. b, c Each heatmap represents time spent in the area for a representative mouse during a total 6 min with photostimulation (2-min photostimulation period repeated three times). d, e Time course of feeding behavior of YFP (d) and Chronos mice (e). Data are represented as mean ± SEM (YFP, n = 15; Chronos, n = 18). Each circle represents average feeding time every 10 s. Average moving speed every 10 s is shown on the bottom. f, g Heatmaps represent ratios of time spent feeding during LED-on (6 min) and LED-off (6 min) to total feeding time for each individual mouse. h, i Time spent feeding during LED-on and LED-off periods. j Ratios of time spent feeding in LED-on/LED-off periods. k Total time spent feeding during the 12-min observation period. Each circle represents results from one mouse (YFP, n = 15; Chronos, n = 18). Data are represented as mean ± SEM. n.s., p > 0.05; *p < 0.05 (Unpaired two-sided t-test). l Correlations of ratios of time spent feeding and time spent in each arm in the real-time place avoidance (RTPA) test in Fig. 2, which would represent feeding and aversive behavior, respectively. Each dot represents a value obtained from one mouse (gray, YFP; green, Chronos). Regression lines were drawn with 95% confidence intervals. Pearson’s correlation coefficients were shown (YFP, r = –0.06, p = 0.84; Chronos, r = 0.52, p = 0.04). See also Supplementary Fig. 4 and Supplementary Movie 3.
Fig. 4
Fig. 4. Inhibition of PSTN neurons attenuates fear-induced suppression of feeding.
a Schematic of microinjection into the PSTN of the C57BL/6J mouse. b Schematic illustration of fear-induced suppression of feeding. c Cumulative number of small food pellets ingested by mice during the feeding test (Saline, n = 4; CNO, n = 4). The number of pellets was measured before and after each tone period. d The pellet intake during the 1st tone period (Saline, n = 6; CNO, n = 6). e Total food intake during the feeding test session. Each circle represents results from one mouse (Saline, n = 5; CNO, n = 6). Data are represented as mean ± SEM. *p < 0.05 (unpaired two-sided t-test (d, e)). See also Supplementary Fig. 5.
Fig. 5
Fig. 5. Inhibition of the lPB-PSTN pathway attenuates fear-induced suppression of feeding.
a Schematic of microinjection and placement of the LED cannula unit of the C57BL/6J mouse. b Schematic illustration of fear-induced suppression of feeding. c Cumulative number of small food pellets ingested by mice during the feeding test (GFP, n = 4; iChloC, n = 6). d The averaged pellet intake from 2nd tone to 4th tone (GFP, n = 4; iChloC, n = 6). e Total food intake during the feeding test session. Each circle represents results from one mouse (GFP, n = 4; iChloC, n = 6). Data are represented as mean ± SEM. *p < 0.05; **p < 0.01 (unpaired two-sided t-test (d, e)).
Fig. 6
Fig. 6. PACAPPSTN neurons overlap both Tac1PSTN and CRHPSTN neurons.
ae PACAP, Tac1, and CRH immune-positive neurons in the PSTN. Scale bars represent 200 μm. cp, cerebral peduncle. Experiments were repeated independently in at least four mice with similar results. f Quantification of the percentage of PACAP neurons co-expressing Tac1 or CRH (n = 4 images). It was calculated as the ratio of the number of cells (double-positive cells/PACAP-positive cells). g Schematic of the electrophysiological analysis and representative traces of EPSCs (gray, 15 consecutive responses; red, average) evoked by photo-stimulation (every 20 s, 5-ms duration). Scale bar, 100 pA and 50 ms. h Proportion of the recorded PACAPPSTN neurons with EPSCs (EPSC–, n = 3 cells; EPSC+, n = 13 cells) and summary of light-evoked EPSC amplitudes (n = 16 cells). Data are represented as mean ± SEM.
Fig. 7
Fig. 7. Photoactivation of the PACAPPSTN neurons promotes avoidance behaviors and aversive learning.
a Schematic illustration of bilateral injection into Pacap-IRES-Cre mice. b, c Representative images of fluorescent at the injection site. Arrowheads indicate the cell bodies of Chronos:GFP-expressing cells. Scale bars represent 200  μm (b) or 50 μm (c). cp, cerebral peduncle. More than three independent experiments were conducted and similar results were obtained. d Experimental schedule of the place avoidance test. e Density and scatter plots showing the position of a representative mouse during the conditioning session (top, GFP; bottom, Chronos). fh Summary of ratios of time spent in each arm, entries into each arm, and time spent in the LED area per entry during the latter half (5–10 min) of the conditioning session (GFP, n = 10; Chronos, n = 10). i Density and scatter plots showing position of a representative mouse during the retrieval session (top, GFP; bottom, Chronos). jl Summary of ratios of time spent in each arm, entries into each arm, and time spent in the LED area per entry during the first half (0–5 min) of the retrieval session (j, k GFP, n = 10; Chronos, n = 10, l GFP, n = 9; Chronos, n = 10). Each circle represents results from one mouse. Data are represented as mean ± SEM. n.s., p > 0.05; *p < 0.05 (unpaired two-sided t-test). See also Supplementary Fig. 7.
Fig. 8
Fig. 8. Feeding behavior is suppressed by activation of the PACAPPSTN neurons.
a Bilateral injection into Pacap-IRES-Cre mice. b Schematic illustration of the feeding test. c, d Each heatmap represents the time spent in each area for a representative mouse during the 12-min observation period. e, f Heatmaps represent ratios of time spent feeding during LED-on (6 min) and LED-off (6 min) to total feeding time for each individual mouse. g Time spent feeding during a 6-min LED-on period. h Time spent feeding during 6-min LED-off period. i Ratio of time spent feeding during LED-on/LED-off periods. j Total time spent feeding during the 12-min observation period. Each circle represents results from one mouse (GFP, n = 10; Chronos, n = 10). Data are represented as mean ± SEM. n.s., p > 0.05; *p < 0.05 (Unpaired two-sided t-test). k Correlations of ratio of time spent feeding during LED-on/LED-off periods and the ratio of time spent in each arm in the real-time place avoidance (RTPA) test in Fig. 5, which would represent feeding and avoidance behavior, respectively. Each dot represents a value obtained for one mouse (gray, GFP; green, Chronos). Regression lines (gray, GFP; green, Chronos) were drawn with 95% confidence intervals. Pearson’s correlation coefficients were shown (YFP, r = 0.05, p = 0.90; Chronos, r = 0.75, p = 0.01).
Fig. 9
Fig. 9. Inhibition of PACAPPSTN attenuated effects of the lPB-PSTN pathway.
a Schematic of microinjection and placement of the LED cannula unit. b Experimental schedule of the real-time place aversion test using C57BL/6J mice. Saline or CNO was injected 30 min before the conditioning session. ch Summary of time spent in each arm and summary of ratio of time spent in each arm during the habituation session (c, d), the conditioning session (5–10 min) (e, f), and the retrieval session (0–4 min) (g, h). Each circle represents results from one mouse (n = 9). Data are represented as mean ± SEM. n.s., p > 0.05; *p < 0.05 (two-sided Wilcoxon matched-pairs signed rank test (d, f, h) and Wilcoxon matched-pairs signed rank test followed by correction with Holm method (c, e, g)).
Fig. 10
Fig. 10. Blockade of PACAP receptor impairs aversive memory induced by the lPB-PSTN.
a Schematic of microinjection and placement of the LED cannula unit. b Experimental schedule of the real-time place aversion test using C57BL/6J mice. The PACAP receptor antagonist PA8 was injected 30 min before the conditioning session. c, d Summary of time spent in each arm (c) and the number of entries into each arm (d) during the habituation session. e Effects of PA8 administration on averaged locomotion speed of YFP mice during the conditioning session (Veh, n = 5; PA8, n = 5). f Effects of PA8 administration on the escape behavior of Chronos mice during the conditioning session (Veh, n = 6; PA8, n = 7). g, h Summary of time spent in each arm (g) and the number of entries into each arm (h) during 0–10 min of the conditioning session. i Density plots and scatter plots showing the position of a representative mouse in a conditioning session (top) and retrieval session (bottom) in Chronos mice. Plots shown are for the same mouse across sessions. j, k Summary of time spent in each arm (j) and the number of entries into each arm (k) during 0–10 min of the retrieval session. Each circle represents results from one mouse (YFP-Veh, n = 5; YFP-PA8, n = 5; Chronos-Veh, n = 6; Chronos-PA8, n = 7). Data are represented as mean ± SEM. n.s., p > 0.05; *p < 0.05; **p < 0.01 (Unpaired two-sided t-test (e, f) and paired two-sided t-test followed by correction with Holm method (c, d, g, h, j, k)). See also Supplementary Fig. 8.

Similar articles

Cited by

References

    1. Wang Y, et al. A bed nucleus of stria terminalis microcircuit regulating inflammation-associated modulation of feeding. Nat. Commun. 2019;10:1–13. - PMC - PubMed
    1. Yang B, et al. Locus coeruleus anchors a trisynaptic circuit controlling fear-induced suppression of feeding. Neuron. 2021;109:823–838.e6. doi: 10.1016/j.neuron.2020.12.023. - DOI - PMC - PubMed
    1. Alhadeff AL, et al. A neural circuit for the suppression of pain by a competing need state. Cell. 2018;173:140–152.e15. doi: 10.1016/j.cell.2018.02.057. - DOI - PMC - PubMed
    1. Deacon, R. M. J. Hyponeophagia: a measure of anxiety in the mouse. J. Vis. Exp. 1–4 (2011). - PMC - PubMed
    1. Chen JY, Campos CA, Jarvie BC, Palmiter RD. Parabrachial CGRP neurons establish and sustain aversive taste memories. Neuron. 2018;100:891–899.e5. doi: 10.1016/j.neuron.2018.09.032. - DOI - PMC - PubMed

Publication types

Substances

LinkOut - more resources